Estonia Cheese Culture Market (2026-2032) | Trends, Analysis, Industry, Outlook, Growth, Segmentation, Value, Forecast, Size & Revenue, Companies, Competitive Landscape, Share
Market Forecast By Product (Cheddar, Continental, Pasta, Filata/Mozzarella, Cottage, Propionic, Soft, Grana), By Type (Mesophilic Culture, Thermophilic Culture, Starter Culture, Non Starter Culture, Probiotics), By Category (Fresh Cheese, Soft Cheese, Hard Cheese), By Cultures (Ripening, Protective Cultures, Kosher), By Application (Strains, Cultures Compounding), By Sales Channel (Specialty Store, Direct Store, Third Party Online, Other Sales Channel) And Competitive Landscape
| Product Code: ETC7128703 | Publication Date: Sep 2024 | Updated Date: Apr 2026 | Product Type: Market Research Report | |
| Publisher: 6Wresearch | Author: Sumit Sagar | No. of Pages: 75 | No. of Figures: 35 | No. of Tables: 20 |
Estonia Cheese Culture Market Size (2020-2030)
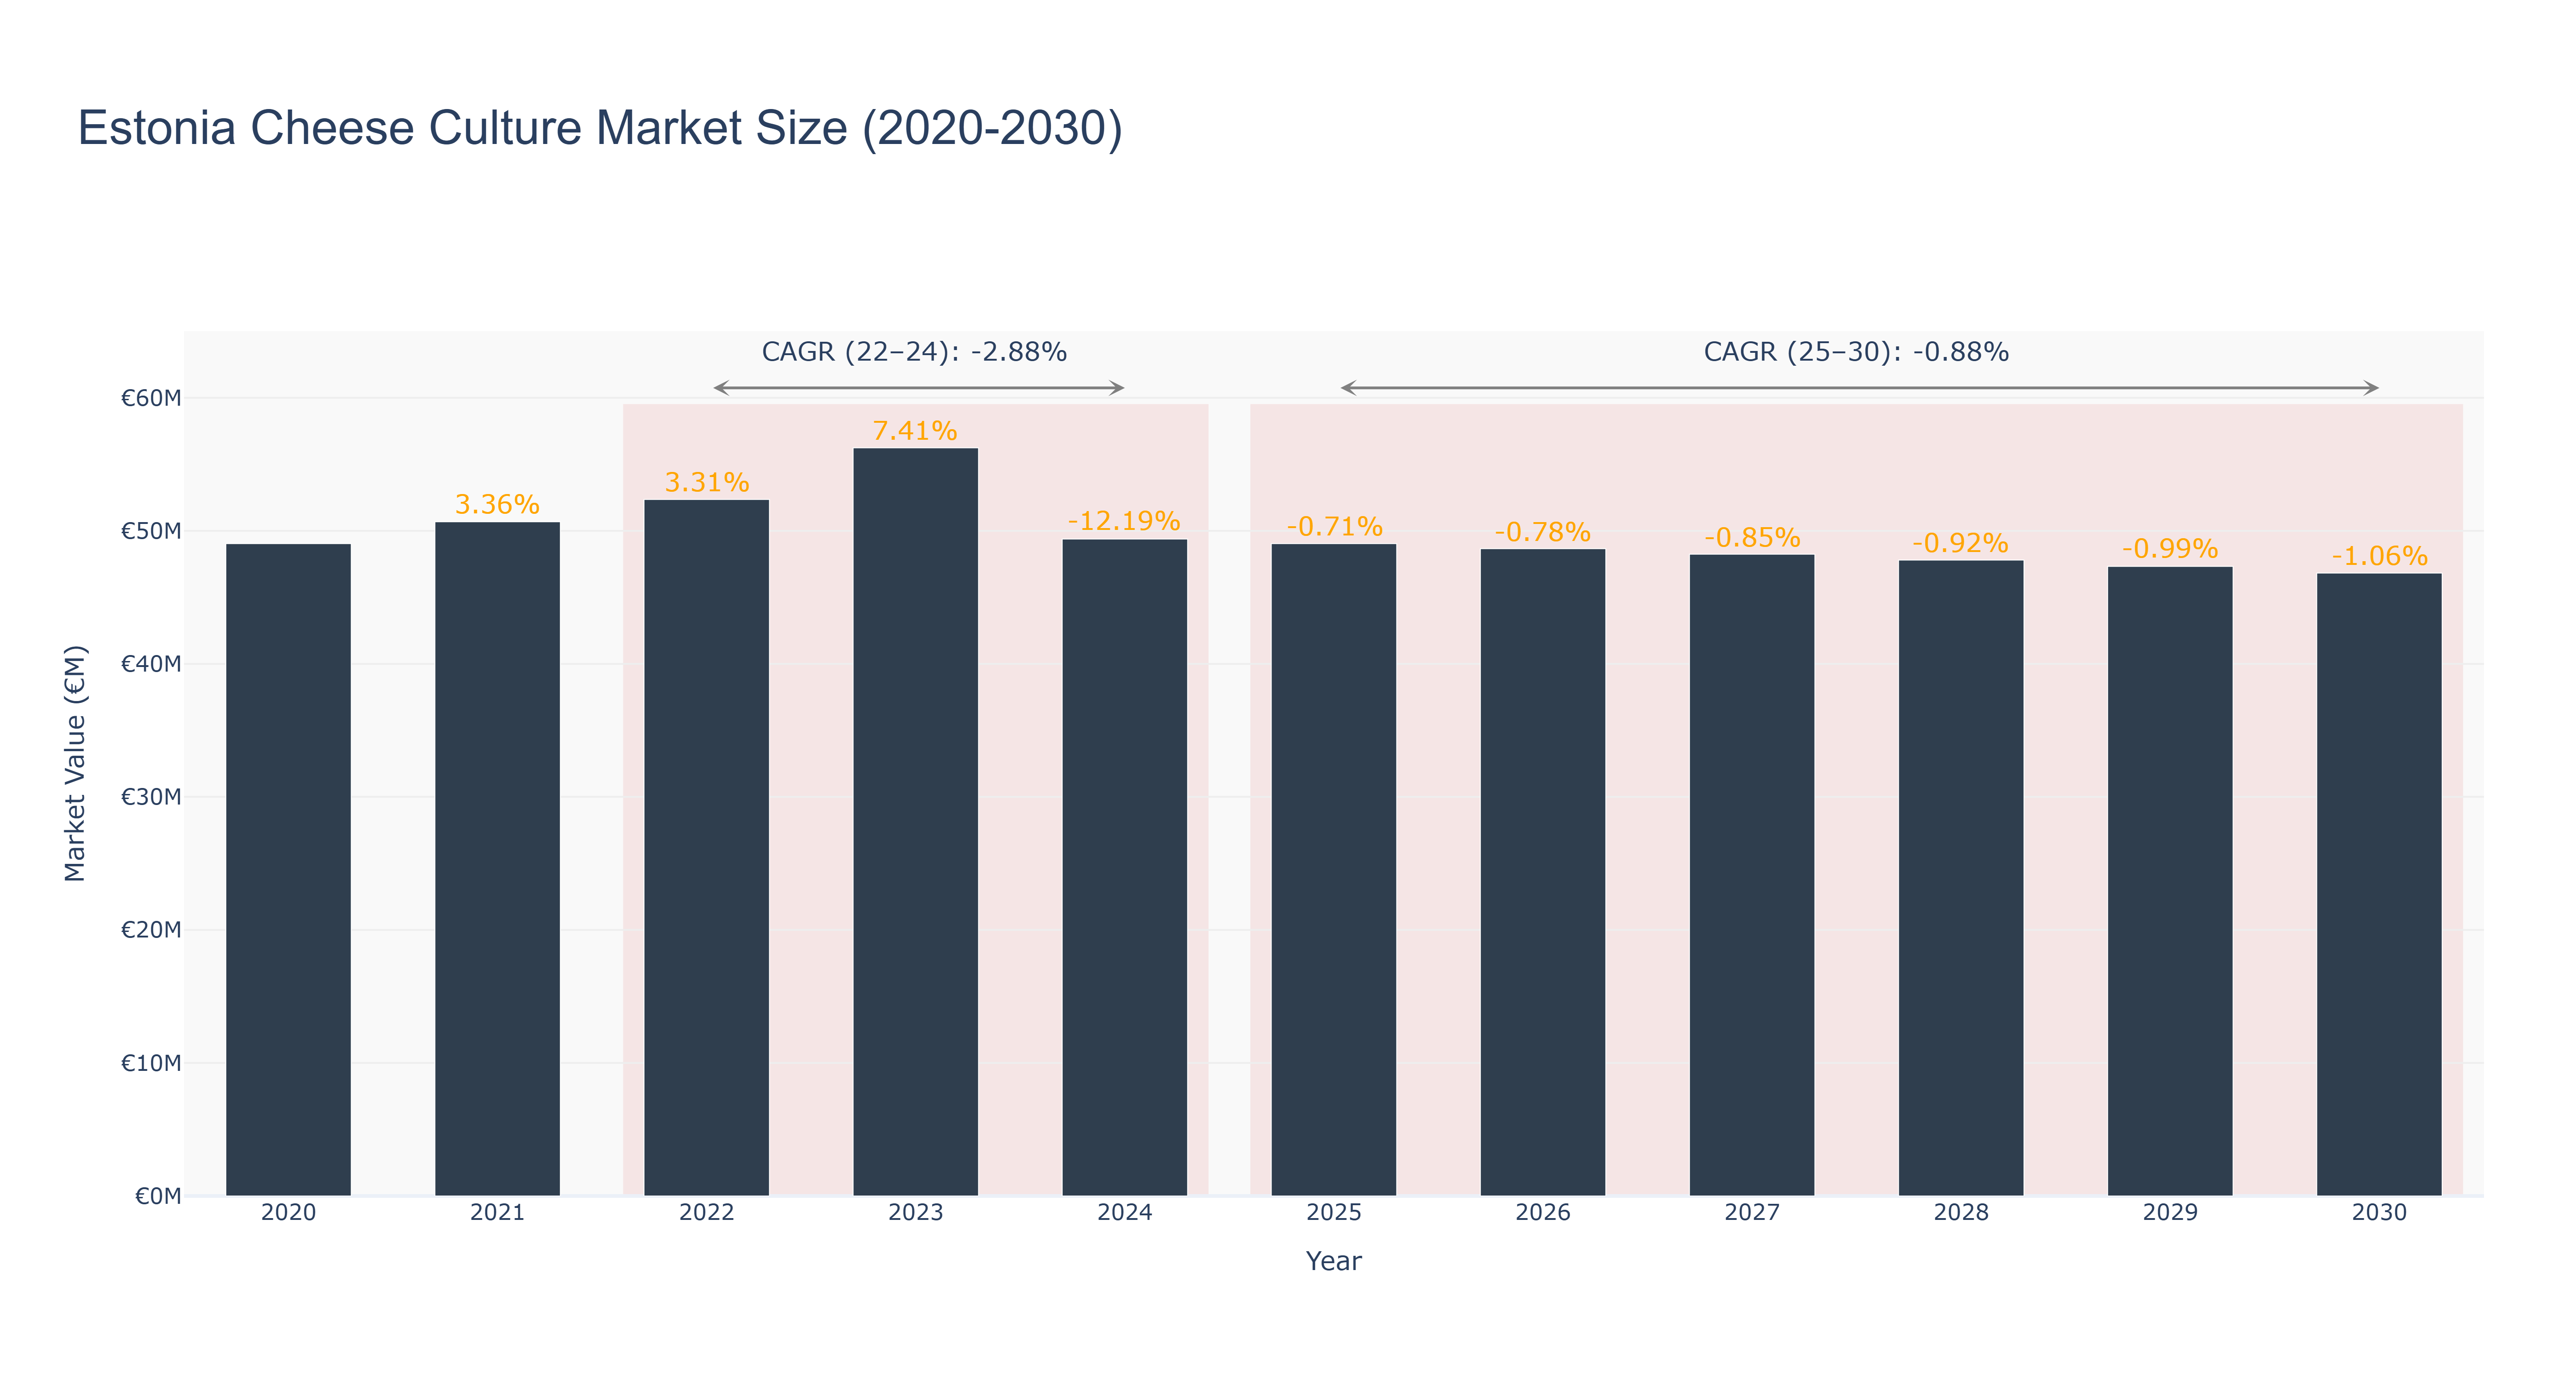
The Estonia Cheese Culture Market experienced a peak market size of €56.24 million in 2023. From 2020 to 2024, the actual market size fluctuated, reaching a low of €49.04 million in 2025. The forecasted market size from 2025 to 2030 is expected to continue declining, with a CAGR of -0.88%. The market faced challenges with a negative CAGR of -2.88% from 2022 to 2024, impacting its overall growth. The downward trend can be attributed to changing consumer preferences, increased competition, and economic uncertainties. Looking ahead, the market is focusing on enhancing product innovation and expanding into new distribution channels to counteract the decline. Recent developments include collaborations with local dairy farms to source high-quality ingredients and the launch of a sustainability initiative to attract environmentally conscious consumers.
Estonia Cheese Culture Market: Production & Trade Performance (2019-2025)
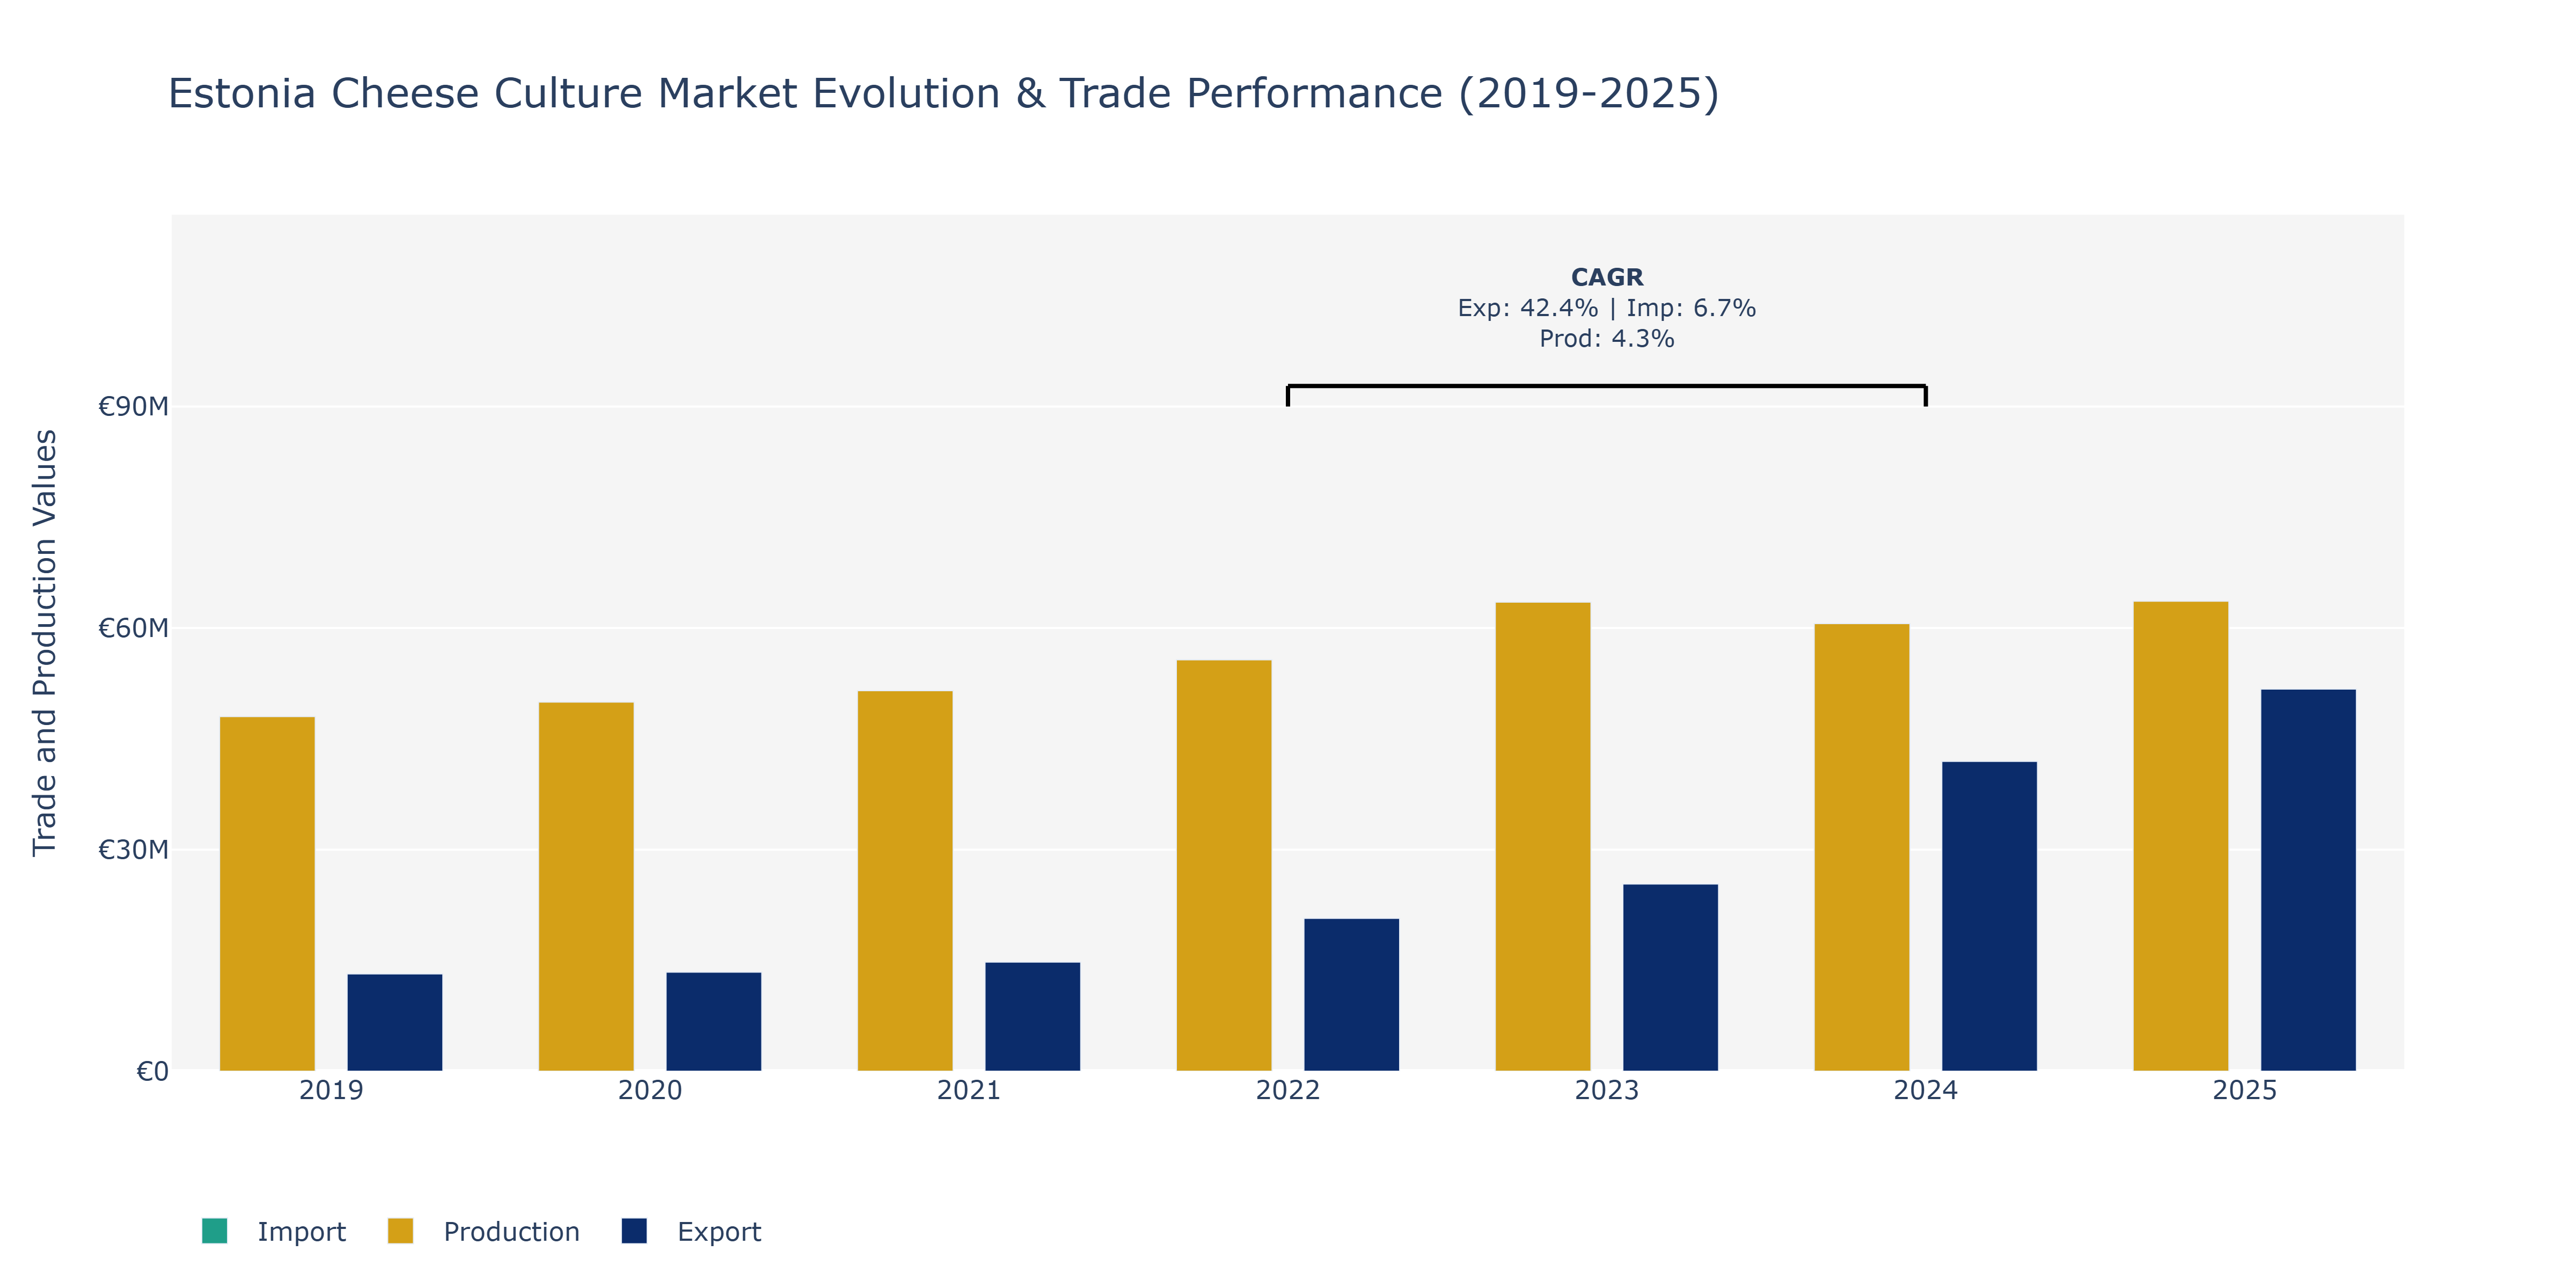
In the Estonia Cheese Culture Market, exports have shown a remarkable growth trajectory over the years, increasing from €13.17 million in 2019 to €51.75 million in 2025. This substantial rise can be attributed to the expanding global demand for Estonian cheese products renowned for their quality and unique flavors. Imports also experienced steady growth, reaching €19.20 million in 2025, reflecting the market's reliance on imported raw materials or specialized equipment. Production witnessed fluctuations, with a peak of €63.64 million in 2025 after a temporary decline in 2024. These fluctuations could be linked to factors such as variations in milk supply, technological advancements impacting efficiency, and evolving consumer preferences towards artisanal or organic cheese products. The market's exports dominance underscores Estonia's competitive edge in cheese culture, backed by increasing production capabilities and strategic market positioning.
Key Highlights of the Report:
- Estonia Cheese Culture Market Outlook
- Market Size of Estonia Cheese Culture Market, 2025
- Forecast of Estonia Cheese Culture Market, 2032
- Historical Data and Forecast of Estonia Cheese Culture Revenues & Volume for the Period 2022 - 2032
- Estonia Cheese Culture Market Trend Evolution
- Estonia Cheese Culture Market Drivers and Challenges
- Estonia Cheese Culture Price Trends
- Estonia Cheese Culture Porter's Five Forces
- Estonia Cheese Culture Industry Life Cycle
- Historical Data and Forecast of Estonia Cheese Culture Market Revenues & Volume By Product for the Period 2022 - 2032
- Historical Data and Forecast of Estonia Cheese Culture Market Revenues & Volume By Cheddar for the Period 2022 - 2032
- Historical Data and Forecast of Estonia Cheese Culture Market Revenues & Volume By Continental for the Period 2022 - 2032
- Historical Data and Forecast of Estonia Cheese Culture Market Revenues & Volume By Pasta for the Period 2022 - 2032
- Historical Data and Forecast of Estonia Cheese Culture Market Revenues & Volume By Filata/Mozzarella for the Period 2022 - 2032
- Historical Data and Forecast of Estonia Cheese Culture Market Revenues & Volume By Cottage for the Period 2022 - 2032
- Historical Data and Forecast of Estonia Cheese Culture Market Revenues & Volume By Propionic for the Period 2022 - 2032
- Historical Data and Forecast of Estonia Cheese Culture Market Revenues & Volume By Soft for the Period 2022 - 2032
- Historical Data and Forecast of Estonia Cheddar Cheese Culture Market Revenues & Volume By Grana for the Period 2022 - 2032
- Historical Data and Forecast of Estonia Cheese Culture Market Revenues & Volume By Type for the Period 2022 - 2032
- Historical Data and Forecast of Estonia Cheese Culture Market Revenues & Volume By Mesophilic Culture for the Period 2022 - 2032
- Historical Data and Forecast of Estonia Cheese Culture Market Revenues & Volume By Thermophilic Culture for the Period 2022 - 2032
- Historical Data and Forecast of Estonia Cheese Culture Market Revenues & Volume By Starter Culture for the Period 2022 - 2032
- Historical Data and Forecast of Estonia Cheese Culture Market Revenues & Volume By Non Starter Culture for the Period 2022 - 2032
- Historical Data and Forecast of Estonia Cheese Culture Market Revenues & Volume By Probiotics for the Period 2022 - 2032
- Historical Data and Forecast of Estonia Cheese Culture Market Revenues & Volume By Category for the Period 2022 - 2032
- Historical Data and Forecast of Estonia Cheese Culture Market Revenues & Volume By Fresh Cheese for the Period 2022 - 2032
- Historical Data and Forecast of Estonia Cheese Culture Market Revenues & Volume By Soft Cheese for the Period 2022 - 2032
- Historical Data and Forecast of Estonia Cheese Culture Market Revenues & Volume By Hard Cheese for the Period 2022 - 2032
- Historical Data and Forecast of Estonia Cheese Culture Market Revenues & Volume By Cultures for the Period 2022 - 2032
- Historical Data and Forecast of Estonia Cheese Culture Market Revenues & Volume By Ripening for the Period 2022 - 2032
- Historical Data and Forecast of Estonia Cheese Culture Market Revenues & Volume By Protective Cultures for the Period 2022 - 2032
- Historical Data and Forecast of Estonia Cheese Culture Market Revenues & Volume By Kosher for the Period 2022 - 2032
- Historical Data and Forecast of Estonia Cheese Culture Market Revenues & Volume By Application for the Period 2022 - 2032
- Historical Data and Forecast of Estonia Cheese Culture Market Revenues & Volume By Strains for the Period 2022 - 2032
- Historical Data and Forecast of Estonia Cheese Culture Market Revenues & Volume By Cultures Compounding for the Period 2022 - 2032
- Historical Data and Forecast of Estonia Cheese Culture Market Revenues & Volume By Sales Channel for the Period 2022 - 2032
- Historical Data and Forecast of Estonia Cheese Culture Market Revenues & Volume By Specialty Store for the Period 2022 - 2032
- Historical Data and Forecast of Estonia Cheese Culture Market Revenues & Volume By Direct Store for the Period 2022 - 2032
- Historical Data and Forecast of Estonia Cheese Culture Market Revenues & Volume By Third Party Online for the Period 2022 - 2032
- Historical Data and Forecast of Estonia Cheese Culture Market Revenues & Volume By Other Sales Channel for the Period 2022 - 2032
- Estonia Cheese Culture Import Export Trade Statistics
- Market Opportunity Assessment By Product
- Market Opportunity Assessment By Type
- Market Opportunity Assessment By Category
- Market Opportunity Assessment By Cultures
- Market Opportunity Assessment By Application
- Market Opportunity Assessment By Sales Channel
- Estonia Cheese Culture Top Companies Market Share
- Estonia Cheese Culture Competitive Benchmarking By Technical and Operational Parameters
- Estonia Cheese Culture Company Profiles
- Estonia Cheese Culture Key Strategic Recommendations
Frequently Asked Questions About the Market Study (FAQs):
6Wresearch actively monitors the Estonia Cheese Culture Market and publishes its comprehensive annual report, highlighting emerging trends, growth drivers, revenue analysis, and forecast outlook. Our insights help businesses to make data-backed strategic decisions with ongoing market dynamics. Our analysts track relevent industries related to the Estonia Cheese Culture Market, allowing our clients with actionable intelligence and reliable forecasts tailored to emerging regional needs.
Yes, we provide customisation as per your requirements. To learn more, feel free to contact us on sales@6wresearch.com
1 Executive Summary |
2 Introduction |
2.1 Key Highlights of the Report |
2.2 Report Description |
2.3 Market Scope & Segmentation |
2.4 Research Methodology |
2.5 Assumptions |
3 Estonia Cheese Culture Market Overview |
3.1 Estonia Country Macro Economic Indicators |
3.2 Estonia Cheese Culture Market Revenues & Volume, 2022 & 2032F |
3.3 Estonia Cheese Culture Market - Industry Life Cycle |
3.4 Estonia Cheese Culture Market - Porter's Five Forces |
3.5 Estonia Cheese Culture Market Revenues & Volume Share, By Product, 2022 & 2032F |
3.6 Estonia Cheese Culture Market Revenues & Volume Share, By Type, 2022 & 2032F |
3.7 Estonia Cheese Culture Market Revenues & Volume Share, By Category, 2022 & 2032F |
3.8 Estonia Cheese Culture Market Revenues & Volume Share, By Cultures, 2022 & 2032F |
3.9 Estonia Cheese Culture Market Revenues & Volume Share, By Application, 2022 & 2032F |
3.10 Estonia Cheese Culture Market Revenues & Volume Share, By Sales Channel, 2022 & 2032F |
4 Estonia Cheese Culture Market Dynamics |
4.1 Impact Analysis |
4.2 Market Drivers |
4.2.1 Increasing consumer awareness and demand for artisanal and specialty cheeses |
4.2.2 Growing popularity of cheese-based dishes in the culinary industry |
4.2.3 Rising trend of healthy eating and preference for natural and organic products |
4.3 Market Restraints |
4.3.1 Fluctuations in milk prices and availability impacting cheese production costs |
4.3.2 Intense competition from imported cheeses in the domestic market |
4.3.3 Regulatory challenges related to food safety standards and certifications |
5 Estonia Cheese Culture Market Trends |
6 Estonia Cheese Culture Market, By Types |
6.1 Estonia Cheese Culture Market, By Product |
6.1.1 Overview and Analysis |
6.1.2 Estonia Cheese Culture Market Revenues & Volume, By Product, 2022 - 2032F |
6.1.3 Estonia Cheese Culture Market Revenues & Volume, By Cheddar, 2022 - 2032F |
6.1.4 Estonia Cheese Culture Market Revenues & Volume, By Continental, 2022 - 2032F |
6.1.5 Estonia Cheese Culture Market Revenues & Volume, By Pasta, 2022 - 2032F |
6.1.6 Estonia Cheese Culture Market Revenues & Volume, By Filata/Mozzarella, 2022 - 2032F |
6.1.7 Estonia Cheese Culture Market Revenues & Volume, By Cottage, 2022 - 2032F |
6.1.8 Estonia Cheese Culture Market Revenues & Volume, By Propionic, 2022 - 2032F |
6.1.9 Estonia Cheese Culture Market Revenues & Volume, By Grana, 2022 - 2032F |
6.1.10 Estonia Cheese Culture Market Revenues & Volume, By Grana, 2022 - 2032F |
6.2 Estonia Cheese Culture Market, By Type |
6.2.1 Overview and Analysis |
6.2.2 Estonia Cheese Culture Market Revenues & Volume, By Mesophilic Culture, 2022 - 2032F |
6.2.3 Estonia Cheese Culture Market Revenues & Volume, By Thermophilic Culture, 2022 - 2032F |
6.2.4 Estonia Cheese Culture Market Revenues & Volume, By Starter Culture, 2022 - 2032F |
6.2.5 Estonia Cheese Culture Market Revenues & Volume, By Non Starter Culture, 2022 - 2032F |
6.2.6 Estonia Cheese Culture Market Revenues & Volume, By Probiotics, 2022 - 2032F |
6.3 Estonia Cheese Culture Market, By Category |
6.3.1 Overview and Analysis |
6.3.2 Estonia Cheese Culture Market Revenues & Volume, By Fresh Cheese, 2022 - 2032F |
6.3.3 Estonia Cheese Culture Market Revenues & Volume, By Soft Cheese, 2022 - 2032F |
6.3.4 Estonia Cheese Culture Market Revenues & Volume, By Hard Cheese, 2022 - 2032F |
6.4 Estonia Cheese Culture Market, By Cultures |
6.4.1 Overview and Analysis |
6.4.2 Estonia Cheese Culture Market Revenues & Volume, By Ripening, 2022 - 2032F |
6.4.3 Estonia Cheese Culture Market Revenues & Volume, By Protective Cultures, 2022 - 2032F |
6.4.4 Estonia Cheese Culture Market Revenues & Volume, By Kosher, 2022 - 2032F |
6.5 Estonia Cheese Culture Market, By Application |
6.5.1 Overview and Analysis |
6.5.2 Estonia Cheese Culture Market Revenues & Volume, By Strains, 2022 - 2032F |
6.5.3 Estonia Cheese Culture Market Revenues & Volume, By Cultures Compounding, 2022 - 2032F |
6.6 Estonia Cheese Culture Market, By Sales Channel |
6.6.1 Overview and Analysis |
6.6.2 Estonia Cheese Culture Market Revenues & Volume, By Specialty Store, 2022 - 2032F |
6.6.3 Estonia Cheese Culture Market Revenues & Volume, By Direct Store, 2022 - 2032F |
6.6.4 Estonia Cheese Culture Market Revenues & Volume, By Third Party Online, 2022 - 2032F |
6.6.5 Estonia Cheese Culture Market Revenues & Volume, By Other Sales Channel, 2022 - 2032F |
7 Estonia Cheese Culture Market Import-Export Trade Statistics |
7.1 Estonia Cheese Culture Market Export to Major Countries |
7.2 Estonia Cheese Culture Market Imports from Major Countries |
8 Estonia Cheese Culture Market Key Performance Indicators |
8.1 Percentage of consumers opting for locally produced artisanal cheeses |
8.2 Number of new cheese varieties introduced in the market |
8.3 Growth in the number of specialty cheese shops or sections in retail stores. |
9 Estonia Cheese Culture Market - Opportunity Assessment |
9.1 Estonia Cheese Culture Market Opportunity Assessment, By Product, 2022 & 2032F |
9.2 Estonia Cheese Culture Market Opportunity Assessment, By Type, 2022 & 2032F |
9.3 Estonia Cheese Culture Market Opportunity Assessment, By Category, 2022 & 2032F |
9.4 Estonia Cheese Culture Market Opportunity Assessment, By Cultures, 2022 & 2032F |
9.5 Estonia Cheese Culture Market Opportunity Assessment, By Application, 2022 & 2032F |
9.6 Estonia Cheese Culture Market Opportunity Assessment, By Sales Channel, 2022 & 2032F |
10 Estonia Cheese Culture Market - Competitive Landscape |
10.1 Estonia Cheese Culture Market Revenue Share, By Companies, 2025 |
10.2 Estonia Cheese Culture Market Competitive Benchmarking, By Operating and Technical Parameters |
11 Company Profiles |
12 Recommendations |
13 Disclaimer |
Global Go To Market Strategy - 2030
Export potential enables firms to identify high-growth global markets with greater confidence by combining advanced trade intelligence with a structured quantitative methodology. The framework analyzes emerging demand trends and country-level import patterns while integrating macroeconomic and trade datasets such as GDP and population forecasts, bilateral import–export flows, tariff structures, elasticity differentials between developed and developing economies, geographic distance, and import demand projections. Using weighted trade values from 2020–2024 as the base period to project country-to-country export potential for 2030, these inputs are operationalized through calculated drivers such as gravity model parameters, tariff impact factors, and projected GDP per-capita growth. Through an analysis of hidden potentials, demand hotspots, and market conditions that are most favorable to success, this method enables firms to focus on target countries, maximize returns, and global expansion with data, backed by accuracy.
By factoring in the projected importer demand gap that is currently unmet and could be potential opportunity, it identifies the potential for the Exporter (Country) among 190 countries, against the general trade analysis, which identifies the biggest importer or exporter.
To discover high-growth global markets and optimize your business strategy:
Click Here
Pricing
- Single User License$ 1,995
- Department License$ 2,400
- Site License$ 3,120
- Global License$ 3,795

Leadership Perspectives from Industry Events
Search
Thought Leadership and Analyst Meet


Our Clients
6WResearch In News
- India Export Attractiveness Tracker 2026
- India Air Conditioner Market Set for Strong Rebound in 2026 After Weather-Led Correction and GST-Driven Recovery: 6Wresearch
- ADAS in India: How Automatic Emergency Braking, Blind Spot Detection & Driver Monitoring are Transforming Road Safety
- Doha a strategic location for EV manufacturing hub: IPA Qatar
- Demand for luxury TVs surging in the GCC, says Samsung
- Empowering Growth: The Thriving Journey of Bangladesh’s Cable Industry
Latest Reports
- Nicaragua RPG Gaming Market (2026-2032)
- New Zealand RPG Gaming Market (2026-2032)
- Netherlands RPG Gaming Market (2026-2032)
- Nauru RPG Gaming Market (2026-2032)
- Namibia RPG Gaming Market (2026-2032)
- Mozambique RPG Gaming Market (2026-2032)
- Montenegro RPG Gaming Market (2026-2032)
- Mongolia RPG Gaming Market (2026-2032)
- Monaco RPG Gaming Market (2026-2032)
- Micronesia RPG Gaming Market (2026-2032)
Industry Events and Analyst Meet

EV India Expo 2026

HIMTEX 2026

India Refining Summit 2026

India EV Show 2026

EV tech India Expo 2026
Whitepaper
- Middle East & Africa Commercial Security Market Click here to view more.
- Middle East & Africa Fire Safety Systems & Equipment Market Click here to view more.
- GCC Drone Market Click here to view more.
- Middle East Lighting Fixture Market Click here to view more.
- GCC Physical & Perimeter Security Market Click here to view more.