Estonia Gesture Recognition For Smart TV Market (2026-2032) | Share, Outlook, Growth, Companies, Revenue, Trends, Value, Forecast, Analysis, Industry, Segmentation & Size
Market Forecast By Product Type (Software (2D and 3D Image Sensor), Hardware(Image Sensor, IR Proximity Sensor, IR Temperature Sensor)), By Application (Commercial, Household) And Competitive Landscape
| Product Code: ETC5608357 | Publication Date: Nov 2023 | Updated Date: Apr 2026 | Product Type: Market Research Report | |
| Publisher: 6Wresearch | Author: Ravi Bhandari | No. of Pages: 60 | No. of Figures: 30 | No. of Tables: 5 |
Estonia Gesture Recognition For Smart Tv Market Size (2020-2030)
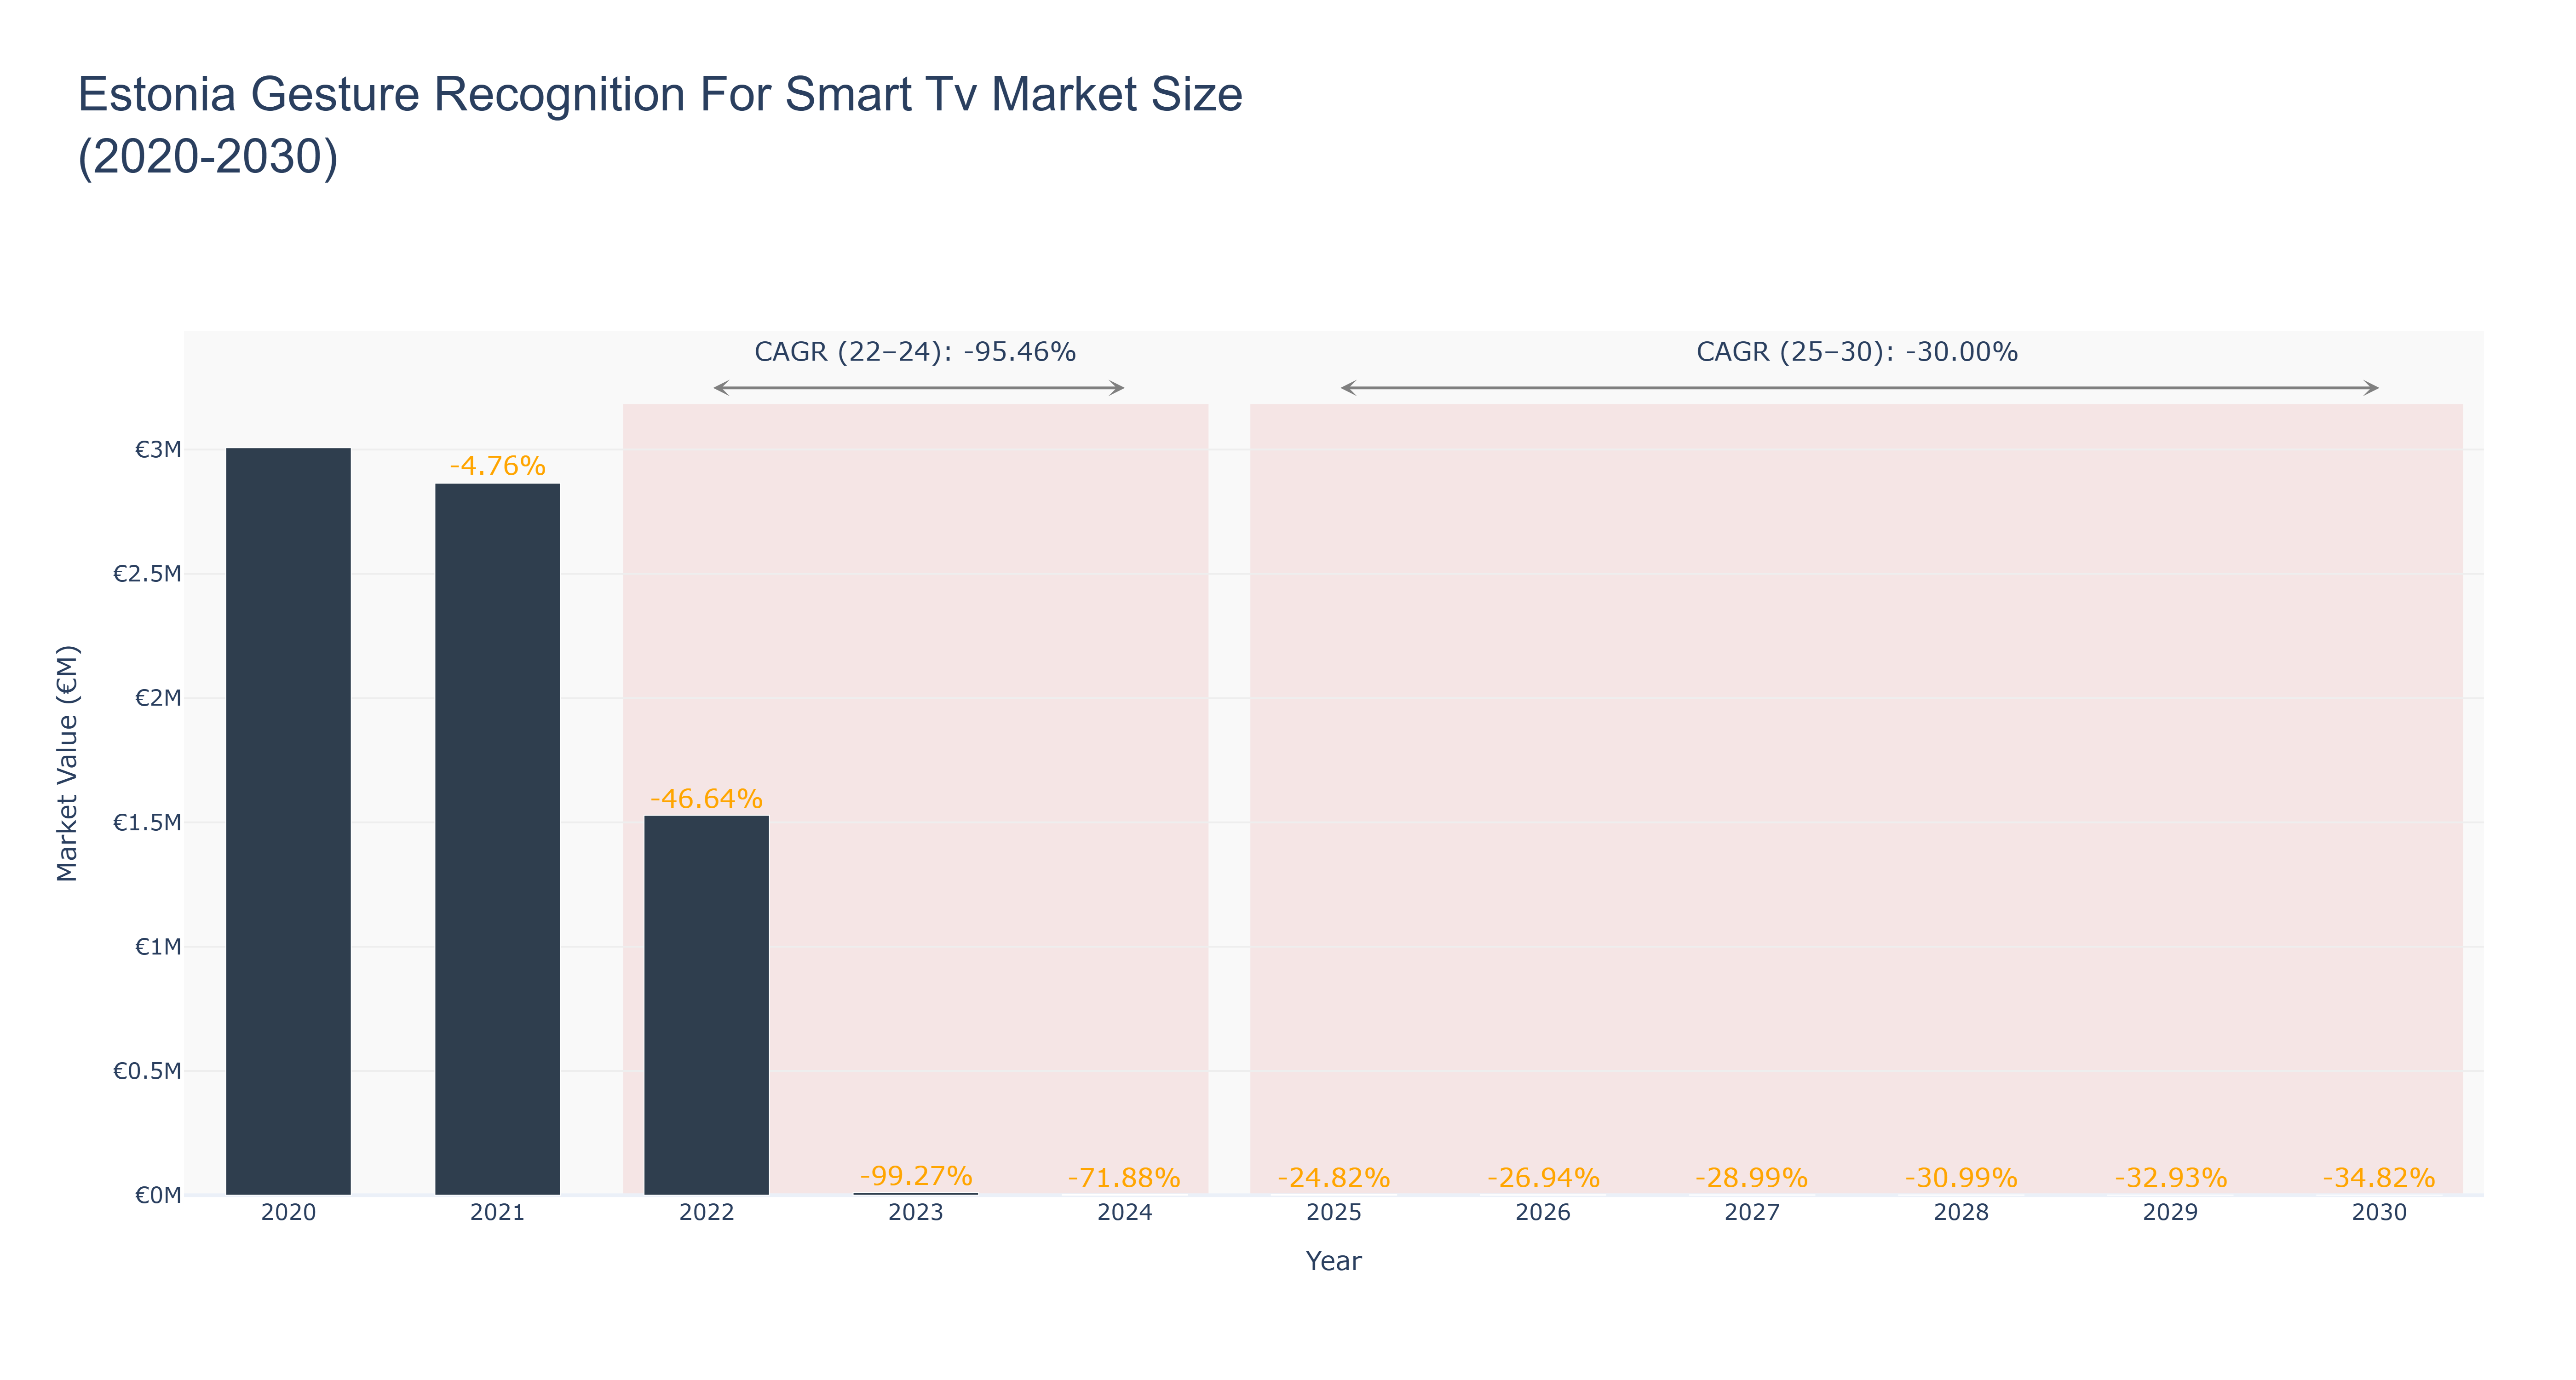
The Estonia Gesture Recognition For Smart TV Market has experienced a dramatic decline, with market size peaking at €3.01 million in 2020 before plummeting to €3.15 thousand in 2024, reflecting a CAGR of -95.46% from 2022 to 2024. This downturn can be attributed to diminishing consumer interest, limited product innovation, and increased competition from alternative technologies. As we look toward the forecasted period from 2025 to 2030, the market is projected to stabilize at significantly lower levels, with sizes decreasing from €2.36 thousand in 2025 to €370.02 by 2030, reflecting a CAGR of -30.00%. While the market faces ongoing challenges, potential drivers for future growth may include advancements in AI and machine learning that could enhance gesture recognition capabilities, along with strategic partnerships aimed at integrating these technologies into consumer electronics. However, without substantial innovation or shifts in consumer demand, recovery remains uncertain.
Estonia Gesture Recognition For Smart Tv Market: Production & Trade Performance (2019-2025)
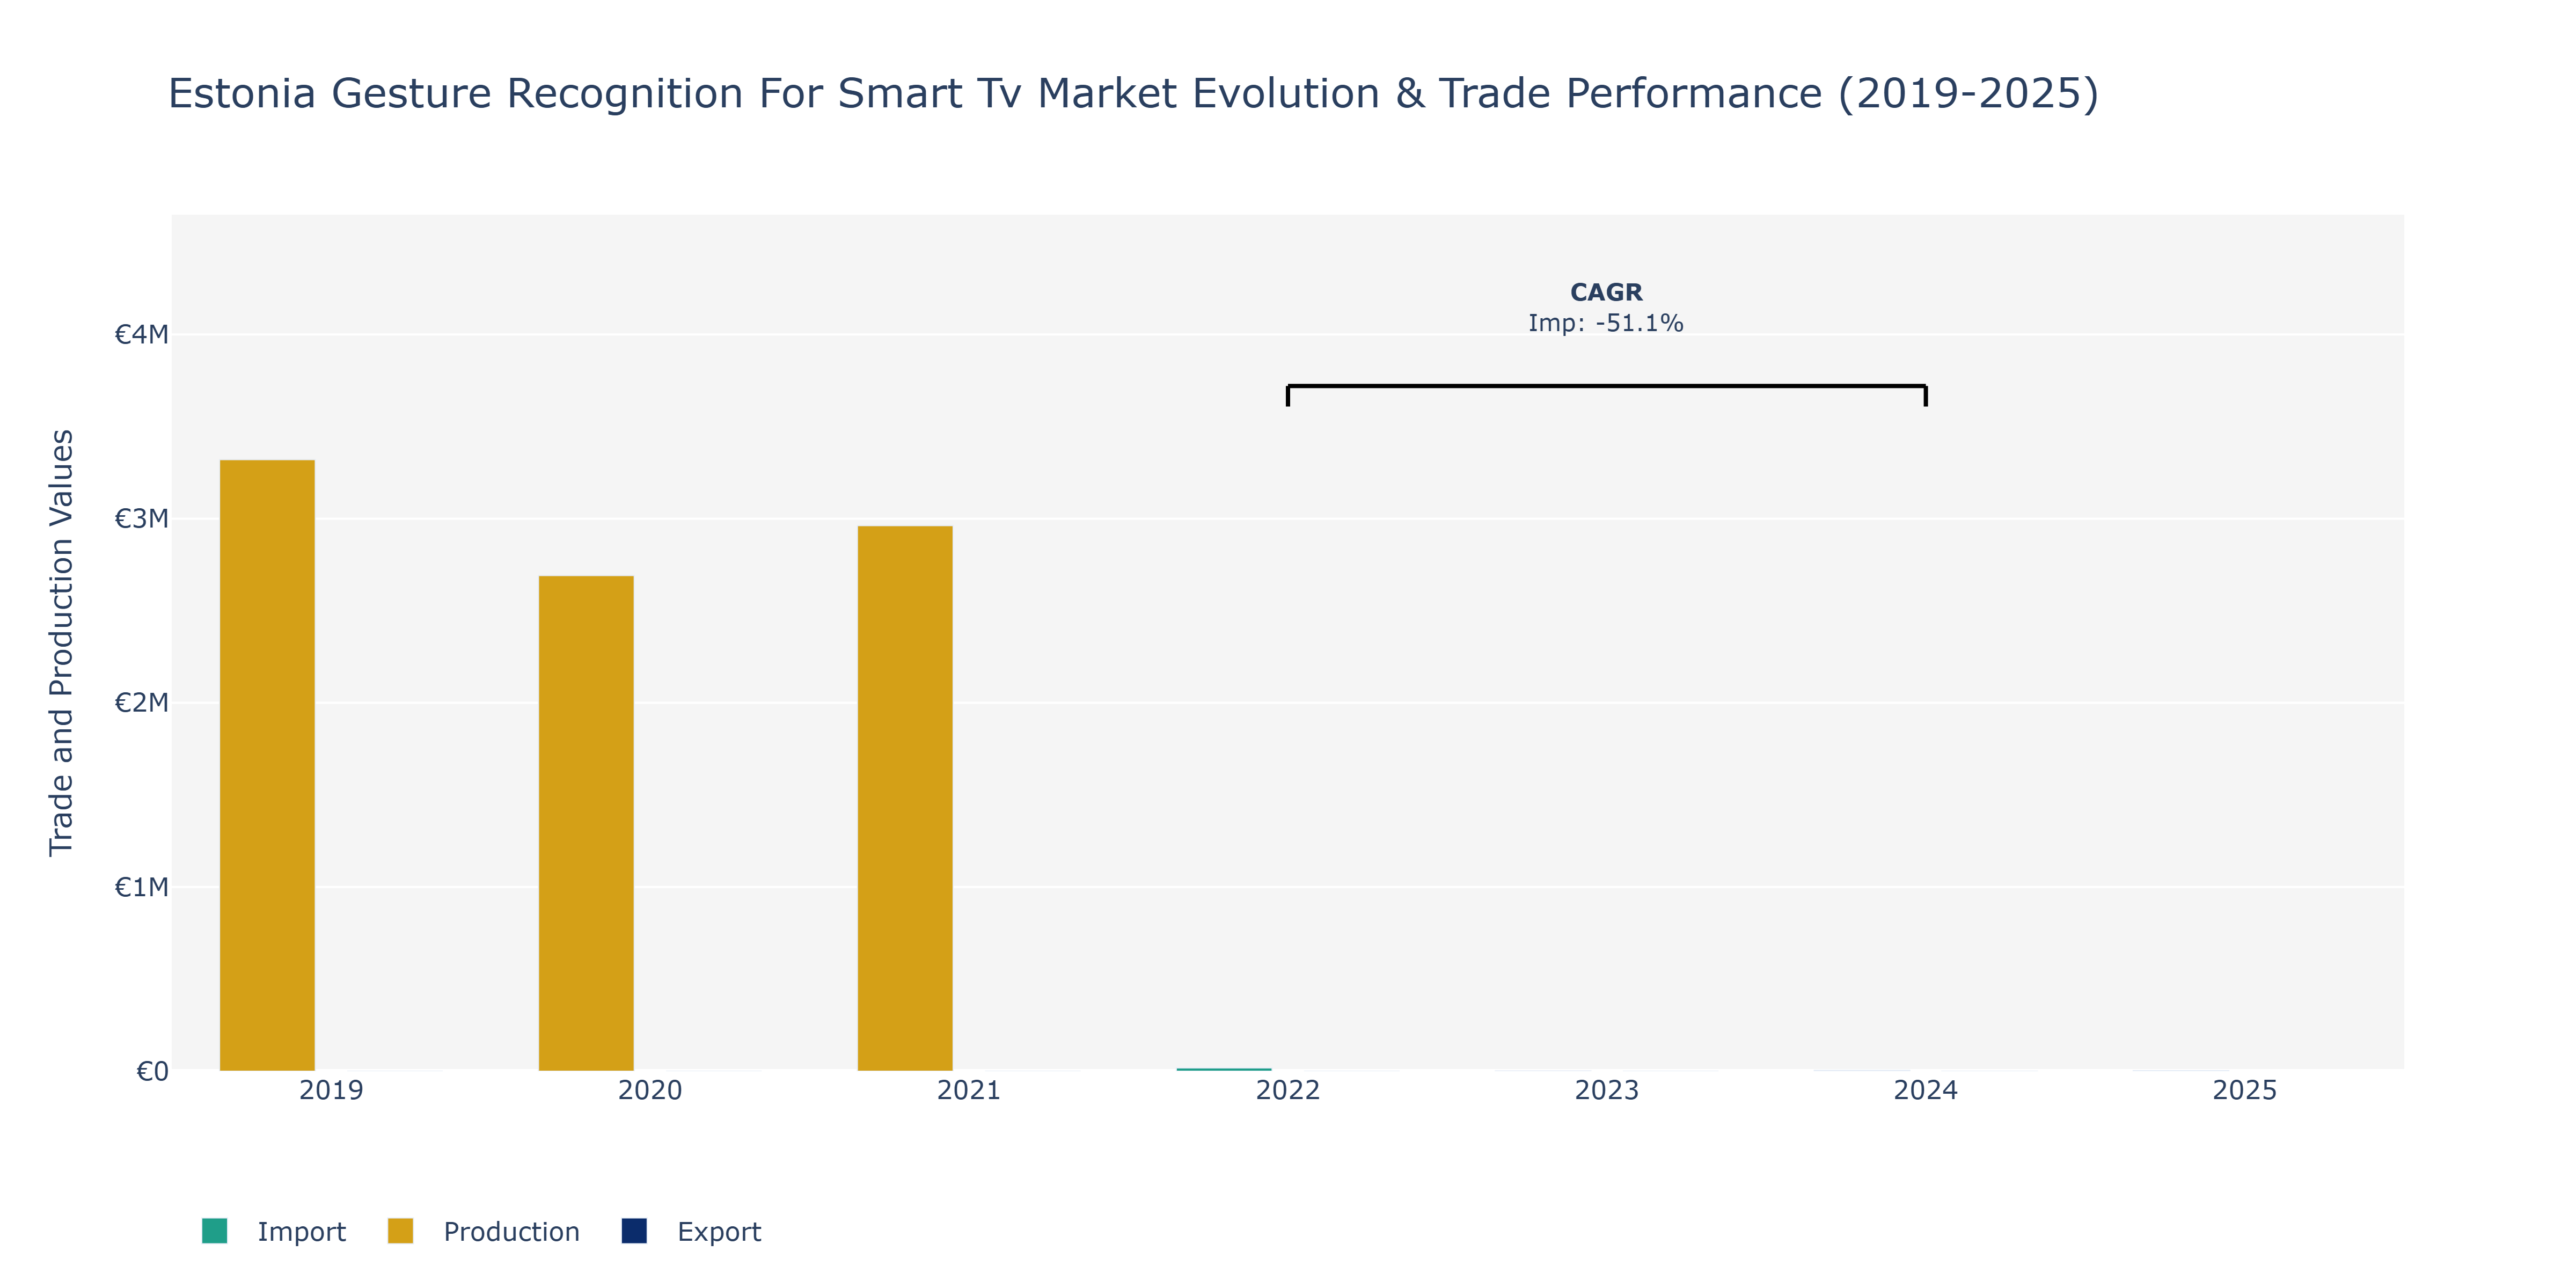
In the Estonia Gesture Recognition for Smart TV market, a noticeable fluctuation in trade dynamics is evident from the provided data. In 2019, imports were at €1.67 thousand while production stood at €3.32 billion. The following year, imports decreased to €1.62 thousand, aligning with a decline in production to €2.69 billion. However, in 2021, exports amounted to €11 million, showcasing a shift in the market's trade balance. Imports surged to €61.67 thousand, and production rebounded to €2.96 billion. The peak in exports occurred in 2024, reaching €137 million, with imports at €4.17 thousand. Interestingly, 2022 saw a substantial decrease in imports to €17.46 thousand, reflecting a unique trend possibly influenced by market conditions or regulatory changes. The subsequent years show a fluctuating pattern in imports, indicating potential shifts in supply chain dynamics or technological disruptions impacting the gesture recognition market for Smart TVs in Estonia.
Key Highlights of the Report:
- Estonia Gesture Recognition For Smart TV Market Outlook
- Market Size of Estonia Gesture Recognition For Smart TV Market, 2025
- Forecast of Estonia Gesture Recognition For Smart TV Market, 2032
- Historical Data and Forecast of Estonia Gesture Recognition For Smart TV Revenues & Volume for the Period 2022 - 2032F
- Estonia Gesture Recognition For Smart TV Market Trend Evolution
- Estonia Gesture Recognition For Smart TV Market Drivers and Challenges
- Estonia Gesture Recognition For Smart TV Price Trends
- Estonia Gesture Recognition For Smart TV Porter`s Five Forces
- Estonia Gesture Recognition For Smart TV Industry Life Cycle
- Historical Data and Forecast of Estonia Gesture Recognition For Smart TV Market Revenues & Volume By Product Type for the Period 2022 - 2032F
- Historical Data and Forecast of Estonia Gesture Recognition For Smart TV Market Revenues & Volume By Software (2D and 3D Image Sensor) for the Period 2022 - 2032F
- Historical Data and Forecast of Estonia Gesture Recognition For Smart TV Market Revenues & Volume By Hardware(Image Sensor for the Period 2022 - 2032F
- Historical Data and Forecast of Estonia Gesture Recognition For Smart TV Market Revenues & Volume By IR Proximity Sensor for the Period 2022 - 2032F
- Historical Data and Forecast of Estonia Gesture Recognition For Smart TV Market Revenues & Volume By IR Temperature Sensor) for the Period 2022 - 2032F
- Historical Data and Forecast of Estonia Gesture Recognition For Smart TV Market Revenues & Volume By Application for the Period 2022 - 2032F
- Historical Data and Forecast of Estonia Gesture Recognition For Smart TV Market Revenues & Volume By Commercial for the Period 2022 - 2032F
- Historical Data and Forecast of Estonia Gesture Recognition For Smart TV Market Revenues & Volume By Household for the Period 2022 - 2032F
- Estonia Gesture Recognition For Smart TV Import Export Trade Statistics
- Market Opportunity Assessment By Product Type
- Market Opportunity Assessment By Application
- Estonia Gesture Recognition For Smart TV Top Companies Market Share
- Estonia Gesture Recognition For Smart TV Competitive Benchmarking By Technical and Operational Parameters
- Estonia Gesture Recognition For Smart TV Company Profiles
- Estonia Gesture Recognition For Smart TV Key Strategic Recommendations
Frequently Asked Questions About the Market Study (FAQs):
6Wresearch actively monitors the Estonia Gesture Recognition For Smart TV Market and publishes its comprehensive annual report, highlighting emerging trends, growth drivers, revenue analysis, and forecast outlook. Our insights help businesses to make data-backed strategic decisions with ongoing market dynamics. Our analysts track relevent industries related to the Estonia Gesture Recognition For Smart TV Market, allowing our clients with actionable intelligence and reliable forecasts tailored to emerging regional needs.
Yes, we provide customisation as per your requirements. To learn more, feel free to contact us on sales@6wresearch.com
1 Executive Summary |
2 Introduction |
2.1 Key Highlights of the Report |
2.2 Report Description |
2.3 Market Scope & Segmentation |
2.4 Research Methodology |
2.5 Assumptions |
3 Estonia Gesture Recognition For Smart TV Market Overview |
3.1 Estonia Country Macro Economic Indicators |
3.2 Estonia Gesture Recognition For Smart TV Market Revenues & Volume, 2022 & 2032F |
3.3 Estonia Gesture Recognition For Smart TV Market - Industry Life Cycle |
3.4 Estonia Gesture Recognition For Smart TV Market - Porter's Five Forces |
3.5 Estonia Gesture Recognition For Smart TV Market Revenues & Volume Share, By Product Type, 2022 & 2032F |
3.6 Estonia Gesture Recognition For Smart TV Market Revenues & Volume Share, By Application, 2022 & 2032F |
4 Estonia Gesture Recognition For Smart TV Market Dynamics |
4.1 Impact Analysis |
4.2 Market Drivers |
4.2.1 Increasing demand for smart TVs with advanced features |
4.2.2 Growing trend towards touchless and intuitive user interfaces |
4.2.3 Rising adoption of smart home technology in Estonia |
4.3 Market Restraints |
4.3.1 High initial cost of implementing gesture recognition technology |
4.3.2 Limited awareness and understanding of gesture recognition technology among consumers |
4.3.3 Technical challenges related to accuracy and reliability of gesture recognition systems |
5 Estonia Gesture Recognition For Smart TV Market Trends |
6 Estonia Gesture Recognition For Smart TV Market Segmentations |
6.1 Estonia Gesture Recognition For Smart TV Market, By Product Type |
6.1.1 Overview and Analysis |
6.1.2 Estonia Gesture Recognition For Smart TV Market Revenues & Volume, By Software (2D and 3D Image Sensor), 2022 - 2032F |
6.1.3 Estonia Gesture Recognition For Smart TV Market Revenues & Volume, By Hardware(Image Sensor, 2022 - 2032F |
6.1.4 Estonia Gesture Recognition For Smart TV Market Revenues & Volume, By IR Proximity Sensor, 2022 - 2032F |
6.1.5 Estonia Gesture Recognition For Smart TV Market Revenues & Volume, By IR Temperature Sensor), 2022 - 2032F |
6.2 Estonia Gesture Recognition For Smart TV Market, By Application |
6.2.1 Overview and Analysis |
6.2.2 Estonia Gesture Recognition For Smart TV Market Revenues & Volume, By Commercial, 2022 - 2032F |
6.2.3 Estonia Gesture Recognition For Smart TV Market Revenues & Volume, By Household, 2022 - 2032F |
7 Estonia Gesture Recognition For Smart TV Market Import-Export Trade Statistics |
7.1 Estonia Gesture Recognition For Smart TV Market Export to Major Countries |
7.2 Estonia Gesture Recognition For Smart TV Market Imports from Major Countries |
8 Estonia Gesture Recognition For Smart TV Market Key Performance Indicators |
8.1 Customer engagement metrics such as average session duration or frequency of interactions with gesture recognition features |
8.2 Adoption rate of gesture recognition technology among smart TV manufacturers in Estonia |
8.3 User satisfaction scores related to the usability and performance of gesture recognition features |
9 Estonia Gesture Recognition For Smart TV Market - Opportunity Assessment |
9.1 Estonia Gesture Recognition For Smart TV Market Opportunity Assessment, By Product Type, 2022 & 2032F |
9.2 Estonia Gesture Recognition For Smart TV Market Opportunity Assessment, By Application, 2022 & 2032F |
10 Estonia Gesture Recognition For Smart TV Market - Competitive Landscape |
10.1 Estonia Gesture Recognition For Smart TV Market Revenue Share, By Companies, 2025 |
10.2 Estonia Gesture Recognition For Smart TV Market Competitive Benchmarking, By Operating and Technical Parameters |
11 Company Profiles |
12 Recommendations | 13 Disclaimer |
Global Go To Market Strategy - 2030
Export potential enables firms to identify high-growth global markets with greater confidence by combining advanced trade intelligence with a structured quantitative methodology. The framework analyzes emerging demand trends and country-level import patterns while integrating macroeconomic and trade datasets such as GDP and population forecasts, bilateral import–export flows, tariff structures, elasticity differentials between developed and developing economies, geographic distance, and import demand projections. Using weighted trade values from 2020–2024 as the base period to project country-to-country export potential for 2030, these inputs are operationalized through calculated drivers such as gravity model parameters, tariff impact factors, and projected GDP per-capita growth. Through an analysis of hidden potentials, demand hotspots, and market conditions that are most favorable to success, this method enables firms to focus on target countries, maximize returns, and global expansion with data, backed by accuracy.
By factoring in the projected importer demand gap that is currently unmet and could be potential opportunity, it identifies the potential for the Exporter (Country) among 190 countries, against the general trade analysis, which identifies the biggest importer or exporter.
To discover high-growth global markets and optimize your business strategy:
Click Here
Pricing
- Single User License$ 1,995
- Department License$ 2,400
- Site License$ 3,120
- Global License$ 3,795

Leadership Perspectives from Industry Events
Search
Thought Leadership and Analyst Meet


Our Clients
6WResearch In News
- India Export Attractiveness Tracker 2026
- India Air Conditioner Market Set for Strong Rebound in 2026 After Weather-Led Correction and GST-Driven Recovery: 6Wresearch
- ADAS in India: How Automatic Emergency Braking, Blind Spot Detection & Driver Monitoring are Transforming Road Safety
- Doha a strategic location for EV manufacturing hub: IPA Qatar
- Demand for luxury TVs surging in the GCC, says Samsung
- Empowering Growth: The Thriving Journey of Bangladesh’s Cable Industry
Latest Reports
- Nicaragua RPG Gaming Market (2026-2032)
- New Zealand RPG Gaming Market (2026-2032)
- Netherlands RPG Gaming Market (2026-2032)
- Nauru RPG Gaming Market (2026-2032)
- Namibia RPG Gaming Market (2026-2032)
- Mozambique RPG Gaming Market (2026-2032)
- Montenegro RPG Gaming Market (2026-2032)
- Mongolia RPG Gaming Market (2026-2032)
- Monaco RPG Gaming Market (2026-2032)
- Micronesia RPG Gaming Market (2026-2032)
Industry Events and Analyst Meet

EV India Expo 2026

HIMTEX 2026

India Refining Summit 2026

India EV Show 2026

EV tech India Expo 2026
Whitepaper
- Middle East & Africa Commercial Security Market Click here to view more.
- Middle East & Africa Fire Safety Systems & Equipment Market Click here to view more.
- GCC Drone Market Click here to view more.
- Middle East Lighting Fixture Market Click here to view more.
- GCC Physical & Perimeter Security Market Click here to view more.