Estonia Hams Market (2026-2032) | Segmentation, Forecast, Value, Trends, Industry, Size, Growth, Companies, Share, Outlook, Analysis & Revenue
Market Forecast By Type (Air Dried Cured Hams, Smoked Hams), By Applications (Supermarkets and Hypermarkets, Independent Retailers, Convenience Stores, Specialist Retailers, Online Retailers) And Competitive Landscape
| Product Code: ETC5827807 | Publication Date: Nov 2023 | Updated Date: Apr 2026 | Product Type: Market Research Report | |
| Publisher: 6Wresearch | Author: Ravi Bhandari | No. of Pages: 60 | No. of Figures: 30 | No. of Tables: 5 |
Estonia Hams Market Size (2020-2030)
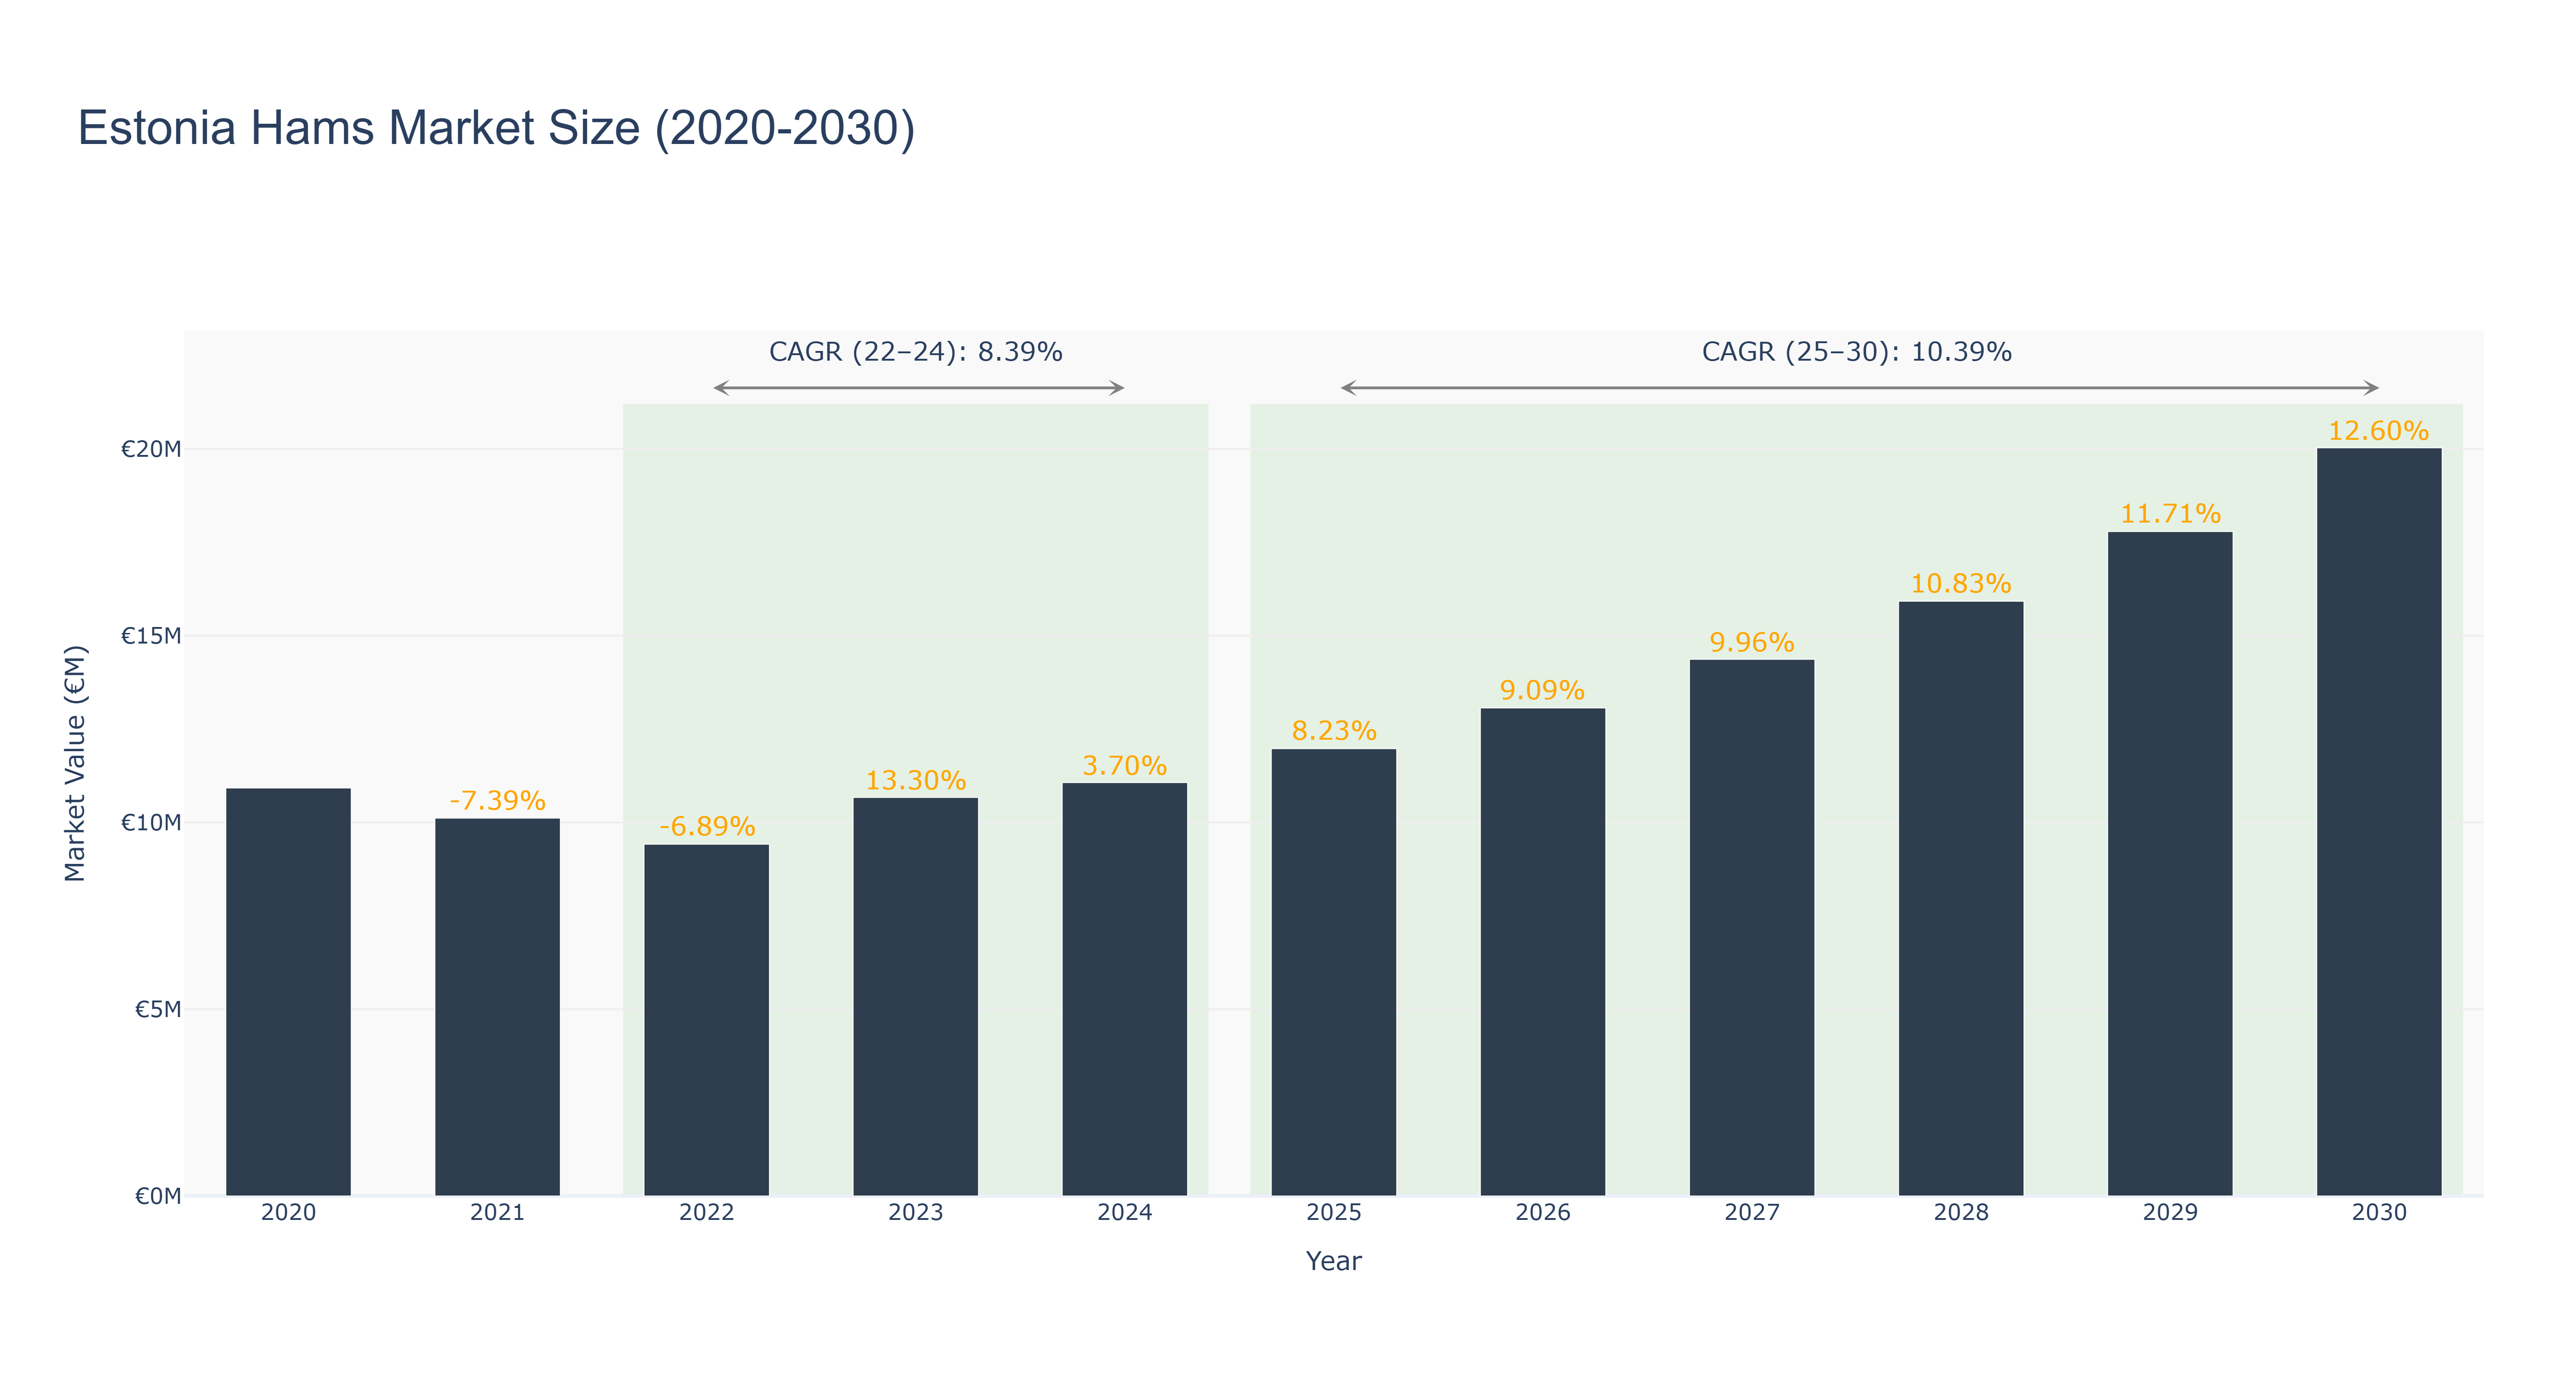
Estonia Hams Market has shown a fluctuating trend in recent years. The peak market size of €20.03 million is forecasted for 2030, with a steady growth trajectory from 2025 to 2030, driven by a CAGR of 10.39%. The market experienced a decline from 2020 to 2024, with the lowest point at €9.42 million in 2022, but rebounded strongly thereafter. The CAGR for the period 2022-24 was 8.39%, indicating a recovery phase. Industry drivers such as increasing consumer demand for premium quality hams and innovative product offerings have contributed to this growth. Looking ahead, Estonia Hams Market is set to witness new product launches leveraging advanced processing technologies to meet evolving consumer preferences, ensuring sustained growth and market competitiveness in the coming years.
Estonia Hams Market: Production & Trade Performance (2019-2025)
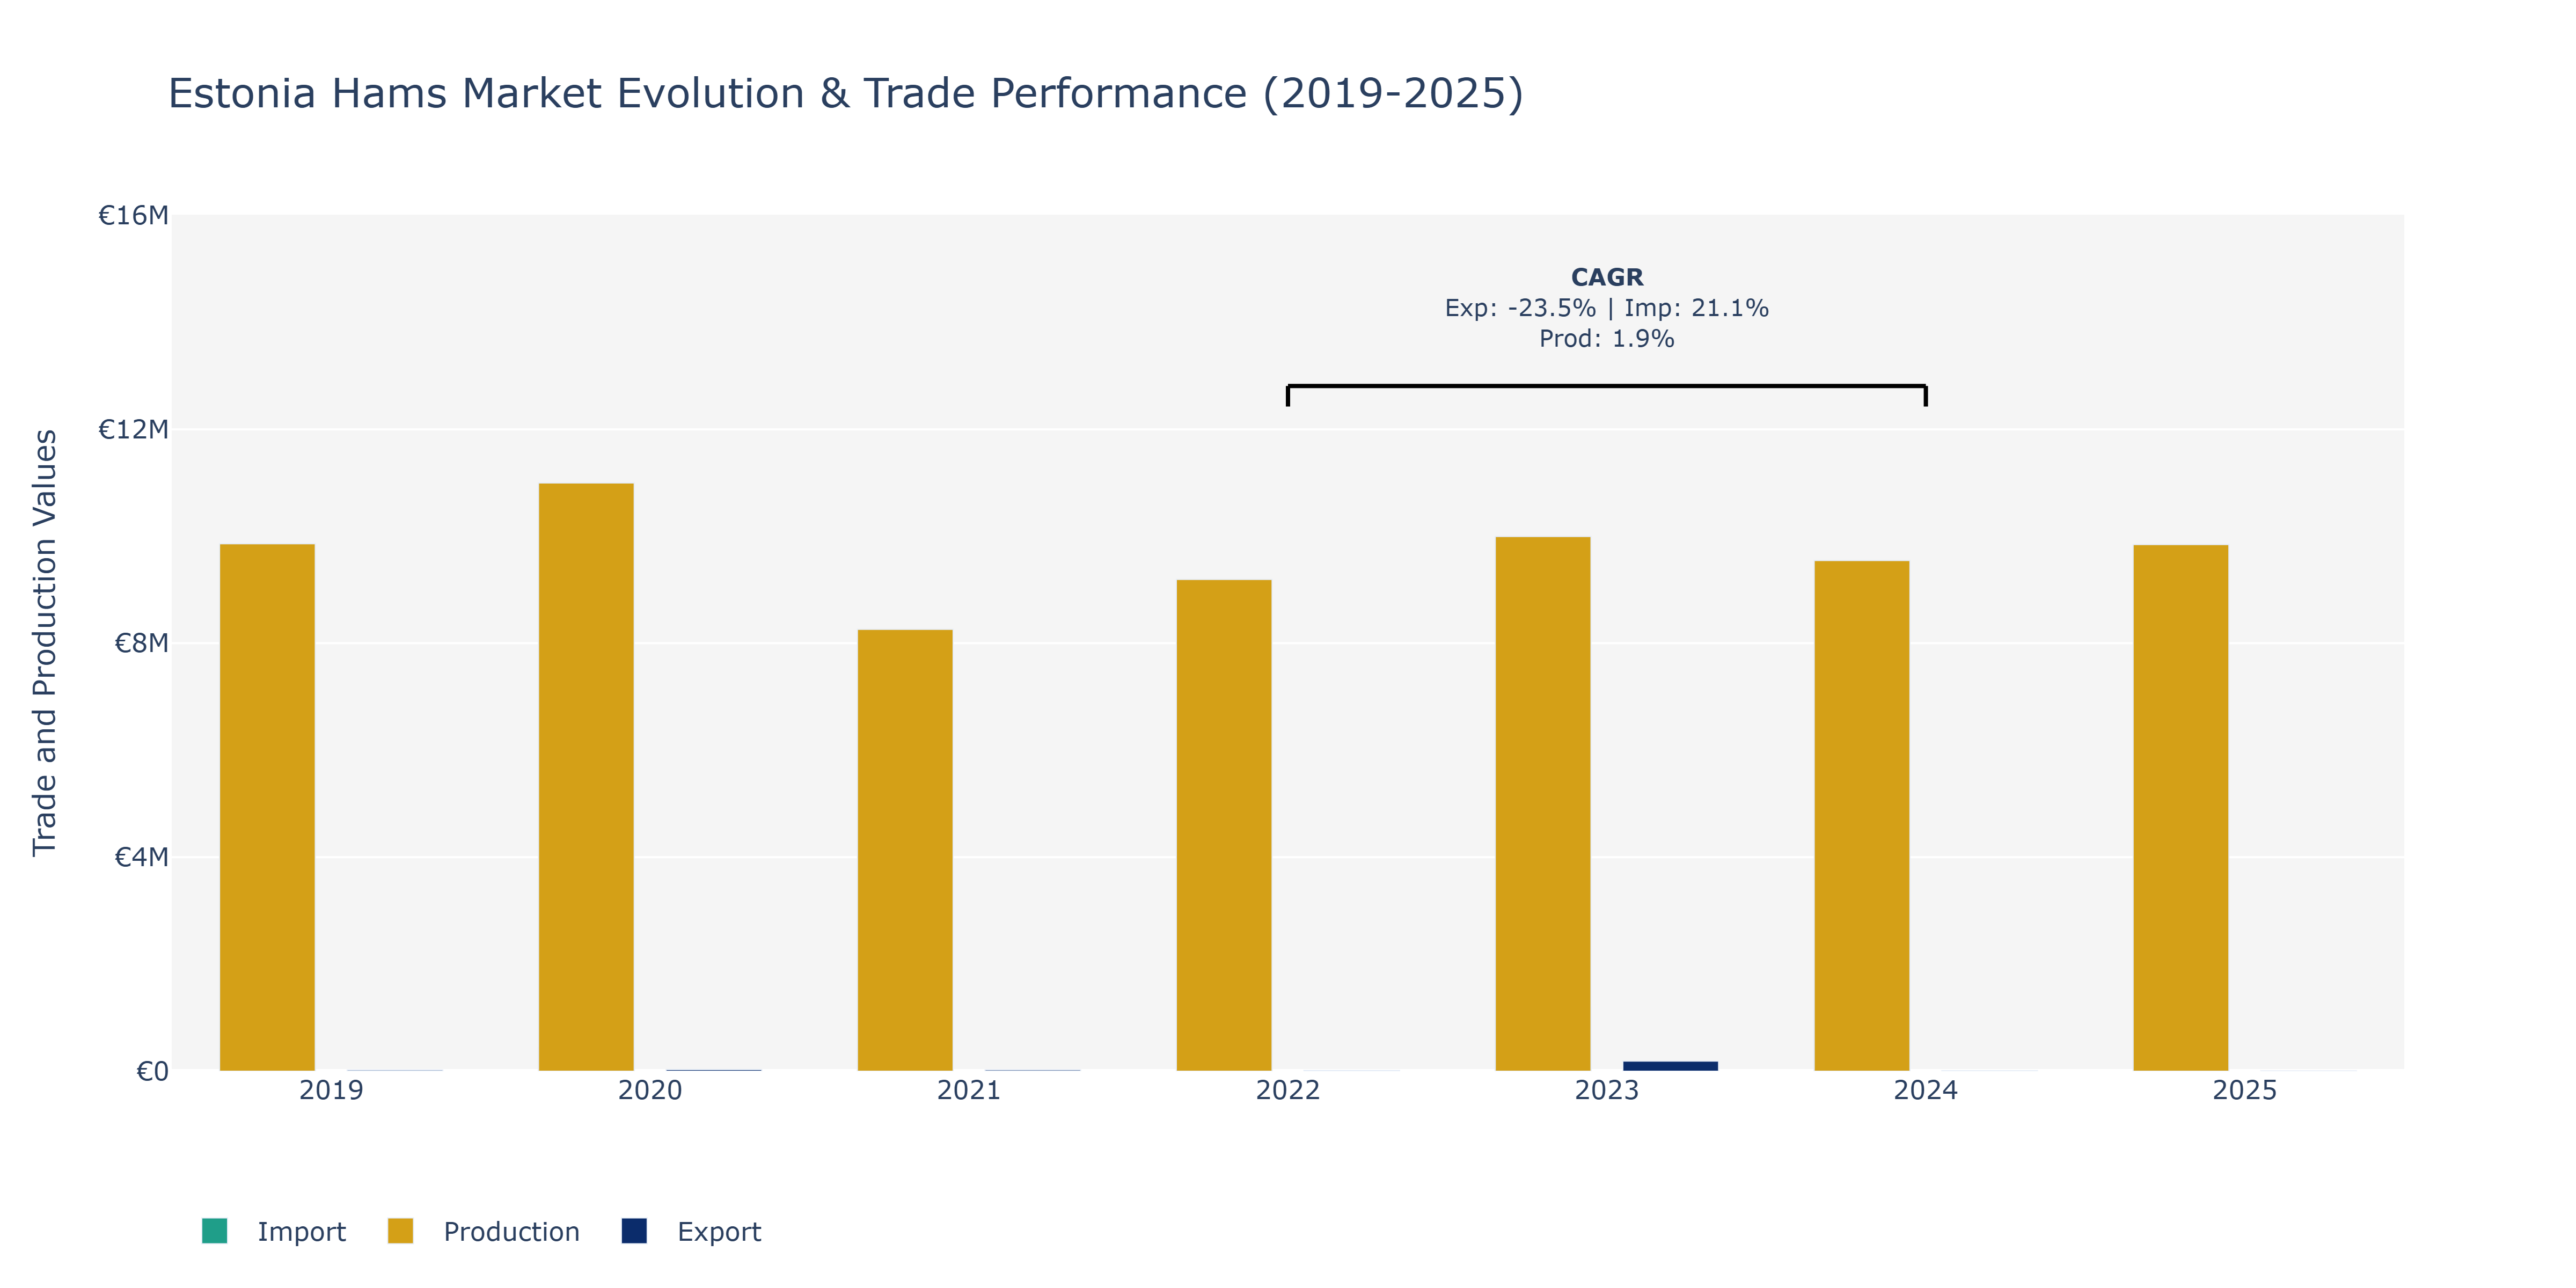
In the Estonia Hams Market, exports showed fluctuations over the years, with a peak in 2023 at €187.12 thousand, followed by a decline to €7.03 thousand in 2024. This significant drop may be attributed to changing consumer preferences, trade regulations, or global market conditions affecting demand. Imports, on the other hand, demonstrated a steady increase from €428.78 thousand in 2019 to €1.33 million in 2025, indicating a growing reliance on foreign hams. Production value fluctuated, reaching their highest point in 2020 at €10.99 billion and experiencing a slight decrease by 2021 to €8.26 billion. Possible factors influencing these shifts could include supply chain disruptions, production efficiency improvements, or shifts in domestic consumption patterns. To maintain competitiveness in the global ham market, Estonia may need to focus on enhancing production capabilities and analyzing consumer preferences to align with market demands.
Key Highlights of the Report:
- Estonia Hams Market Outlook
- Market Size of Estonia Hams Market, 2025
- Forecast of Estonia Hams Market, 2032
- Historical Data and Forecast of Estonia Hams Revenues & Volume for the Period 2022 - 2032F
- Estonia Hams Market Trend Evolution
- Estonia Hams Market Drivers and Challenges
- Estonia Hams Price Trends
- Estonia Hams Porter`s Five Forces
- Estonia Hams Industry Life Cycle
- Historical Data and Forecast of Estonia Hams Market Revenues & Volume By Type for the Period 2022 - 2032F
- Historical Data and Forecast of Estonia Hams Market Revenues & Volume By Air Dried Cured Hams for the Period 2022 - 2032F
- Historical Data and Forecast of Estonia Hams Market Revenues & Volume By Smoked Hams for the Period 2022 - 2032F
- Historical Data and Forecast of Estonia Hams Market Revenues & Volume By Applications for the Period 2022 - 2032F
- Historical Data and Forecast of Estonia Hams Market Revenues & Volume By Supermarkets and Hypermarkets for the Period 2022 - 2032F
- Historical Data and Forecast of Estonia Hams Market Revenues & Volume By Independent Retailers for the Period 2022 - 2032F
- Historical Data and Forecast of Estonia Hams Market Revenues & Volume By Convenience Stores for the Period 2022 - 2032F
- Historical Data and Forecast of Estonia Hams Market Revenues & Volume By Specialist Retailers for the Period 2022 - 2032F
- Historical Data and Forecast of Estonia Hams Market Revenues & Volume By Online Retailers for the Period 2022 - 2032F
- Estonia Hams Import Export Trade Statistics
- Market Opportunity Assessment By Type
- Market Opportunity Assessment By Applications
- Estonia Hams Top Companies Market Share
- Estonia Hams Competitive Benchmarking By Technical and Operational Parameters
- Estonia Hams Company Profiles
- Estonia Hams Key Strategic Recommendations
Frequently Asked Questions About the Market Study (FAQs):
6Wresearch actively monitors the Estonia Hams Market and publishes its comprehensive annual report, highlighting emerging trends, growth drivers, revenue analysis, and forecast outlook. Our insights help businesses to make data-backed strategic decisions with ongoing market dynamics. Our analysts track relevent industries related to the Estonia Hams Market, allowing our clients with actionable intelligence and reliable forecasts tailored to emerging regional needs.
Yes, we provide customisation as per your requirements. To learn more, feel free to contact us on sales@6wresearch.com
1 Executive Summary |
2 Introduction |
2.1 Key Highlights of the Report |
2.2 Report Description |
2.3 Market Scope & Segmentation |
2.4 Research Methodology |
2.5 Assumptions |
3 Estonia Hams Market Overview |
3.1 Estonia Country Macro Economic Indicators |
3.2 Estonia Hams Market Revenues & Volume, 2022 & 2032F |
3.3 Estonia Hams Market - Industry Life Cycle |
3.4 Estonia Hams Market - Porter's Five Forces |
3.5 Estonia Hams Market Revenues & Volume Share, By Type, 2022 & 2032F |
3.6 Estonia Hams Market Revenues & Volume Share, By Applications, 2022 & 2032F |
4 Estonia Hams Market Dynamics |
4.1 Impact Analysis |
4.2 Market Drivers |
4.2.1 Increasing consumer awareness about the quality and health benefits of locally produced hams in Estonia |
4.2.2 Growing trend towards organic and premium meat products in the Estonian market |
4.2.3 Favorable government regulations supporting the local meat industry |
4.3 Market Restraints |
4.3.1 Competition from imported hams from other countries impacting the market share of Estonian hams |
4.3.2 Price fluctuations of raw materials and production costs affecting the pricing of hams in Estonia |
5 Estonia Hams Market Trends |
6 Estonia Hams Market Segmentations |
6.1 Estonia Hams Market, By Type |
6.1.1 Overview and Analysis |
6.1.2 Estonia Hams Market Revenues & Volume, By Air Dried Cured Hams, 2022 - 2032F |
6.1.3 Estonia Hams Market Revenues & Volume, By Smoked Hams, 2022 - 2032F |
6.2 Estonia Hams Market, By Applications |
6.2.1 Overview and Analysis |
6.2.2 Estonia Hams Market Revenues & Volume, By Supermarkets and Hypermarkets, 2022 - 2032F |
6.2.3 Estonia Hams Market Revenues & Volume, By Independent Retailers, 2022 - 2032F |
6.2.4 Estonia Hams Market Revenues & Volume, By Convenience Stores, 2022 - 2032F |
6.2.5 Estonia Hams Market Revenues & Volume, By Specialist Retailers, 2022 - 2032F |
6.2.6 Estonia Hams Market Revenues & Volume, By Online Retailers, 2022 - 2032F |
7 Estonia Hams Market Import-Export Trade Statistics |
7.1 Estonia Hams Market Export to Major Countries |
7.2 Estonia Hams Market Imports from Major Countries |
8 Estonia Hams Market Key Performance Indicators |
8.1 Percentage of consumers preferring locally produced hams over imported ones |
8.2 Number of new product launches in the organic and premium ham segment in Estonia |
8.3 Compliance rate with government regulations and certifications in the Estonian ham industry |
9 Estonia Hams Market - Opportunity Assessment |
9.1 Estonia Hams Market Opportunity Assessment, By Type, 2022 & 2032F |
9.2 Estonia Hams Market Opportunity Assessment, By Applications, 2022 & 2032F |
10 Estonia Hams Market - Competitive Landscape |
10.1 Estonia Hams Market Revenue Share, By Companies, 2025 |
10.2 Estonia Hams Market Competitive Benchmarking, By Operating and Technical Parameters |
11 Company Profiles |
12 Recommendations | 13 Disclaimer |
Global Go To Market Strategy - 2030
Export potential enables firms to identify high-growth global markets with greater confidence by combining advanced trade intelligence with a structured quantitative methodology. The framework analyzes emerging demand trends and country-level import patterns while integrating macroeconomic and trade datasets such as GDP and population forecasts, bilateral import–export flows, tariff structures, elasticity differentials between developed and developing economies, geographic distance, and import demand projections. Using weighted trade values from 2020–2024 as the base period to project country-to-country export potential for 2030, these inputs are operationalized through calculated drivers such as gravity model parameters, tariff impact factors, and projected GDP per-capita growth. Through an analysis of hidden potentials, demand hotspots, and market conditions that are most favorable to success, this method enables firms to focus on target countries, maximize returns, and global expansion with data, backed by accuracy.
By factoring in the projected importer demand gap that is currently unmet and could be potential opportunity, it identifies the potential for the Exporter (Country) among 190 countries, against the general trade analysis, which identifies the biggest importer or exporter.
To discover high-growth global markets and optimize your business strategy:
Click Here
Pricing
- Single User License$ 1,995
- Department License$ 2,400
- Site License$ 3,120
- Global License$ 3,795

Leadership Perspectives from Industry Events
Search
Thought Leadership and Analyst Meet


Our Clients
6WResearch In News
- India Air Conditioner Market Set for Strong Rebound in 2026 After Weather-Led Correction and GST-Driven Recovery: 6Wresearch
- ADAS in India: How Automatic Emergency Braking, Blind Spot Detection & Driver Monitoring are Transforming Road Safety
- Doha a strategic location for EV manufacturing hub: IPA Qatar
- Demand for luxury TVs surging in the GCC, says Samsung
- Empowering Growth: The Thriving Journey of Bangladesh’s Cable Industry
- Demand for luxury TVs surging in the GCC, says Samsung
Latest Reports
- Poland Fire Protection Systems Market (2026-2032)
- Cape Verde Portable Hand-Thrown Extinguisher Market (2026-2032)
- Canada Portable Hand-Thrown Extinguisher Market (2026-2032)
- Cameroon Portable Hand-Thrown Extinguisher Market (2026-2032)
- Burundi Portable Hand-Thrown Extinguisher Market (2026-2032)
- Burkina Faso Portable Hand-Thrown Extinguisher Market (2026-2032)
- Bulgaria Portable Hand-Thrown Extinguisher Market (2026-2032)
- Brunei Portable Hand-Thrown Extinguisher Market (2026-2032)
- Botswana Portable Hand-Thrown Extinguisher Market (2026-2032)
- Bosnia and Herzegovina Portable Hand-Thrown Extinguisher Market (2026-2032)
Industry Events and Analyst Meet

HIMTEX 2026

India Refining Summit 2026

India EV Show 2026

EV tech India Expo 2026

Auto Tech Asia 2026
Whitepaper
- Middle East & Africa Commercial Security Market Click here to view more.
- Middle East & Africa Fire Safety Systems & Equipment Market Click here to view more.
- GCC Drone Market Click here to view more.
- Middle East Lighting Fixture Market Click here to view more.
- GCC Physical & Perimeter Security Market Click here to view more.