Estonia Liqueurs Market (2026-2032) | Share, Industry, Revenue, Forecast, Trends, Growth, Value, Companies, Segmentation, Outlook, Size & Analysis
Market Forecast By Type (Neutrals/Bitters, Creams, Fruit Flavored, Others), By Distribution Channel (Convenience Stores, On Premises, Retailers, Supermarkets), By Packaging (Glass, PET Bottle, Metal Can, Others) And Competitive Landscape
| Product Code: ETC5523769 | Publication Date: Nov 2023 | Updated Date: Apr 2026 | Product Type: Market Research Report | |
| Publisher: 6Wresearch | Author: Ravi Bhandari | No. of Pages: 60 | No. of Figures: 30 | No. of Tables: 5 |
Estonia Liqueurs Market Size (2020-2030)
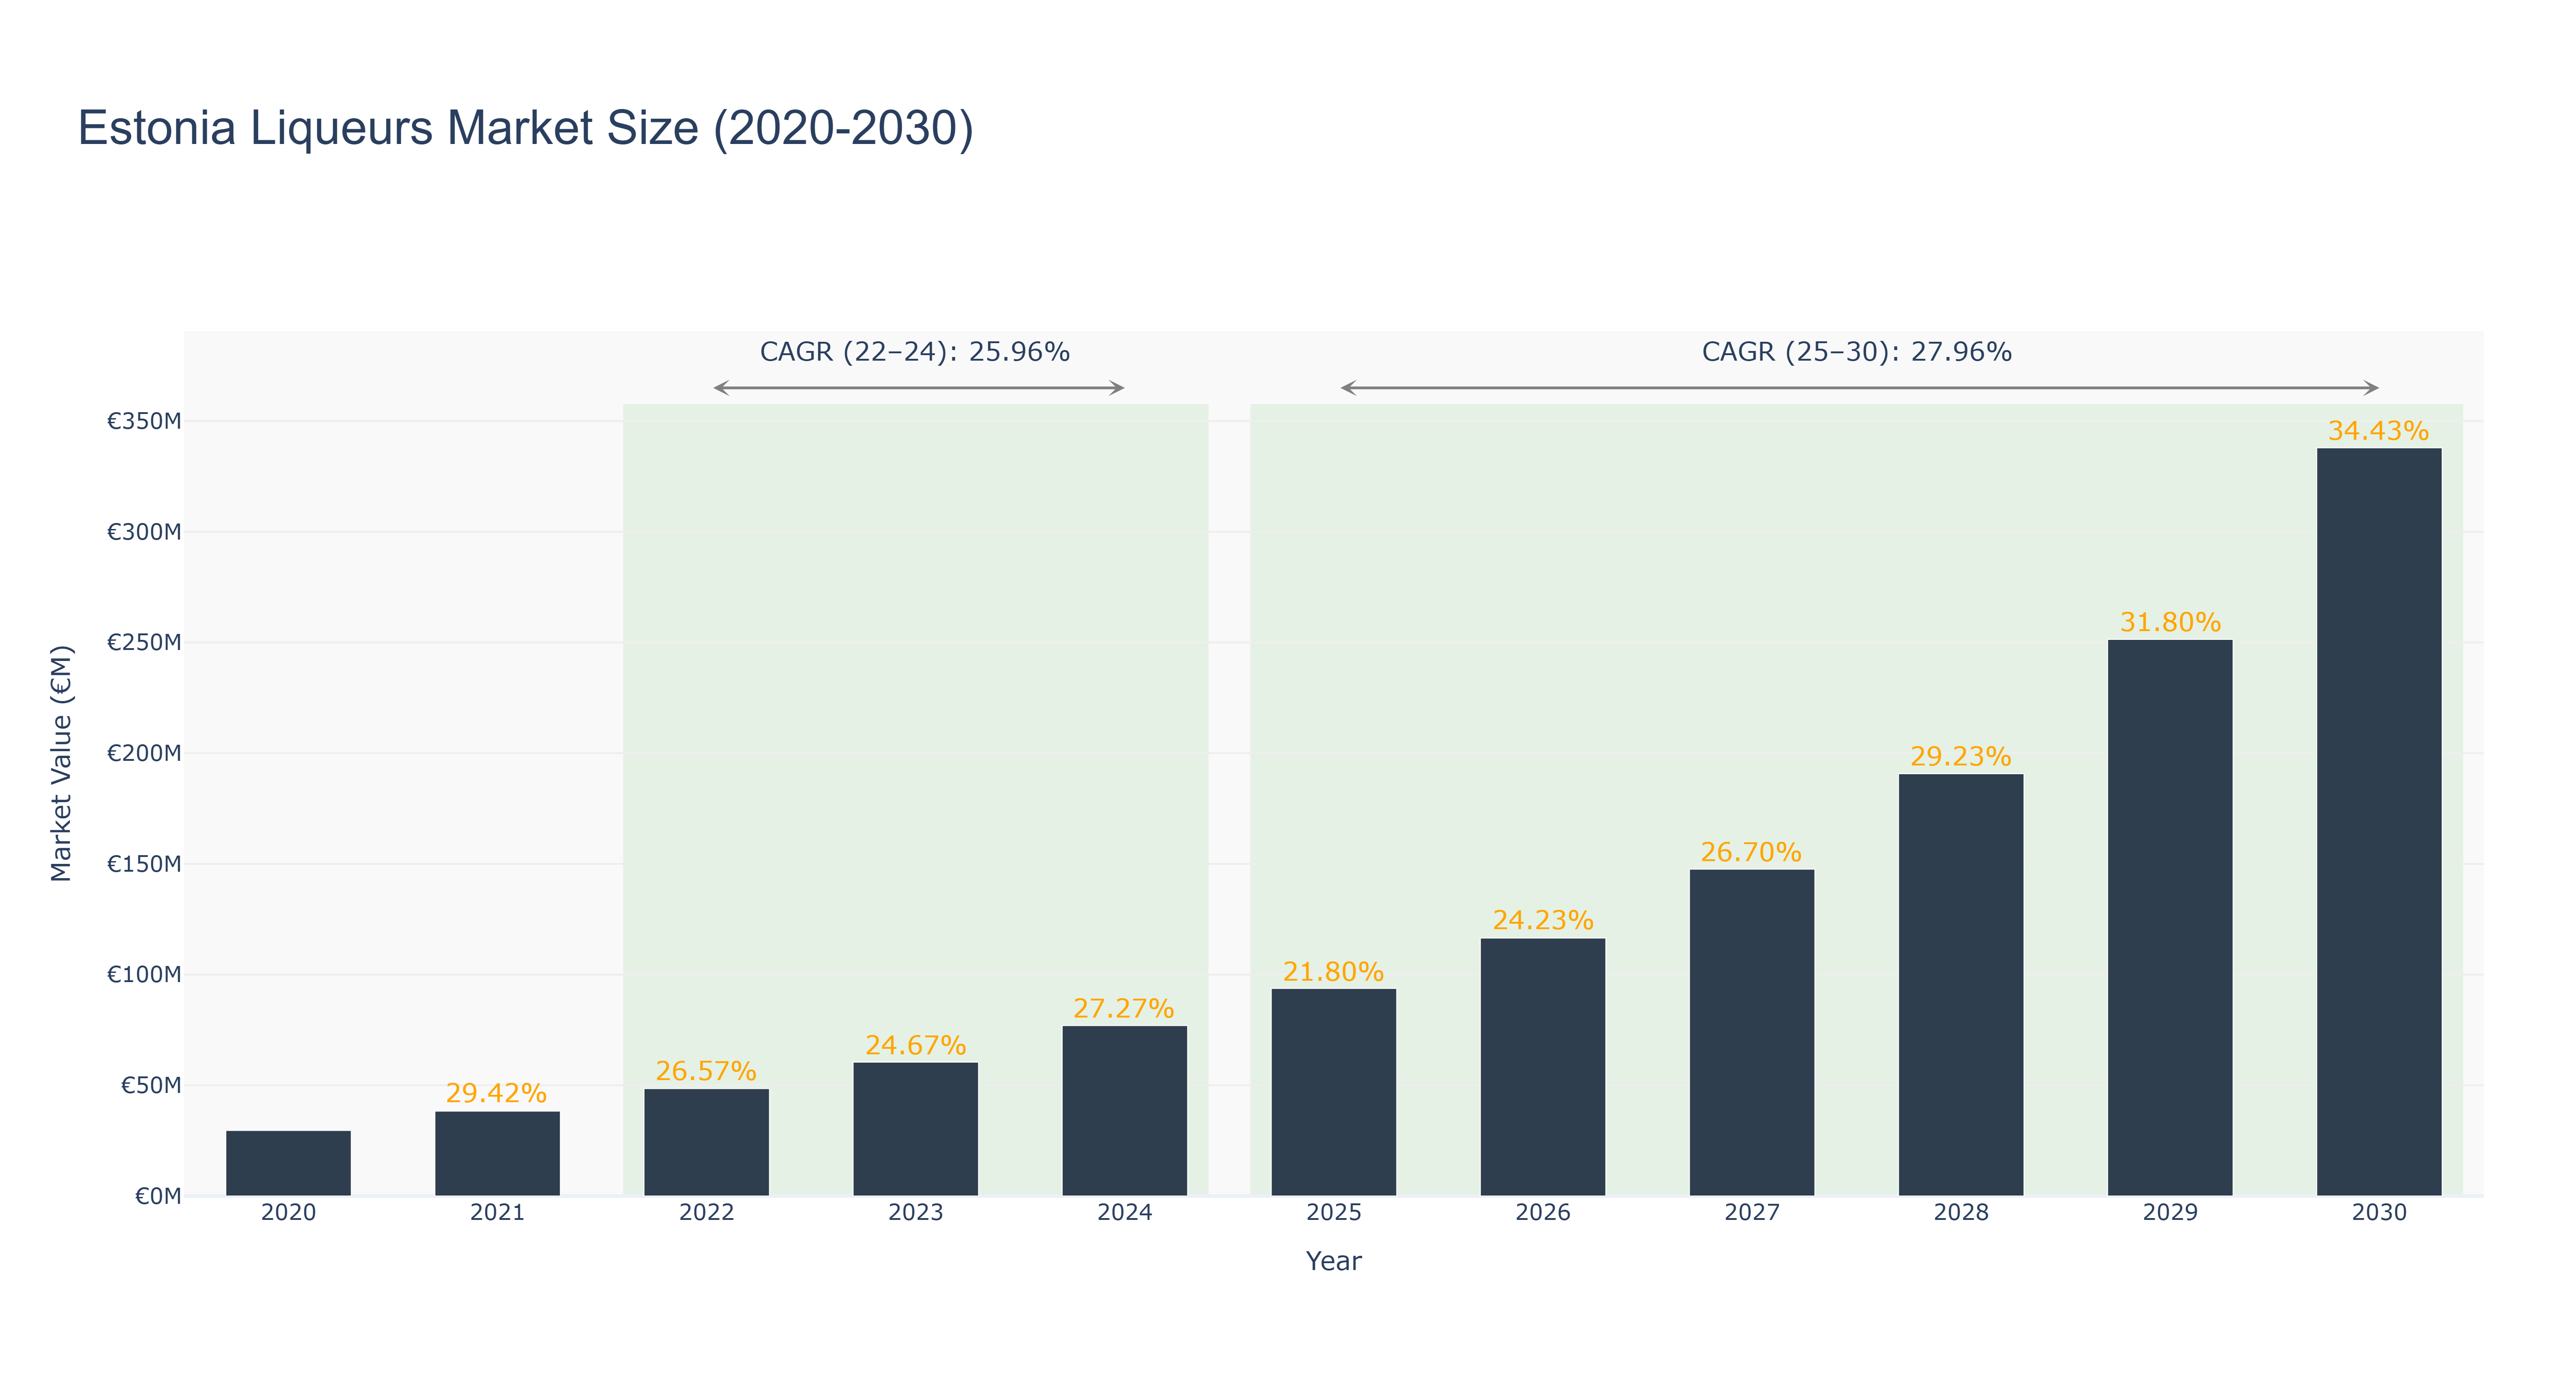
Estonia Liqueurs Market has shown a steady growth trajectory over the years. The peak market size was in 2030 at €337.90 million, with a Compound Annual Growth Rate (CAGR) of 34.43% from 2020 to 2030. The actual market size increased from €29.62 million in 2020 to €76.97 million in 2024, driven by increasing consumer demand and expanding product offerings. The forecasted market size is expected to reach €251.36 million by 2029, with a CAGR of 27.96% from 2025 to 2030. The market's growth can be attributed to evolving consumer preferences towards premium and craft liqueurs, as well as innovative marketing strategies by key players. In the near future, Estonia's liqueurs market is expected to witness new product launches focusing on organic and sustainable ingredients to cater to the growing health-conscious consumer base.
Estonia Liqueurs Market: Production & Trade Performance (2019-2025)
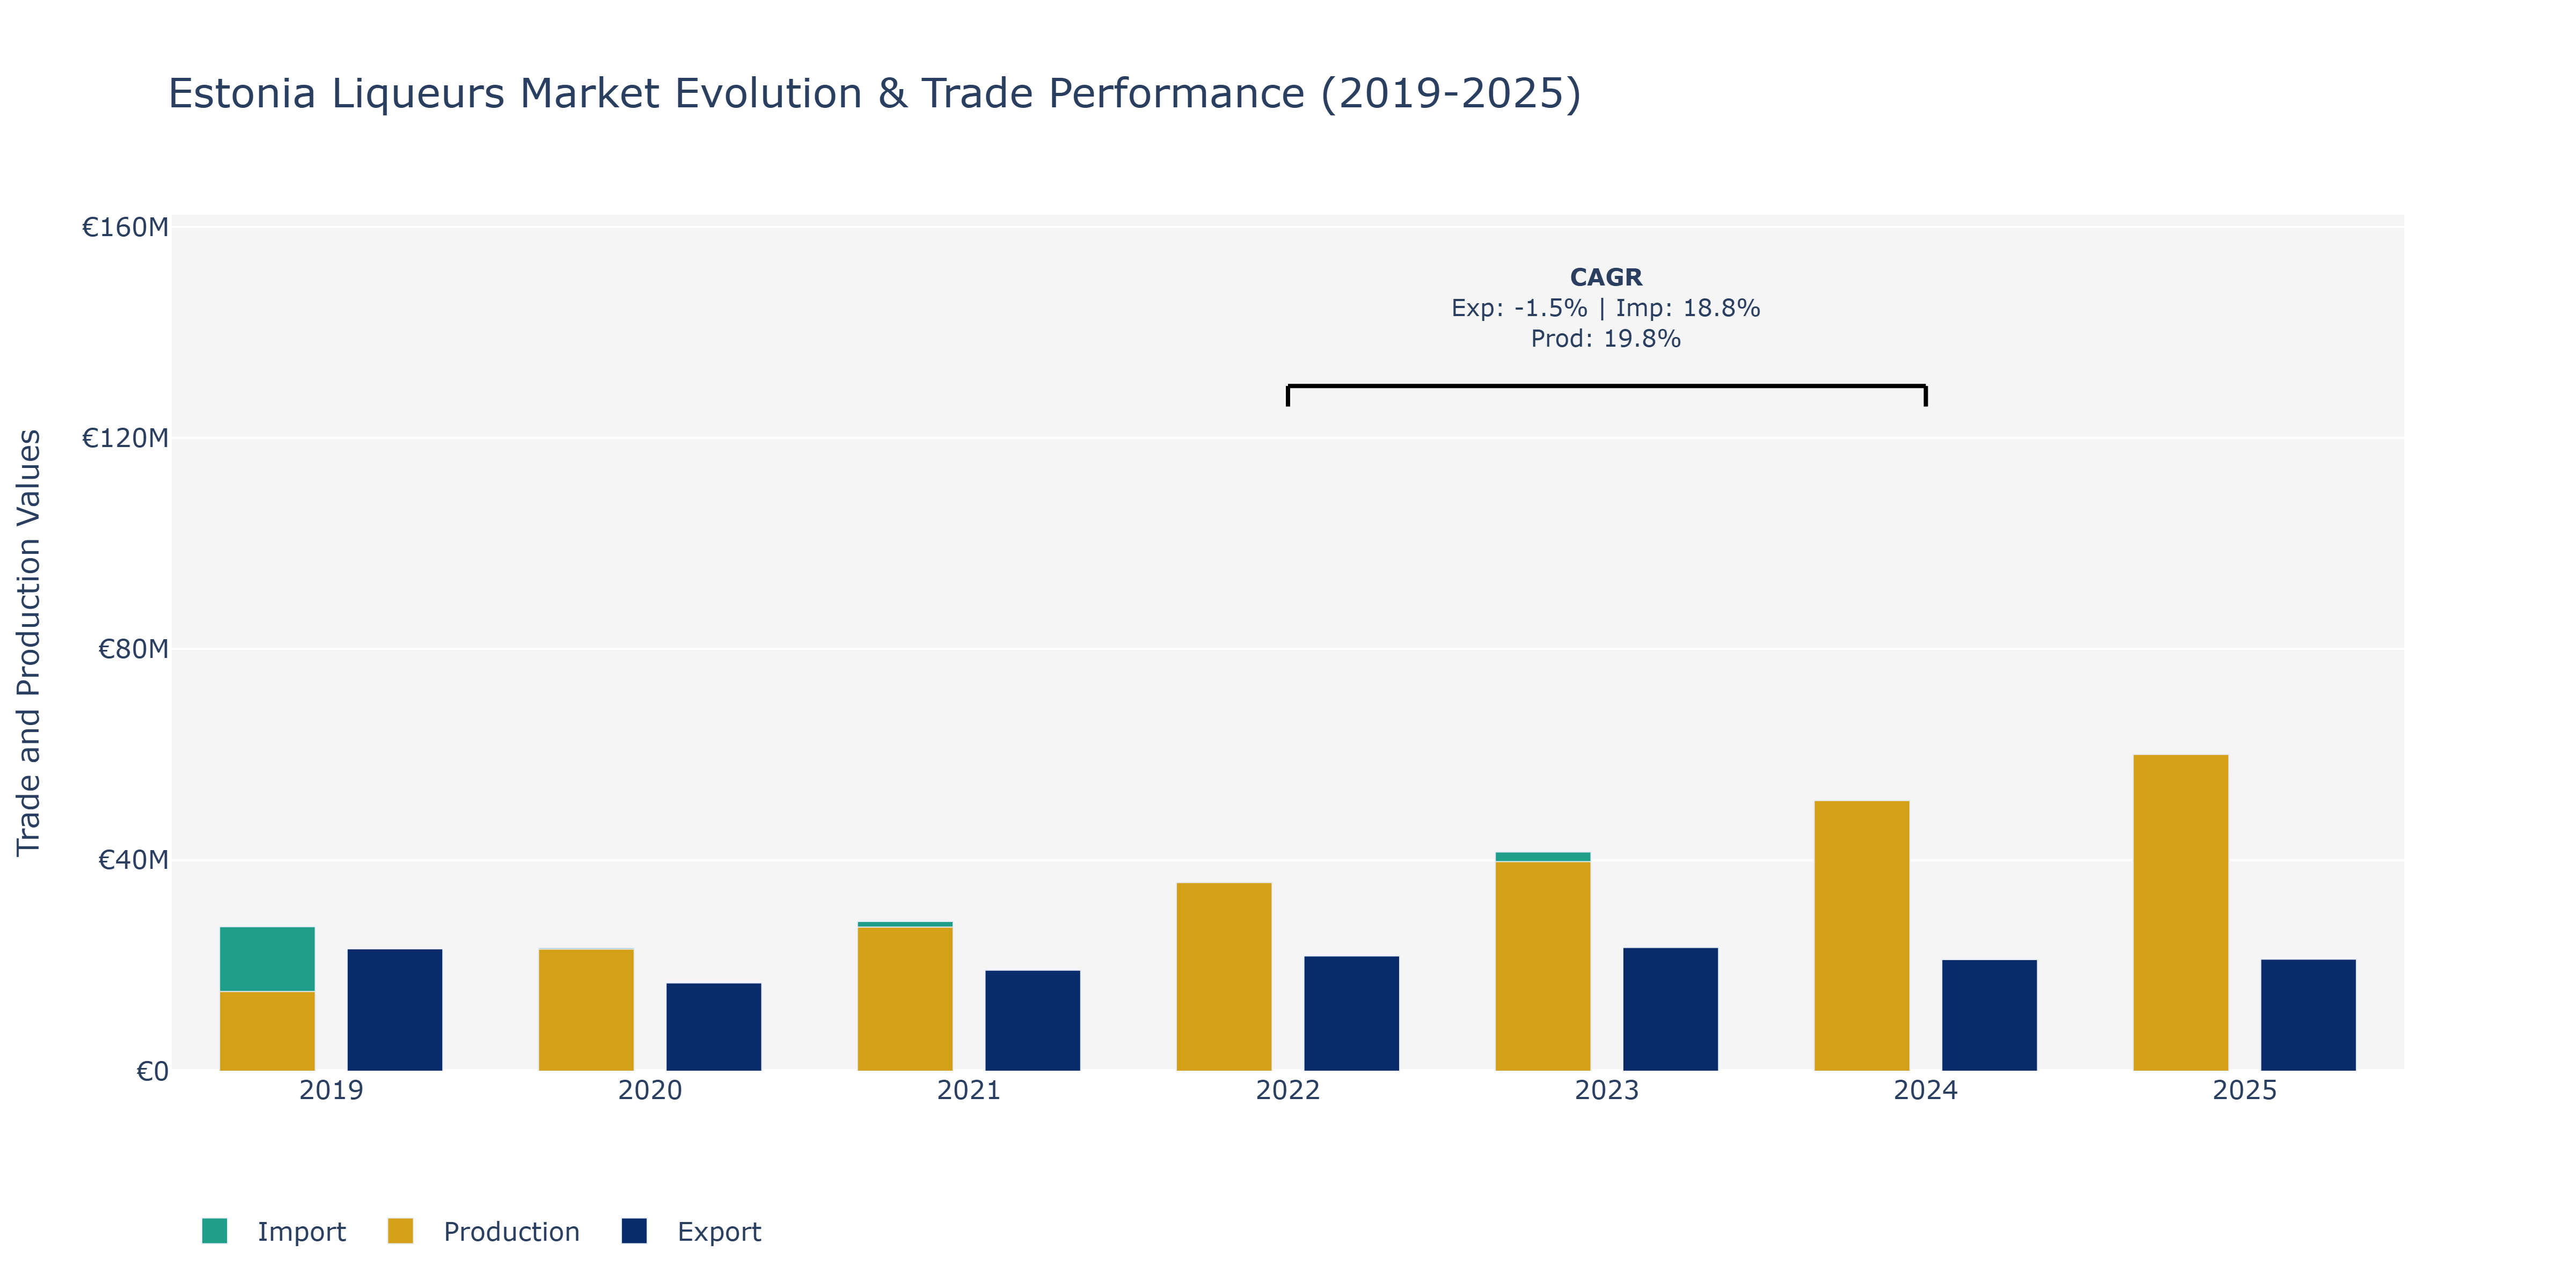
In the Estonia Liqueurs Market, from 2019 to 2025, we observe varying dynamics in Exports, Imports, and Production. Exports saw a slight decrease from €23.18 million in 2019 to €21.16 million in 2024, followed by a mild recovery to €21.24 million in 2025. Imports consistently rose from €27.37 million in 2019 to €55.9 million in 2025, indicating a growing demand for foreign liqueurs. Production surged from €15.11 million in 2019 to €60.04 million in 2025, showcasing a notable upward trend. The peak production in 2025 aligns with the increasing global trend towards premium and craft spirits, where Estonia likely benefited from consumer preferences for high-quality and locally produced liqueurs. The rise in imports could be attributed to changing consumer tastes, leading to a preference for a diverse range of international liqueur offerings. These trends highlight Estonia's evolving position in the global liqueurs market, emphasizing the importance of innovation and quality to meet consumer demands.
Key Highlights of the Report:
- Estonia Liqueurs Market Outlook
- Market Size of Estonia Liqueurs Market, 2025
- Forecast of Estonia Liqueurs Market, 2032
- Historical Data and Forecast of Estonia Liqueurs Revenues & Volume for the Period 2022 - 2032F
- Estonia Liqueurs Market Trend Evolution
- Estonia Liqueurs Market Drivers and Challenges
- Estonia Liqueurs Price Trends
- Estonia Liqueurs Porter`s Five Forces
- Estonia Liqueurs Industry Life Cycle
- Historical Data and Forecast of Estonia Liqueurs Market Revenues & Volume By Type for the Period 2022 - 2032F
- Historical Data and Forecast of Estonia Liqueurs Market Revenues & Volume By Neutrals/Bitters for the Period 2022 - 2032F
- Historical Data and Forecast of Estonia Liqueurs Market Revenues & Volume By Creams for the Period 2022 - 2032F
- Historical Data and Forecast of Estonia Liqueurs Market Revenues & Volume By Fruit Flavored for the Period 2022 - 2032F
- Historical Data and Forecast of Estonia Liqueurs Market Revenues & Volume By Others for the Period 2022 - 2032F
- Historical Data and Forecast of Estonia Liqueurs Market Revenues & Volume By Distribution Channel for the Period 2022 - 2032F
- Historical Data and Forecast of Estonia Liqueurs Market Revenues & Volume By Convenience Stores for the Period 2022 - 2032F
- Historical Data and Forecast of Estonia Liqueurs Market Revenues & Volume By On Premises for the Period 2022 - 2032F
- Historical Data and Forecast of Estonia Liqueurs Market Revenues & Volume By Retailers for the Period 2022 - 2032F
- Historical Data and Forecast of Estonia Liqueurs Market Revenues & Volume By Supermarkets for the Period 2022 - 2032F
- Historical Data and Forecast of Estonia Liqueurs Market Revenues & Volume By Packaging for the Period 2022 - 2032F
- Historical Data and Forecast of Estonia Liqueurs Market Revenues & Volume By Glass for the Period 2022 - 2032F
- Historical Data and Forecast of Estonia Liqueurs Market Revenues & Volume By PET Bottle for the Period 2022 - 2032F
- Historical Data and Forecast of Estonia Liqueurs Market Revenues & Volume By Metal Can for the Period 2022 - 2032F
- Historical Data and Forecast of Estonia Liqueurs Market Revenues & Volume By Others for the Period 2022 - 2032F
- Estonia Liqueurs Import Export Trade Statistics
- Market Opportunity Assessment By Type
- Market Opportunity Assessment By Distribution Channel
- Market Opportunity Assessment By Packaging
- Estonia Liqueurs Top Companies Market Share
- Estonia Liqueurs Competitive Benchmarking By Technical and Operational Parameters
- Estonia Liqueurs Company Profiles
- Estonia Liqueurs Key Strategic Recommendations
Frequently Asked Questions About the Market Study (FAQs):
6Wresearch actively monitors the Estonia Liqueurs Market and publishes its comprehensive annual report, highlighting emerging trends, growth drivers, revenue analysis, and forecast outlook. Our insights help businesses to make data-backed strategic decisions with ongoing market dynamics. Our analysts track relevent industries related to the Estonia Liqueurs Market, allowing our clients with actionable intelligence and reliable forecasts tailored to emerging regional needs.
Yes, we provide customisation as per your requirements. To learn more, feel free to contact us on sales@6wresearch.com
1 Executive Summary |
2 Introduction |
2.1 Key Highlights of the Report |
2.2 Report Description |
2.3 Market Scope & Segmentation |
2.4 Research Methodology |
2.5 Assumptions |
3 Estonia Liqueurs Market Overview |
3.1 Estonia Country Macro Economic Indicators |
3.2 Estonia Liqueurs Market Revenues & Volume, 2022 & 2032F |
3.3 Estonia Liqueurs Market - Industry Life Cycle |
3.4 Estonia Liqueurs Market - Porter's Five Forces |
3.5 Estonia Liqueurs Market Revenues & Volume Share, By Type, 2022 & 2032F |
3.6 Estonia Liqueurs Market Revenues & Volume Share, By Distribution Channel, 2022 & 2032F |
3.7 Estonia Liqueurs Market Revenues & Volume Share, By Packaging, 2022 & 2032F |
4 Estonia Liqueurs Market Dynamics |
4.1 Impact Analysis |
4.2 Market Drivers |
4.2.1 Increasing popularity of craft and artisanal liqueurs in Estonia |
4.2.2 Growing consumer interest in unique and premium liqueur flavors |
4.2.3 Rising disposable income leading to higher spending on luxury food and beverages |
4.3 Market Restraints |
4.3.1 Stringent regulations and taxes on alcohol production and sales in Estonia |
4.3.2 Competition from imported liqueur brands offering a wider variety of flavors and options |
5 Estonia Liqueurs Market Trends |
6 Estonia Liqueurs Market Segmentations |
6.1 Estonia Liqueurs Market, By Type |
6.1.1 Overview and Analysis |
6.1.2 Estonia Liqueurs Market Revenues & Volume, By Neutrals/Bitters, 2022 - 2032F |
6.1.3 Estonia Liqueurs Market Revenues & Volume, By Creams, 2022 - 2032F |
6.1.4 Estonia Liqueurs Market Revenues & Volume, By Fruit Flavored, 2022 - 2032F |
6.1.5 Estonia Liqueurs Market Revenues & Volume, By Others, 2022 - 2032F |
6.2 Estonia Liqueurs Market, By Distribution Channel |
6.2.1 Overview and Analysis |
6.2.2 Estonia Liqueurs Market Revenues & Volume, By Convenience Stores, 2022 - 2032F |
6.2.3 Estonia Liqueurs Market Revenues & Volume, By On Premises, 2022 - 2032F |
6.2.4 Estonia Liqueurs Market Revenues & Volume, By Retailers, 2022 - 2032F |
6.2.5 Estonia Liqueurs Market Revenues & Volume, By Supermarkets, 2022 - 2032F |
6.3 Estonia Liqueurs Market, By Packaging |
6.3.1 Overview and Analysis |
6.3.2 Estonia Liqueurs Market Revenues & Volume, By Glass, 2022 - 2032F |
6.3.3 Estonia Liqueurs Market Revenues & Volume, By PET Bottle, 2022 - 2032F |
6.3.4 Estonia Liqueurs Market Revenues & Volume, By Metal Can, 2022 - 2032F |
6.3.5 Estonia Liqueurs Market Revenues & Volume, By Others, 2022 - 2032F |
7 Estonia Liqueurs Market Import-Export Trade Statistics |
7.1 Estonia Liqueurs Market Export to Major Countries |
7.2 Estonia Liqueurs Market Imports from Major Countries |
8 Estonia Liqueurs Market Key Performance Indicators |
8.1 Number of new craft liqueurs introduced in the Estonian market |
8.2 Growth in online searches for artisanal liqueurs in Estonia |
8.3 Percentage increase in consumer spending on premium food and beverages in Estonia |
8.4 Number of new distribution channels for Estonian liqueur brands |
8.5 Growth in tourism and demand for local liqueur products in Estonia |
9 Estonia Liqueurs Market - Opportunity Assessment |
9.1 Estonia Liqueurs Market Opportunity Assessment, By Type, 2022 & 2032F |
9.2 Estonia Liqueurs Market Opportunity Assessment, By Distribution Channel, 2022 & 2032F |
9.3 Estonia Liqueurs Market Opportunity Assessment, By Packaging, 2022 & 2032F |
10 Estonia Liqueurs Market - Competitive Landscape |
10.1 Estonia Liqueurs Market Revenue Share, By Companies, 2025 |
10.2 Estonia Liqueurs Market Competitive Benchmarking, By Operating and Technical Parameters |
11 Company Profiles |
12 Recommendations | 13 Disclaimer |
Global Go To Market Strategy - 2030
Export potential enables firms to identify high-growth global markets with greater confidence by combining advanced trade intelligence with a structured quantitative methodology. The framework analyzes emerging demand trends and country-level import patterns while integrating macroeconomic and trade datasets such as GDP and population forecasts, bilateral import–export flows, tariff structures, elasticity differentials between developed and developing economies, geographic distance, and import demand projections. Using weighted trade values from 2020–2024 as the base period to project country-to-country export potential for 2030, these inputs are operationalized through calculated drivers such as gravity model parameters, tariff impact factors, and projected GDP per-capita growth. Through an analysis of hidden potentials, demand hotspots, and market conditions that are most favorable to success, this method enables firms to focus on target countries, maximize returns, and global expansion with data, backed by accuracy.
By factoring in the projected importer demand gap that is currently unmet and could be potential opportunity, it identifies the potential for the Exporter (Country) among 190 countries, against the general trade analysis, which identifies the biggest importer or exporter.
To discover high-growth global markets and optimize your business strategy:
Click Here
Pricing
- Single User License$ 1,995
- Department License$ 2,400
- Site License$ 3,120
- Global License$ 3,795

Leadership Perspectives from Industry Events
Search
Thought Leadership and Analyst Meet


Our Clients
6WResearch In News
- India Export Attractiveness Tracker 2026
- India Air Conditioner Market Set for Strong Rebound in 2026 After Weather-Led Correction and GST-Driven Recovery: 6Wresearch
- ADAS in India: How Automatic Emergency Braking, Blind Spot Detection & Driver Monitoring are Transforming Road Safety
- Doha a strategic location for EV manufacturing hub: IPA Qatar
- Demand for luxury TVs surging in the GCC, says Samsung
- Empowering Growth: The Thriving Journey of Bangladesh’s Cable Industry
Latest Reports
- Nicaragua RPG Gaming Market (2026-2032)
- New Zealand RPG Gaming Market (2026-2032)
- Netherlands RPG Gaming Market (2026-2032)
- Nauru RPG Gaming Market (2026-2032)
- Namibia RPG Gaming Market (2026-2032)
- Mozambique RPG Gaming Market (2026-2032)
- Montenegro RPG Gaming Market (2026-2032)
- Mongolia RPG Gaming Market (2026-2032)
- Monaco RPG Gaming Market (2026-2032)
- Micronesia RPG Gaming Market (2026-2032)
Industry Events and Analyst Meet

EV India Expo 2026

HIMTEX 2026

India Refining Summit 2026

India EV Show 2026

EV tech India Expo 2026
Whitepaper
- Middle East & Africa Commercial Security Market Click here to view more.
- Middle East & Africa Fire Safety Systems & Equipment Market Click here to view more.
- GCC Drone Market Click here to view more.
- Middle East Lighting Fixture Market Click here to view more.
- GCC Physical & Perimeter Security Market Click here to view more.