Estonia PVC Rigid Electrical Conduit Market (2026-2032) | Consumer Insights, Analysis, Outlook, Trends, Demand, Opportunities, Growth, Strategic Insights, Competition, Competitive, Segmentation, Companies, Pricing Analysis, Challenges, Forecast, Share, Strategy, Industry, Drivers, Revenue, Size, Restraints, Segments, Supply, Investment Trends, Value
Market Forecast By Type (Plain Conduit, Corrugated Conduit, Flexible Conduit, Heavy-Duty Conduit, Others), By Diameter (<20mm, 20-50mm, 50-100mm, >100mm, Others), By End-Use (Construction, Industrial, Infrastructure, Energy, Others), By Application (Wiring Protection, Cable Management, Underground Wiring, Power Distribution, Others) And Competitive Landscape
| Product Code: ETC10244511 | Publication Date: Apr 2025 | Updated Date: Apr 2026 | Product Type: Market Research Report | |
| Publisher: 6Wresearch | Author: Bhawna Singh | No. of Pages: 65 | No. of Figures: 34 | No. of Tables: 19 |
Estonia Pvc Rigid Electrical Conduit Market Size (2020-2030)
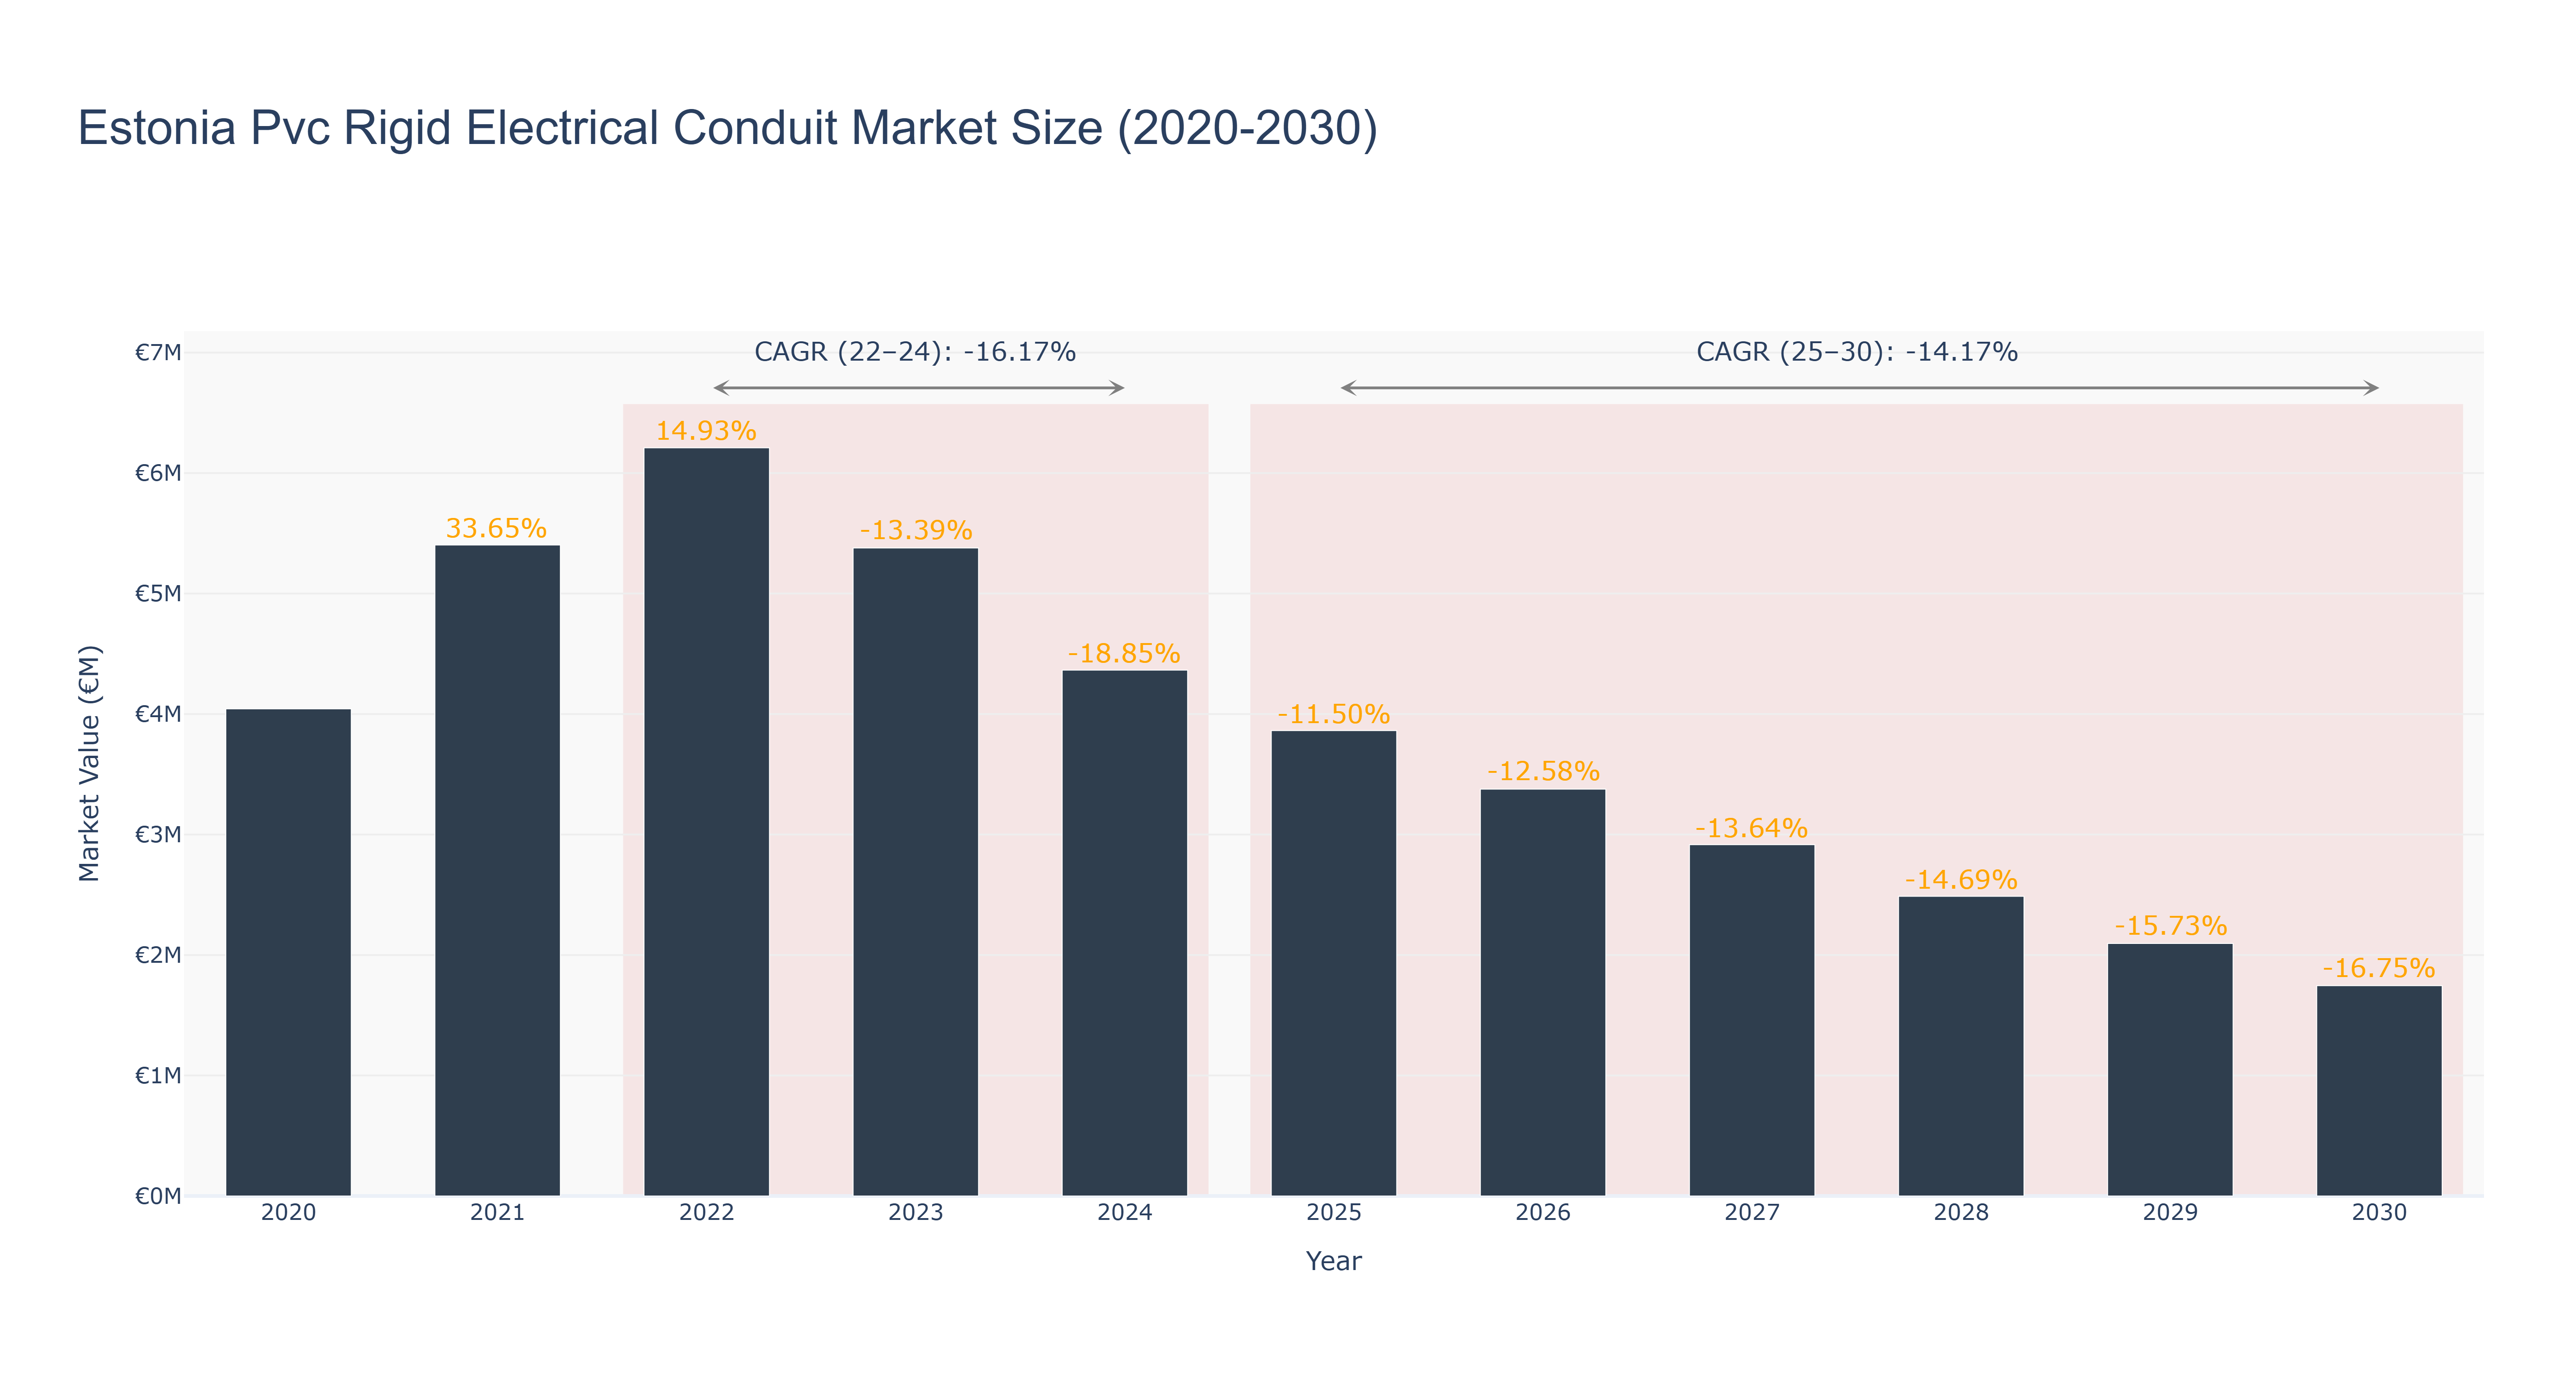
The Estonia PVC Rigid Electrical Conduit Market has seen a decline in market size over the years. The peak market size of €6.21 million was recorded in 2022, followed by a steady decrease to €3.38 million in 2026. The market is forecasted to continue shrinking, with an expected size of €1.75 million in 2030. The CAGR for the period 2022-24 was -16.17%, while for 2025-30 it is projected to be -14.17%. The downturn can be attributed to factors such as economic slowdown, changing consumer preferences, and increasing competition. Despite the challenging market conditions, upcoming infrastructure projects in Estonia, such as the development of smart cities and renewable energy initiatives, offer opportunities for growth in the PVC conduit sector. Industry drivers include technological advancements, regulatory support for sustainable solutions, and the need for modernizing infrastructure.
Estonia Pvc Rigid Electrical Conduit Market: Production & Trade Performance (2019-2025)
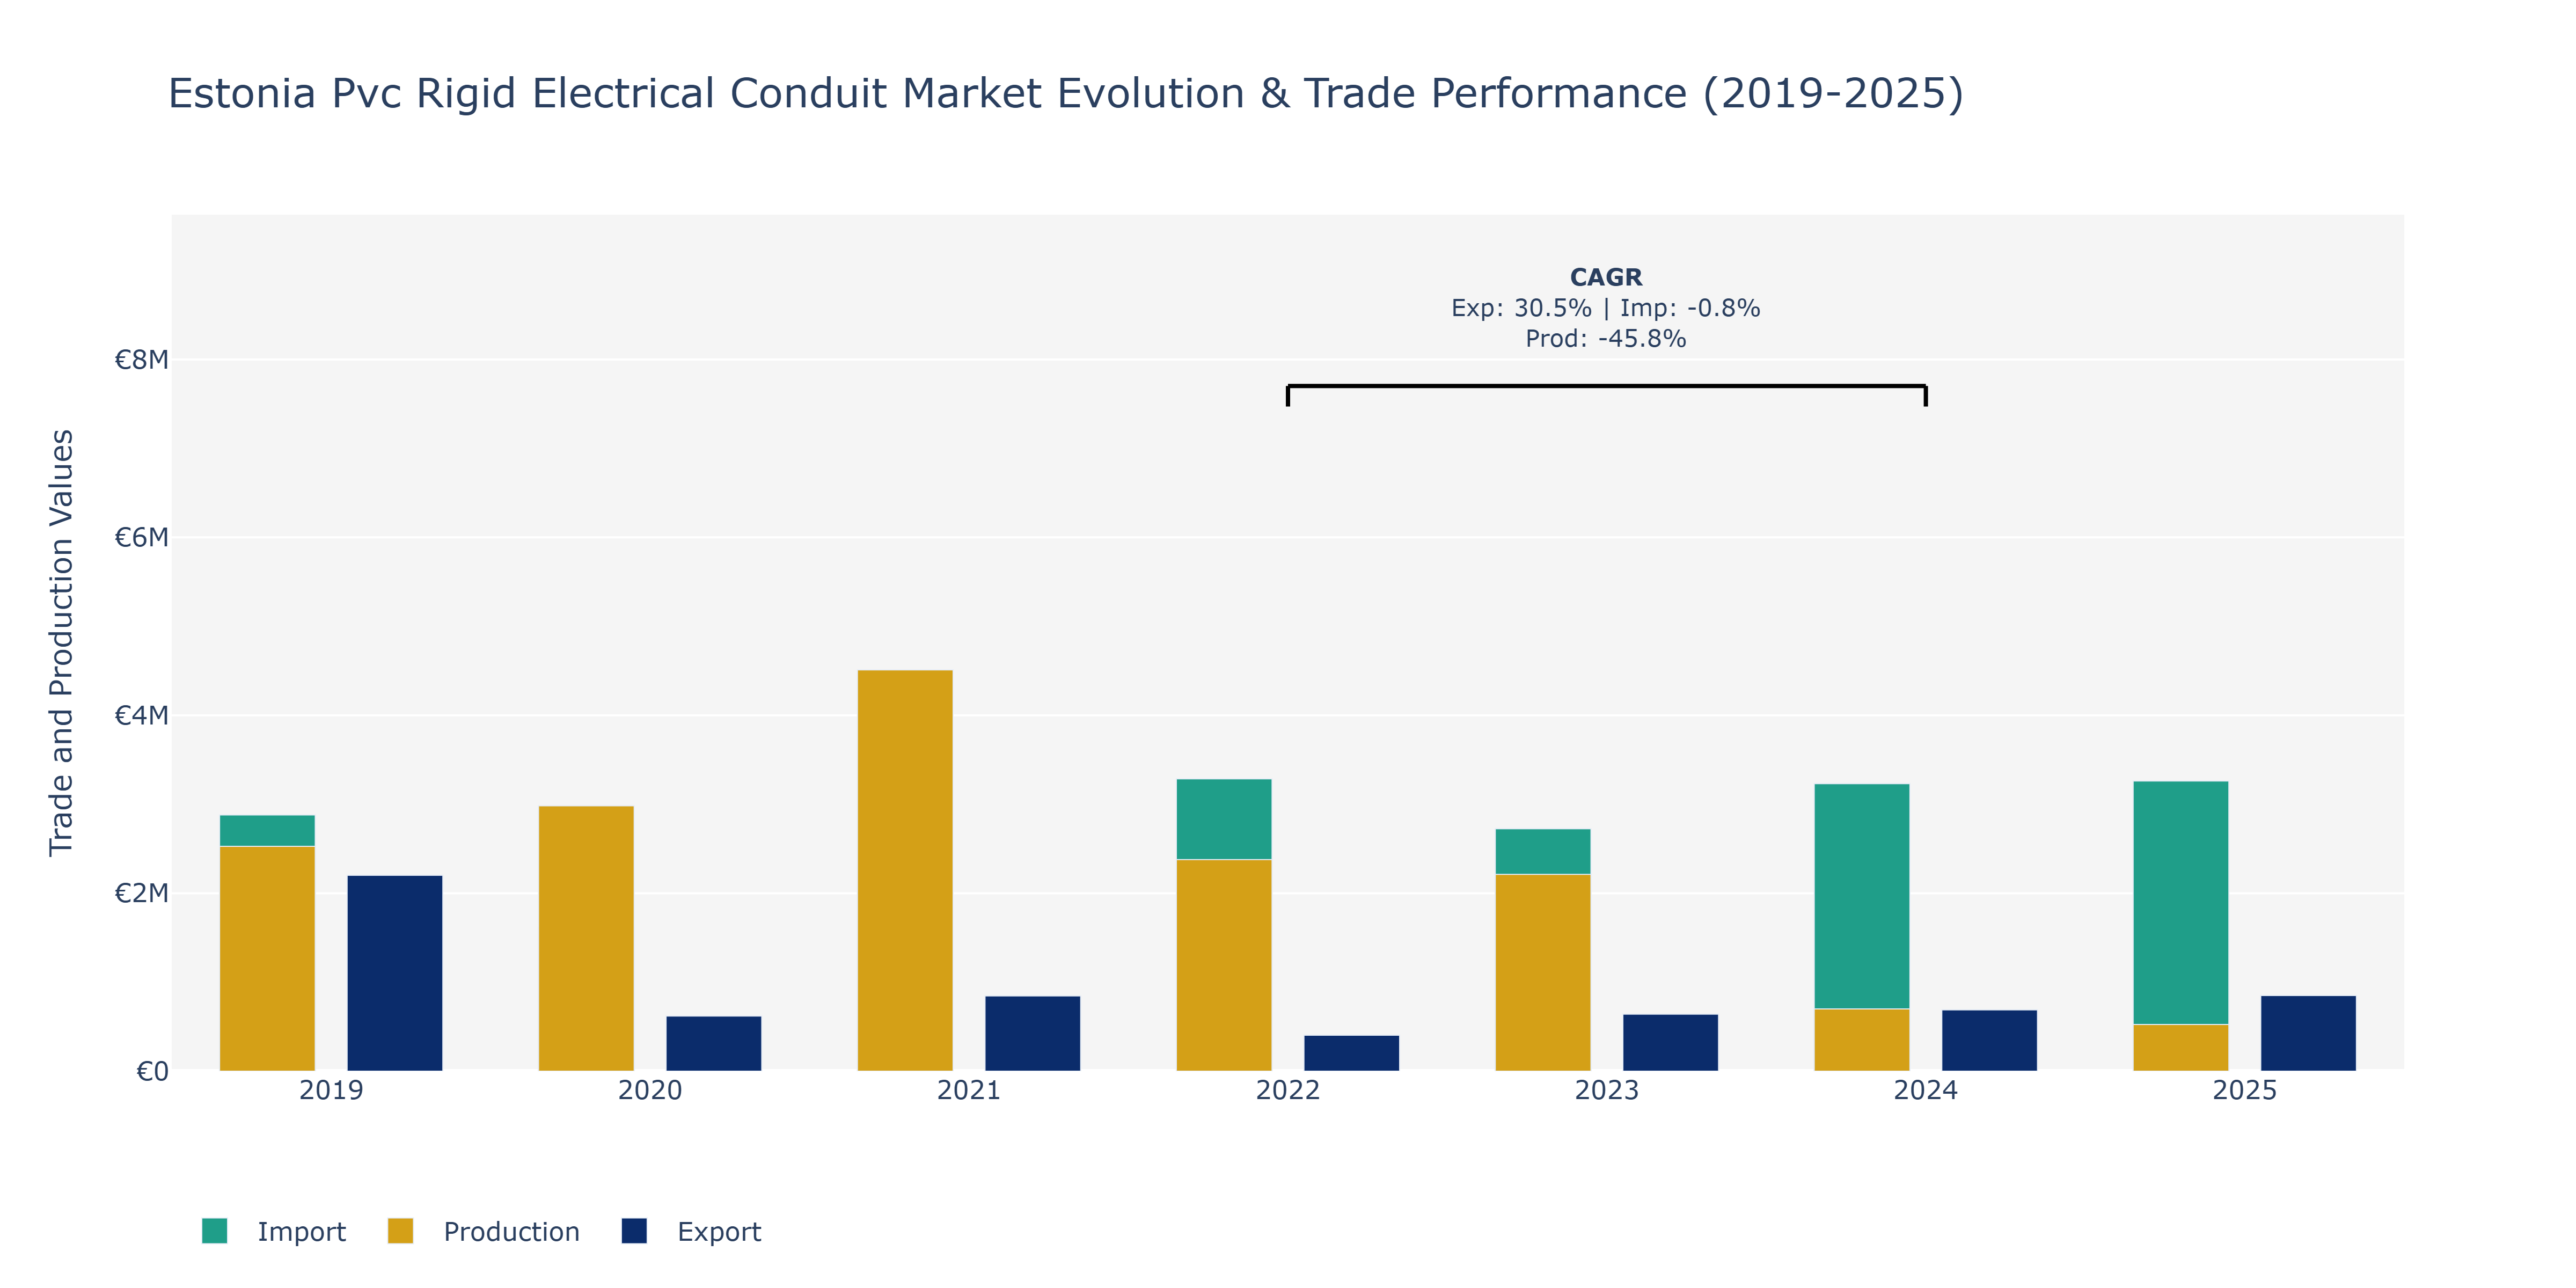
Between 2019 and 2025, the Estonia PVC Rigid Electrical Conduit Market witnessed notable shifts in exports, imports, and production. Exports experienced a sharp decline from €2.2 million in 2019 to around €845.89 thousand in 2021 before gradually recovering to approximately €850.21 thousand in 2025. This fluctuation may be attributed to changing global demand patterns and competitive pricing strategies. Imports followed a different trajectory, rising steadily from €2.88 million in 2019 to over €3.26 million in 2025. This upward trend could be linked to increased domestic consumption or a reliance on foreign suppliers for specialized components. On the other hand, production peaked at €4.51 million in 2021 before dropping to around €530 thousand in 2025, reflecting potential supply chain disruptions, market saturation, or shifts in manufacturing processes. Such dynamics demonstrate the market's sensitivity to both domestic and international factors, highlighting the need for strategic planning and adaptation to maintain competitiveness in the sector.
Key Highlights of the Report:
- Estonia PVC Rigid Electrical Conduit Market Outlook
- Market Size of Estonia PVC Rigid Electrical Conduit Market, 2025
- Forecast of Estonia PVC Rigid Electrical Conduit Market, 2032
- Historical Data and Forecast of Estonia PVC Rigid Electrical Conduit Revenues & Volume for the Period 2022 - 2032F
- Estonia PVC Rigid Electrical Conduit Market Trend Evolution
- Estonia PVC Rigid Electrical Conduit Market Drivers and Challenges
- Estonia PVC Rigid Electrical Conduit Price Trends
- Estonia PVC Rigid Electrical Conduit Porter's Five Forces
- Estonia PVC Rigid Electrical Conduit Industry Life Cycle
- Historical Data and Forecast of Estonia PVC Rigid Electrical Conduit Market Revenues & Volume By Type for the Period 2022 - 2032F
- Historical Data and Forecast of Estonia PVC Rigid Electrical Conduit Market Revenues & Volume By Plain Conduit for the Period 2022 - 2032F
- Historical Data and Forecast of Estonia PVC Rigid Electrical Conduit Market Revenues & Volume By Corrugated Conduit for the Period 2022 - 2032F
- Historical Data and Forecast of Estonia PVC Rigid Electrical Conduit Market Revenues & Volume By Flexible Conduit for the Period 2022 - 2032F
- Historical Data and Forecast of Estonia PVC Rigid Electrical Conduit Market Revenues & Volume By Heavy-Duty Conduit for the Period 2022 - 2032F
- Historical Data and Forecast of Estonia PVC Rigid Electrical Conduit Market Revenues & Volume By Others for the Period 2022 - 2032F
- Historical Data and Forecast of Estonia PVC Rigid Electrical Conduit Market Revenues & Volume By Diameter for the Period 2022 - 2032F
- Historical Data and Forecast of Estonia PVC Rigid Electrical Conduit Market Revenues & Volume By <20mm for the Period 2022 - 2032F
- Historical Data and Forecast of Estonia PVC Rigid Electrical Conduit Market Revenues & Volume By 20-50mm for the Period 2022 - 2032F
- Historical Data and Forecast of Estonia PVC Rigid Electrical Conduit Market Revenues & Volume By 50-100mm for the Period 2022 - 2032F
- Historical Data and Forecast of Estonia PVC Rigid Electrical Conduit Market Revenues & Volume By >100mm for the Period 2022 - 2032F
- Historical Data and Forecast of Estonia PVC Rigid Electrical Conduit Market Revenues & Volume By Others for the Period 2022 - 2032F
- Historical Data and Forecast of Estonia PVC Rigid Electrical Conduit Market Revenues & Volume By End-Use for the Period 2022 - 2032F
- Historical Data and Forecast of Estonia PVC Rigid Electrical Conduit Market Revenues & Volume By Construction for the Period 2022 - 2032F
- Historical Data and Forecast of Estonia PVC Rigid Electrical Conduit Market Revenues & Volume By Industrial for the Period 2022 - 2032F
- Historical Data and Forecast of Estonia PVC Rigid Electrical Conduit Market Revenues & Volume By Infrastructure for the Period 2022 - 2032F
- Historical Data and Forecast of Estonia PVC Rigid Electrical Conduit Market Revenues & Volume By Energy for the Period 2022 - 2032F
- Historical Data and Forecast of Estonia PVC Rigid Electrical Conduit Market Revenues & Volume By Others for the Period 2022 - 2032F
- Historical Data and Forecast of Estonia PVC Rigid Electrical Conduit Market Revenues & Volume By Application for the Period 2022 - 2032F
- Historical Data and Forecast of Estonia PVC Rigid Electrical Conduit Market Revenues & Volume By Wiring Protection for the Period 2022 - 2032F
- Historical Data and Forecast of Estonia PVC Rigid Electrical Conduit Market Revenues & Volume By Cable Management for the Period 2022 - 2032F
- Historical Data and Forecast of Estonia PVC Rigid Electrical Conduit Market Revenues & Volume By Underground Wiring for the Period 2022 - 2032F
- Historical Data and Forecast of Estonia PVC Rigid Electrical Conduit Market Revenues & Volume By Power Distribution for the Period 2022 - 2032F
- Historical Data and Forecast of Estonia PVC Rigid Electrical Conduit Market Revenues & Volume By Others for the Period 2022 - 2032F
- Estonia PVC Rigid Electrical Conduit Import Export Trade Statistics
- Market Opportunity Assessment By Type
- Market Opportunity Assessment By Diameter
- Market Opportunity Assessment By End-Use
- Market Opportunity Assessment By Application
- Estonia PVC Rigid Electrical Conduit Top Companies Market Share
- Estonia PVC Rigid Electrical Conduit Competitive Benchmarking By Technical and Operational Parameters
- Estonia PVC Rigid Electrical Conduit Company Profiles
- Estonia PVC Rigid Electrical Conduit Key Strategic Recommendations
Frequently Asked Questions About the Market Study (FAQs):
6Wresearch actively monitors the Estonia PVC Rigid Electrical Conduit Market and publishes its comprehensive annual report, highlighting emerging trends, growth drivers, revenue analysis, and forecast outlook. Our insights help businesses to make data-backed strategic decisions with ongoing market dynamics. Our analysts track relevent industries related to the Estonia PVC Rigid Electrical Conduit Market, allowing our clients with actionable intelligence and reliable forecasts tailored to emerging regional needs.
Yes, we provide customisation as per your requirements. To learn more, feel free to contact us on sales@6wresearch.com
1 Executive Summary |
2 Introduction |
2.1 Key Highlights of the Report |
2.2 Report Description |
2.3 Market Scope & Segmentation |
2.4 Research Methodology |
2.5 Assumptions |
3 Estonia PVC Rigid Electrical Conduit Market Overview |
3.1 Estonia Country Macro Economic Indicators |
3.2 Estonia PVC Rigid Electrical Conduit Market Revenues & Volume, 2022 & 2032F |
3.3 Estonia PVC Rigid Electrical Conduit Market - Industry Life Cycle |
3.4 Estonia PVC Rigid Electrical Conduit Market - Porter's Five Forces |
3.5 Estonia PVC Rigid Electrical Conduit Market Revenues & Volume Share, By Type, 2022 & 2032F |
3.6 Estonia PVC Rigid Electrical Conduit Market Revenues & Volume Share, By Diameter, 2022 & 2032F |
3.7 Estonia PVC Rigid Electrical Conduit Market Revenues & Volume Share, By End-Use, 2022 & 2032F |
3.8 Estonia PVC Rigid Electrical Conduit Market Revenues & Volume Share, By Application, 2022 & 2032F |
4 Estonia PVC Rigid Electrical Conduit Market Dynamics |
4.1 Impact Analysis |
4.2 Market Drivers |
4.2.1 Increasing construction activities in Estonia leading to higher demand for electrical infrastructure |
4.2.2 Growing awareness about the benefits of using PVC rigid electrical conduits over traditional materials |
4.2.3 Government initiatives promoting the use of sustainable and energy-efficient materials in construction projects |
4.3 Market Restraints |
4.3.1 Fluctuating raw material prices impacting the overall production cost of PVC rigid electrical conduits |
4.3.2 Competition from alternative materials such as metal conduits and flexible conduits in the market |
5 Estonia PVC Rigid Electrical Conduit Market Trends |
6 Estonia PVC Rigid Electrical Conduit Market, By Types |
6.1 Estonia PVC Rigid Electrical Conduit Market, By Type |
6.1.1 Overview and Analysis |
6.1.2 Estonia PVC Rigid Electrical Conduit Market Revenues & Volume, By Type, 2022 - 2032F |
6.1.3 Estonia PVC Rigid Electrical Conduit Market Revenues & Volume, By Plain Conduit, 2022 - 2032F |
6.1.4 Estonia PVC Rigid Electrical Conduit Market Revenues & Volume, By Corrugated Conduit, 2022 - 2032F |
6.1.5 Estonia PVC Rigid Electrical Conduit Market Revenues & Volume, By Flexible Conduit, 2022 - 2032F |
6.1.6 Estonia PVC Rigid Electrical Conduit Market Revenues & Volume, By Heavy-Duty Conduit, 2022 - 2032F |
6.1.7 Estonia PVC Rigid Electrical Conduit Market Revenues & Volume, By Others, 2022 - 2032F |
6.2 Estonia PVC Rigid Electrical Conduit Market, By Diameter |
6.2.1 Overview and Analysis |
6.2.2 Estonia PVC Rigid Electrical Conduit Market Revenues & Volume, By |
6.2.3 Estonia PVC Rigid Electrical Conduit Market Revenues & Volume, By 20-50mm, 2022 - 2032F |
6.2.4 Estonia PVC Rigid Electrical Conduit Market Revenues & Volume, By 50-100mm, 2022 - 2032F |
6.2.5 Estonia PVC Rigid Electrical Conduit Market Revenues & Volume, By >100mm, 2022 - 2032F |
6.2.6 Estonia PVC Rigid Electrical Conduit Market Revenues & Volume, By Others, 2022 - 2032F |
6.3 Estonia PVC Rigid Electrical Conduit Market, By End-Use |
6.3.1 Overview and Analysis |
6.3.2 Estonia PVC Rigid Electrical Conduit Market Revenues & Volume, By Construction, 2022 - 2032F |
6.3.3 Estonia PVC Rigid Electrical Conduit Market Revenues & Volume, By Industrial, 2022 - 2032F |
6.3.4 Estonia PVC Rigid Electrical Conduit Market Revenues & Volume, By Infrastructure, 2022 - 2032F |
6.3.5 Estonia PVC Rigid Electrical Conduit Market Revenues & Volume, By Energy, 2022 - 2032F |
6.3.6 Estonia PVC Rigid Electrical Conduit Market Revenues & Volume, By Others, 2022 - 2032F |
6.4 Estonia PVC Rigid Electrical Conduit Market, By Application |
6.4.1 Overview and Analysis |
6.4.2 Estonia PVC Rigid Electrical Conduit Market Revenues & Volume, By Wiring Protection, 2022 - 2032F |
6.4.3 Estonia PVC Rigid Electrical Conduit Market Revenues & Volume, By Cable Management, 2022 - 2032F |
6.4.4 Estonia PVC Rigid Electrical Conduit Market Revenues & Volume, By Underground Wiring, 2022 - 2032F |
6.4.5 Estonia PVC Rigid Electrical Conduit Market Revenues & Volume, By Power Distribution, 2022 - 2032F |
6.4.6 Estonia PVC Rigid Electrical Conduit Market Revenues & Volume, By Others, 2022 - 2032F |
7 Estonia PVC Rigid Electrical Conduit Market Import-Export Trade Statistics |
7.1 Estonia PVC Rigid Electrical Conduit Market Export to Major Countries |
7.2 Estonia PVC Rigid Electrical Conduit Market Imports from Major Countries |
8 Estonia PVC Rigid Electrical Conduit Market Key Performance Indicators |
8.1 Number of new construction projects incorporating PVC rigid electrical conduits |
8.2 Percentage increase in the adoption rate of PVC conduits compared to other materials |
8.3 Amount of government funding allocated to infrastructure projects using PVC rigid electrical conduits |
8.4 Growth rate of the electrical conduit market segment in Estonia |
8.5 Number of certifications or quality standards achieved by PVC rigid electrical conduit manufacturers in Estonia |
9 Estonia PVC Rigid Electrical Conduit Market - Opportunity Assessment |
9.1 Estonia PVC Rigid Electrical Conduit Market Opportunity Assessment, By Type, 2022 & 2032F |
9.2 Estonia PVC Rigid Electrical Conduit Market Opportunity Assessment, By Diameter, 2022 & 2032F |
9.3 Estonia PVC Rigid Electrical Conduit Market Opportunity Assessment, By End-Use, 2022 & 2032F |
9.4 Estonia PVC Rigid Electrical Conduit Market Opportunity Assessment, By Application, 2022 & 2032F |
10 Estonia PVC Rigid Electrical Conduit Market - Competitive Landscape |
10.1 Estonia PVC Rigid Electrical Conduit Market Revenue Share, By Companies, 2025 |
10.2 Estonia PVC Rigid Electrical Conduit Market Competitive Benchmarking, By Operating and Technical Parameters |
11 Company Profiles |
12 Recommendations |
13 Disclaimer |
Export potential assessment - trade Analytics for 2030
Export potential enables firms to identify high-growth global markets with greater confidence by combining advanced trade intelligence with a structured quantitative methodology. The framework analyzes emerging demand trends and country-level import patterns while integrating macroeconomic and trade datasets such as GDP and population forecasts, bilateral import–export flows, tariff structures, elasticity differentials between developed and developing economies, geographic distance, and import demand projections. Using weighted trade values from 2020–2024 as the base period to project country-to-country export potential for 2030, these inputs are operationalized through calculated drivers such as gravity model parameters, tariff impact factors, and projected GDP per-capita growth. Through an analysis of hidden potentials, demand hotspots, and market conditions that are most favorable to success, this method enables firms to focus on target countries, maximize returns, and global expansion with data, backed by accuracy.
By factoring in the projected importer demand gap that is currently unmet and could be potential opportunity, it identifies the potential for the Exporter (Country) among 190 countries, against the general trade analysis, which identifies the biggest importer or exporter.
To discover high-growth global markets and optimize your business strategy:
Click Here
Pricing
- Single User License$ 1,995
- Department License$ 2,400
- Site License$ 3,120
- Global License$ 3,795

Search
Thought Leadership and Analyst Meet


Our Clients
Latest Reports
- India Ultrasonic Smart Water Meter Market (2026-2032) | Outlook, Competition, Drivers, Trends, Demand, Competitive, Strategic Insights, Companies, Challenges, Strategy, Consumer Insights, Analysis, Opportunities, Growth, Size, Share, Industry, Revenue, Segments, Value, Segmentation, Supply, Forecast, Restraints,
- India Electromagnetic Bulk Flow Meter Market (2026-2032) | Analysis, Challenges, Strategic Insights, Supply, Forecast, Growth, Share, Consumer Insights, Competitive, Value, Outlook, Size & Demand,
- India Battery Powered Bulk Flow Meter Market (2026-2032) | Outlook, Analysis, Competitive Landscape, Growth, Size, Trends, Value, Revenue, Companies, Segmentation, Share & Forecast
- Bosnia and Herzegovina Fuel-Efficient Winglets Market (2026-2032) | Growth, Competition, Strategy, Restraints, Trends, Challenges, segmentation, Value, Outlook, Investment Opportunities, Analysis, Revenue, Companies, Insights, Pricing, Size, Drivers, Demand, Share, Forecast
- Canada Cloud CFD Market (2026-2032) | Size & Revenue, Industry, Growth, Competitive Landscape, Forecast, Segmentation, Value, Outlook, Trends, Share, Analysis, Companies
- Taiwan Food Delivery Platform Market (2026-2032) | Companies, Outlook, Analysis, Trends, Value, Revenue, Segmentation, Share, Forecast, Competitive Landscape, Growth, Size & Forecast
- United Kingdom (UK) Long-term Care Insurance Market (2026-2032) | Growth, Share, Consumer Insights, Drivers, Opportunities, Competition, Pricing Analysis, Segments, Restraints, Companies, Competitive, Value, Outlook, Size, Demand, Analysis, Challenges, Strategic Insights, Investment Trends, Revenue, Trends, Supply, Forecast
- United Kingdom (UK) Long Term Care Market (2026-2032) | Companies, Outlook, Analysis, Trends, Value, Revenue, Segmentation, Share, Forecast, Competitive Landscape, Growth, Size & Forecast
- Iraq Insulation and Waterproofing Market (2026-2032) | Outlook, Drivers, Growth, Size, Share, Industry, Revenue, Trends, Demand, Competitive, Strategic Insights, Opportunities, Segments, Companies, Challenges, Strategy, Consumer Insights, Analysis, Investment Trends, Value, Segmentation, Forecast, Restraints
- India Switchgear Market Outlook (2026-2032) | Size, Share, Trends, Growth, Revenue, Forecast, Analysis, Value, Outlook
Industry Events and Analyst Meet

India EV Show 2026

EV tech India Expo 2026

Auto Tech Asia 2026

Battery Tech India 2026

Smart Production Solutions Guangzhou 2026
Whitepaper
- Middle East & Africa Commercial Security Market Click here to view more.
- Middle East & Africa Fire Safety Systems & Equipment Market Click here to view more.
- GCC Drone Market Click here to view more.
- Middle East Lighting Fixture Market Click here to view more.
- GCC Physical & Perimeter Security Market Click here to view more.
6WResearch In News
- Doha a strategic location for EV manufacturing hub: IPA Qatar
- Demand for luxury TVs surging in the GCC, says Samsung
- Empowering Growth: The Thriving Journey of Bangladesh’s Cable Industry
- Demand for luxury TVs surging in the GCC, says Samsung
- Video call with a traditional healer? Once unthinkable, it’s now common in South Africa
- Intelligent Buildings To Smooth GCC’s Path To Net Zero