Estonia Safety Shoes Market (2026-2032) | Trends, Industry, Share, Analysis, Size, Segmentation, Revenue, Value, Companies, Growth, Outlook & Forecast
Market Forecast By Type (Leather, Rubber, Pvc, Polyurethane, Others), By Application (Construction, Manufacturing, Mining, Transportation, Others), By Distribution Channel (Online, Offline) And Competitive Landscape
| Product Code: ETC5086617 | Publication Date: Nov 2023 | Updated Date: Apr 2026 | Product Type: Market Research Report | |
| Publisher: 6Wresearch | Author: Shubham Padhi | No. of Pages: 60 | No. of Figures: 30 | No. of Tables: 5 |
Estonia Safety Shoes Market Size (2020-2030)
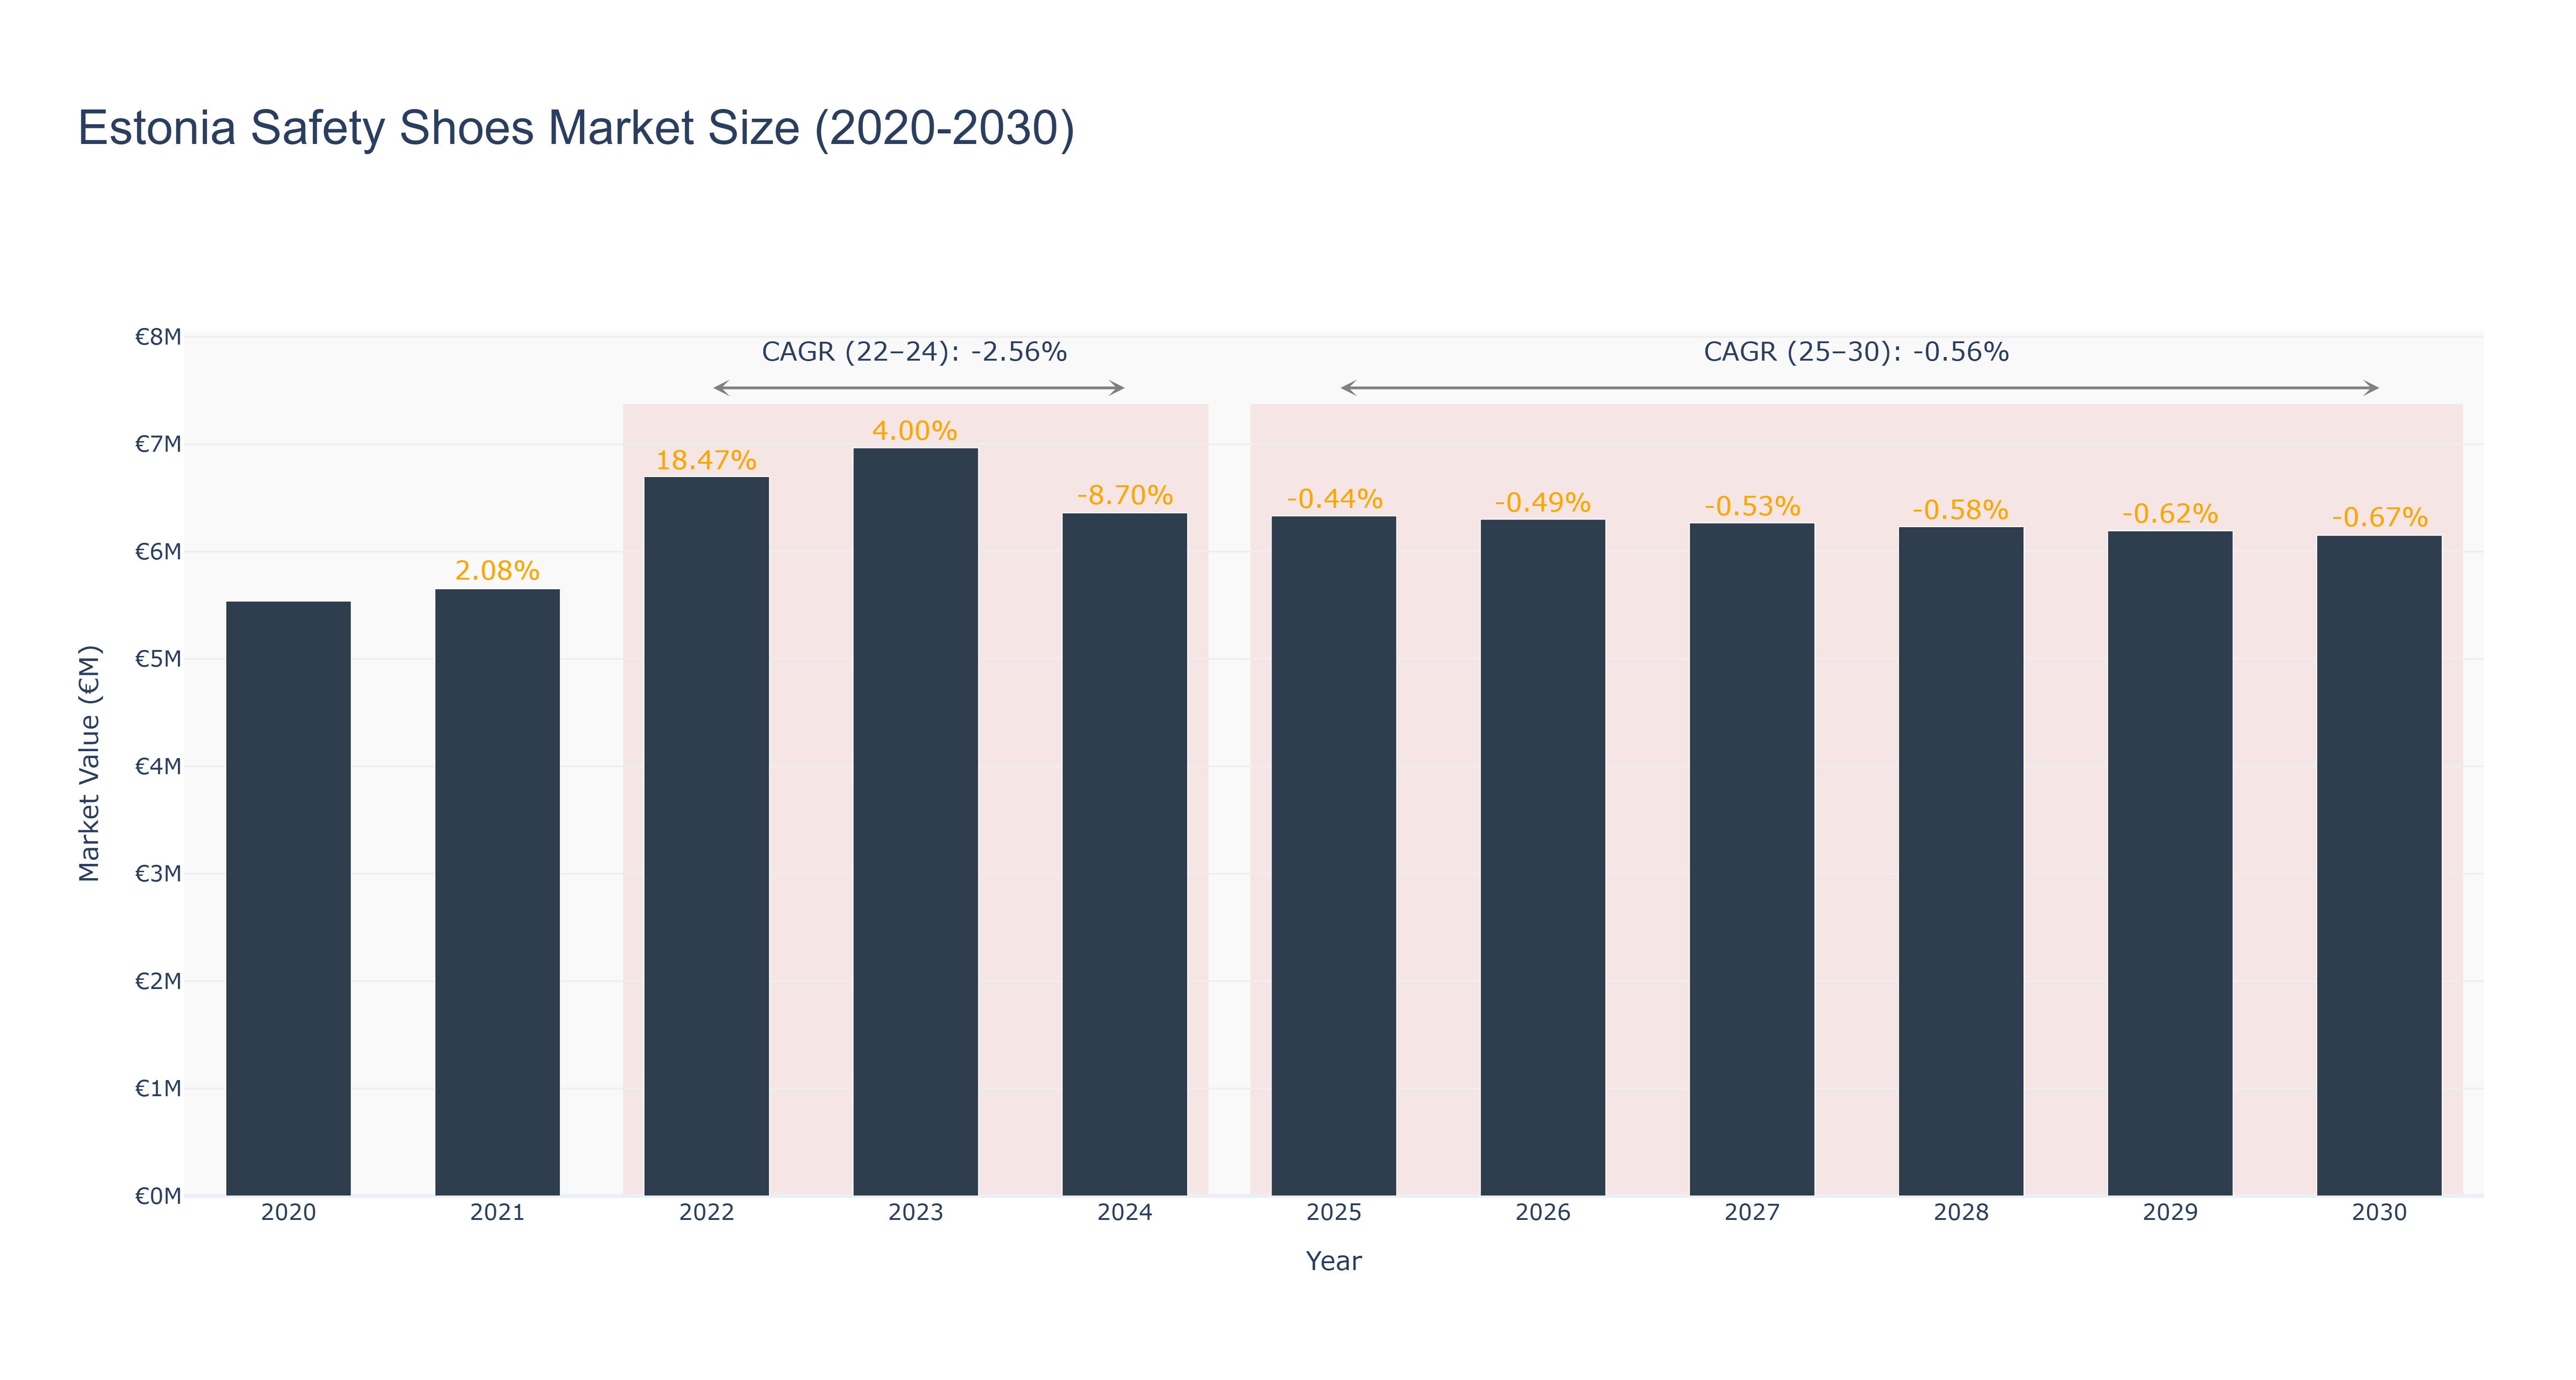
The Estonia Safety Shoes Market has seen fluctuations in market size over the years. The peak market size was €6.97 million in 2023, followed by a decline to €6.36 million in 2024. The market is forecasted to continue decreasing gradually, with a projected size of €6.15 million in 2030. The CAGR for the period 2022-24 was -2.56%, while for 2025-30, it is expected to be -0.56%. The downward trend in market size can be attributed to factors such as economic slowdown and changing consumer preferences. However, recent developments indicate a shift towards sustainable and innovative safety shoe designs, which could potentially drive market growth in the future. Keep an eye out for upcoming collaborations between local manufacturers and international brands to enhance product offerings and expand market reach.
Estonia Safety Shoes Market: Production & Trade Performance (2019-2025)
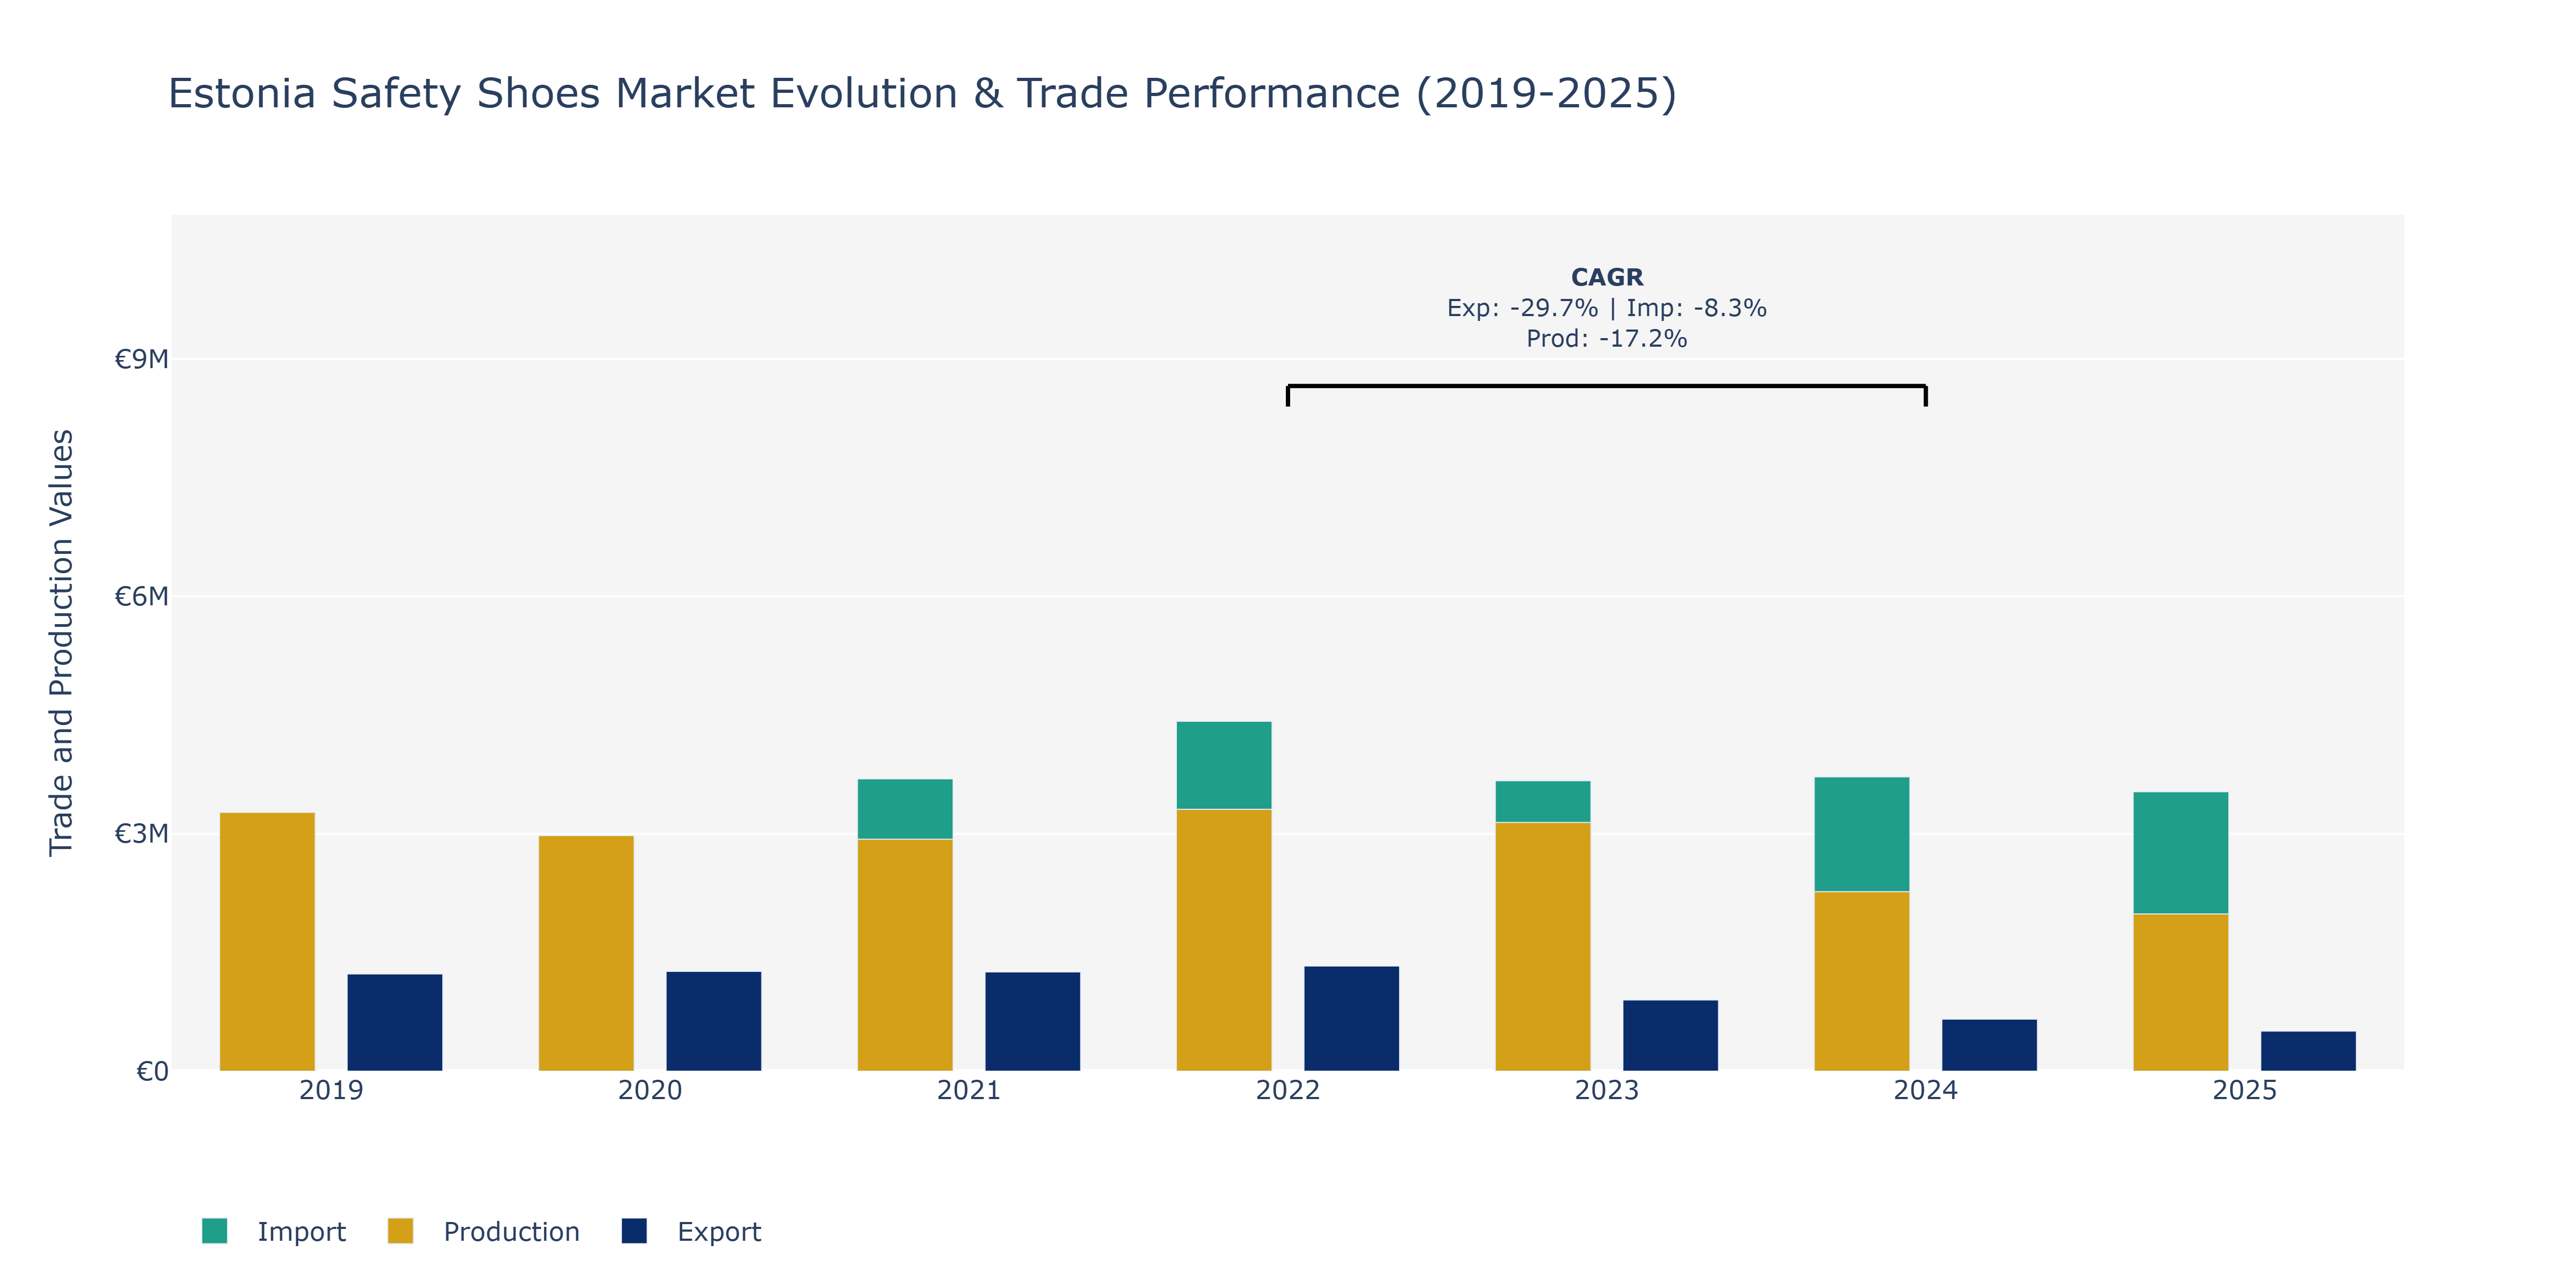
Between 2019 and 2025, the Estonia Safety Shoes Market witnessed varying trends in Exports, Imports, and Production. In 2019, production reached €3.27 billion, showing a gradual decline over the years to €1.99 billion in 2025. Exports peaked at €1.32 billion in 2022 but then decreased to €0.51 billion in 2025. Import value fluctuated, with a peak of €4.42 billion in 2022 and a decrease to €3.53 billion in 2025. The decline in production can be attributed to changing consumer preferences towards other types of footwear or technological advancements leading to more durable shoes. The fluctuating export and import figures may be influenced by global economic conditions impacting trade agreements or shifts in demand from Estonian manufacturers. To sustain market competitiveness, stakeholders could focus on innovation, quality improvements, and diversifying export markets.
Key Highlights of the Report:
- Estonia Safety Shoes Market Outlook
- Market Size of Estonia Safety Shoes Market, 2025
- Forecast of Estonia Safety Shoes Market, 2032
- Historical Data and Forecast of Estonia Safety Shoes Revenues & Volume for the Period 2022 - 2032F
- Estonia Safety Shoes Market Trend Evolution
- Estonia Safety Shoes Market Drivers and Challenges
- Estonia Safety Shoes Price Trends
- Estonia Safety Shoes Porter`s Five Forces
- Estonia Safety Shoes Industry Life Cycle
- Historical Data and Forecast of Estonia Safety Shoes Market Revenues & Volume By Type for the Period 2022 - 2032F
- Historical Data and Forecast of Estonia Safety Shoes Market Revenues & Volume By Leather for the Period 2022 - 2032F
- Historical Data and Forecast of Estonia Safety Shoes Market Revenues & Volume By Rubber for the Period 2022 - 2032F
- Historical Data and Forecast of Estonia Safety Shoes Market Revenues & Volume By Pvc for the Period 2022 - 2032F
- Historical Data and Forecast of Estonia Safety Shoes Market Revenues & Volume By Polyurethane for the Period 2022 - 2032F
- Historical Data and Forecast of Estonia Safety Shoes Market Revenues & Volume By Others for the Period 2022 - 2032F
- Historical Data and Forecast of Estonia Safety Shoes Market Revenues & Volume By Application for the Period 2022 - 2032F
- Historical Data and Forecast of Estonia Safety Shoes Market Revenues & Volume By Construction for the Period 2022 - 2032F
- Historical Data and Forecast of Estonia Safety Shoes Market Revenues & Volume By Manufacturing for the Period 2022 - 2032F
- Historical Data and Forecast of Estonia Safety Shoes Market Revenues & Volume By Mining for the Period 2022 - 2032F
- Historical Data and Forecast of Estonia Safety Shoes Market Revenues & Volume By Transportation for the Period 2022 - 2032F
- Historical Data and Forecast of Estonia Safety Shoes Market Revenues & Volume By Others for the Period 2022 - 2032F
- Historical Data and Forecast of Estonia Safety Shoes Market Revenues & Volume By Distribution Channel for the Period 2022 - 2032F
- Historical Data and Forecast of Estonia Safety Shoes Market Revenues & Volume By Online for the Period 2022 - 2032F
- Historical Data and Forecast of Estonia Safety Shoes Market Revenues & Volume By Offline for the Period 2022 - 2032F
- Estonia Safety Shoes Import Export Trade Statistics
- Market Opportunity Assessment By Type
- Market Opportunity Assessment By Application
- Market Opportunity Assessment By Distribution Channel
- Estonia Safety Shoes Top Companies Market Share
- Estonia Safety Shoes Competitive Benchmarking By Technical and Operational Parameters
- Estonia Safety Shoes Company Profiles
- Estonia Safety Shoes Key Strategic Recommendations
Frequently Asked Questions About the Market Study (FAQs):
6Wresearch actively monitors the Estonia Safety Shoes Market and publishes its comprehensive annual report, highlighting emerging trends, growth drivers, revenue analysis, and forecast outlook. Our insights help businesses to make data-backed strategic decisions with ongoing market dynamics. Our analysts track relevent industries related to the Estonia Safety Shoes Market, allowing our clients with actionable intelligence and reliable forecasts tailored to emerging regional needs.
Yes, we provide customisation as per your requirements. To learn more, feel free to contact us on sales@6wresearch.com
1 Executive Summary |
2 Introduction |
2.1 Key Highlights of the Report |
2.2 Report Description |
2.3 Market Scope & Segmentation |
2.4 Research Methodology |
2.5 Assumptions |
3 Estonia Safety Shoes Market Overview |
3.1 Estonia Country Macro Economic Indicators |
3.2 Estonia Safety Shoes Market Revenues & Volume, 2022 & 2032F |
3.3 Estonia Safety Shoes Market - Industry Life Cycle |
3.4 Estonia Safety Shoes Market - Porter's Five Forces |
3.5 Estonia Safety Shoes Market Revenues & Volume Share, By Type, 2022 & 2032F |
3.6 Estonia Safety Shoes Market Revenues & Volume Share, By Application, 2022 & 2032F |
3.7 Estonia Safety Shoes Market Revenues & Volume Share, By Distribution Channel, 2022 & 2032F |
4 Estonia Safety Shoes Market Dynamics |
4.1 Impact Analysis |
4.2 Market Drivers |
4.2.1 Stringent safety regulations in industries requiring safety shoes |
4.2.2 Increasing awareness about workplace safety among employers and employees |
4.2.3 Growing emphasis on employee well-being and occupational health |
4.3 Market Restraints |
4.3.1 High initial cost of purchasing safety shoes |
4.3.2 Limited availability of specialized safety shoe retailers |
4.3.3 Economic downturn impacting industrial activities |
5 Estonia Safety Shoes Market Trends |
6 Estonia Safety Shoes Market Segmentations |
6.1 Estonia Safety Shoes Market, By Type |
6.1.1 Overview and Analysis |
6.1.2 Estonia Safety Shoes Market Revenues & Volume, By Leather, 2022 - 2032F |
6.1.3 Estonia Safety Shoes Market Revenues & Volume, By Rubber, 2022 - 2032F |
6.1.4 Estonia Safety Shoes Market Revenues & Volume, By Pvc, 2022 - 2032F |
6.1.5 Estonia Safety Shoes Market Revenues & Volume, By Polyurethane, 2022 - 2032F |
6.1.6 Estonia Safety Shoes Market Revenues & Volume, By Others, 2022 - 2032F |
6.2 Estonia Safety Shoes Market, By Application |
6.2.1 Overview and Analysis |
6.2.2 Estonia Safety Shoes Market Revenues & Volume, By Construction, 2022 - 2032F |
6.2.3 Estonia Safety Shoes Market Revenues & Volume, By Manufacturing, 2022 - 2032F |
6.2.4 Estonia Safety Shoes Market Revenues & Volume, By Mining, 2022 - 2032F |
6.2.5 Estonia Safety Shoes Market Revenues & Volume, By Transportation, 2022 - 2032F |
6.2.6 Estonia Safety Shoes Market Revenues & Volume, By Others, 2022 - 2032F |
6.3 Estonia Safety Shoes Market, By Distribution Channel |
6.3.1 Overview and Analysis |
6.3.2 Estonia Safety Shoes Market Revenues & Volume, By Online, 2022 - 2032F |
6.3.3 Estonia Safety Shoes Market Revenues & Volume, By Offline, 2022 - 2032F |
7 Estonia Safety Shoes Market Import-Export Trade Statistics |
7.1 Estonia Safety Shoes Market Export to Major Countries |
7.2 Estonia Safety Shoes Market Imports from Major Countries |
8 Estonia Safety Shoes Market Key Performance Indicators |
8.1 Number of workplace accidents reported annually |
8.2 Percentage of companies implementing safety programs |
8.3 Compliance rate with safety regulations in high-risk industries |
8.4 Number of safety shoe certifications achieved by manufacturers |
8.5 Employee satisfaction surveys on workplace safety measures |
9 Estonia Safety Shoes Market - Opportunity Assessment |
9.1 Estonia Safety Shoes Market Opportunity Assessment, By Type, 2022 & 2032F |
9.2 Estonia Safety Shoes Market Opportunity Assessment, By Application, 2022 & 2032F |
9.3 Estonia Safety Shoes Market Opportunity Assessment, By Distribution Channel, 2022 & 2032F |
10 Estonia Safety Shoes Market - Competitive Landscape |
10.1 Estonia Safety Shoes Market Revenue Share, By Companies, 2025 |
10.2 Estonia Safety Shoes Market Competitive Benchmarking, By Operating and Technical Parameters |
11 Company Profiles |
12 Recommendations | 13 Disclaimer |
Global Go To Market Strategy - 2030
Export potential enables firms to identify high-growth global markets with greater confidence by combining advanced trade intelligence with a structured quantitative methodology. The framework analyzes emerging demand trends and country-level import patterns while integrating macroeconomic and trade datasets such as GDP and population forecasts, bilateral import–export flows, tariff structures, elasticity differentials between developed and developing economies, geographic distance, and import demand projections. Using weighted trade values from 2020–2024 as the base period to project country-to-country export potential for 2030, these inputs are operationalized through calculated drivers such as gravity model parameters, tariff impact factors, and projected GDP per-capita growth. Through an analysis of hidden potentials, demand hotspots, and market conditions that are most favorable to success, this method enables firms to focus on target countries, maximize returns, and global expansion with data, backed by accuracy.
By factoring in the projected importer demand gap that is currently unmet and could be potential opportunity, it identifies the potential for the Exporter (Country) among 190 countries, against the general trade analysis, which identifies the biggest importer or exporter.
To discover high-growth global markets and optimize your business strategy:
Click Here
Pricing
- Single User License$ 1,995
- Department License$ 2,400
- Site License$ 3,120
- Global License$ 3,795

Leadership Perspectives from Industry Events
Search
Thought Leadership and Analyst Meet


Our Clients
6WResearch In News
- India Export Attractiveness Tracker 2026
- India Air Conditioner Market Set for Strong Rebound in 2026 After Weather-Led Correction and GST-Driven Recovery: 6Wresearch
- ADAS in India: How Automatic Emergency Braking, Blind Spot Detection & Driver Monitoring are Transforming Road Safety
- Doha a strategic location for EV manufacturing hub: IPA Qatar
- Demand for luxury TVs surging in the GCC, says Samsung
- Empowering Growth: The Thriving Journey of Bangladesh’s Cable Industry
Latest Reports
- Nicaragua RPG Gaming Market (2026-2032)
- New Zealand RPG Gaming Market (2026-2032)
- Netherlands RPG Gaming Market (2026-2032)
- Nauru RPG Gaming Market (2026-2032)
- Namibia RPG Gaming Market (2026-2032)
- Mozambique RPG Gaming Market (2026-2032)
- Montenegro RPG Gaming Market (2026-2032)
- Mongolia RPG Gaming Market (2026-2032)
- Monaco RPG Gaming Market (2026-2032)
- Micronesia RPG Gaming Market (2026-2032)
Industry Events and Analyst Meet

EV India Expo 2026

HIMTEX 2026

India Refining Summit 2026

India EV Show 2026

EV tech India Expo 2026
Whitepaper
- Middle East & Africa Commercial Security Market Click here to view more.
- Middle East & Africa Fire Safety Systems & Equipment Market Click here to view more.
- GCC Drone Market Click here to view more.
- Middle East Lighting Fixture Market Click here to view more.
- GCC Physical & Perimeter Security Market Click here to view more.