Estonia Utility Poles Market (2025-2031) | Trends, Segmentation, Analysis, Companies, Outlook, Size, Industry, Value, Revenue, Forecast, Share & Growth
Market Forecast By Type (Transmission Poles, Distribution Poles), By Material (Concrete, Wood, Steel, Composites), By Pole Size (Below 40ft, Between 40 & 70ft, Above 70ft), By Application (Electricity Transmission & Distribution, Telecommunication, Street Lighting, Heavy Power Lines, Subtransmission Lines, Others) And Competitive Landscape
| Product Code: ETC4754383 | Publication Date: Nov 2023 | Updated Date: Apr 2026 | Product Type: Market Research Report | |
| Publisher: 6Wresearch | Author: Sachin Kumar Rai | No. of Pages: 60 | No. of Figures: 30 | No. of Tables: 5 |
Estonia Utility Poles Market Size (2020-2030)
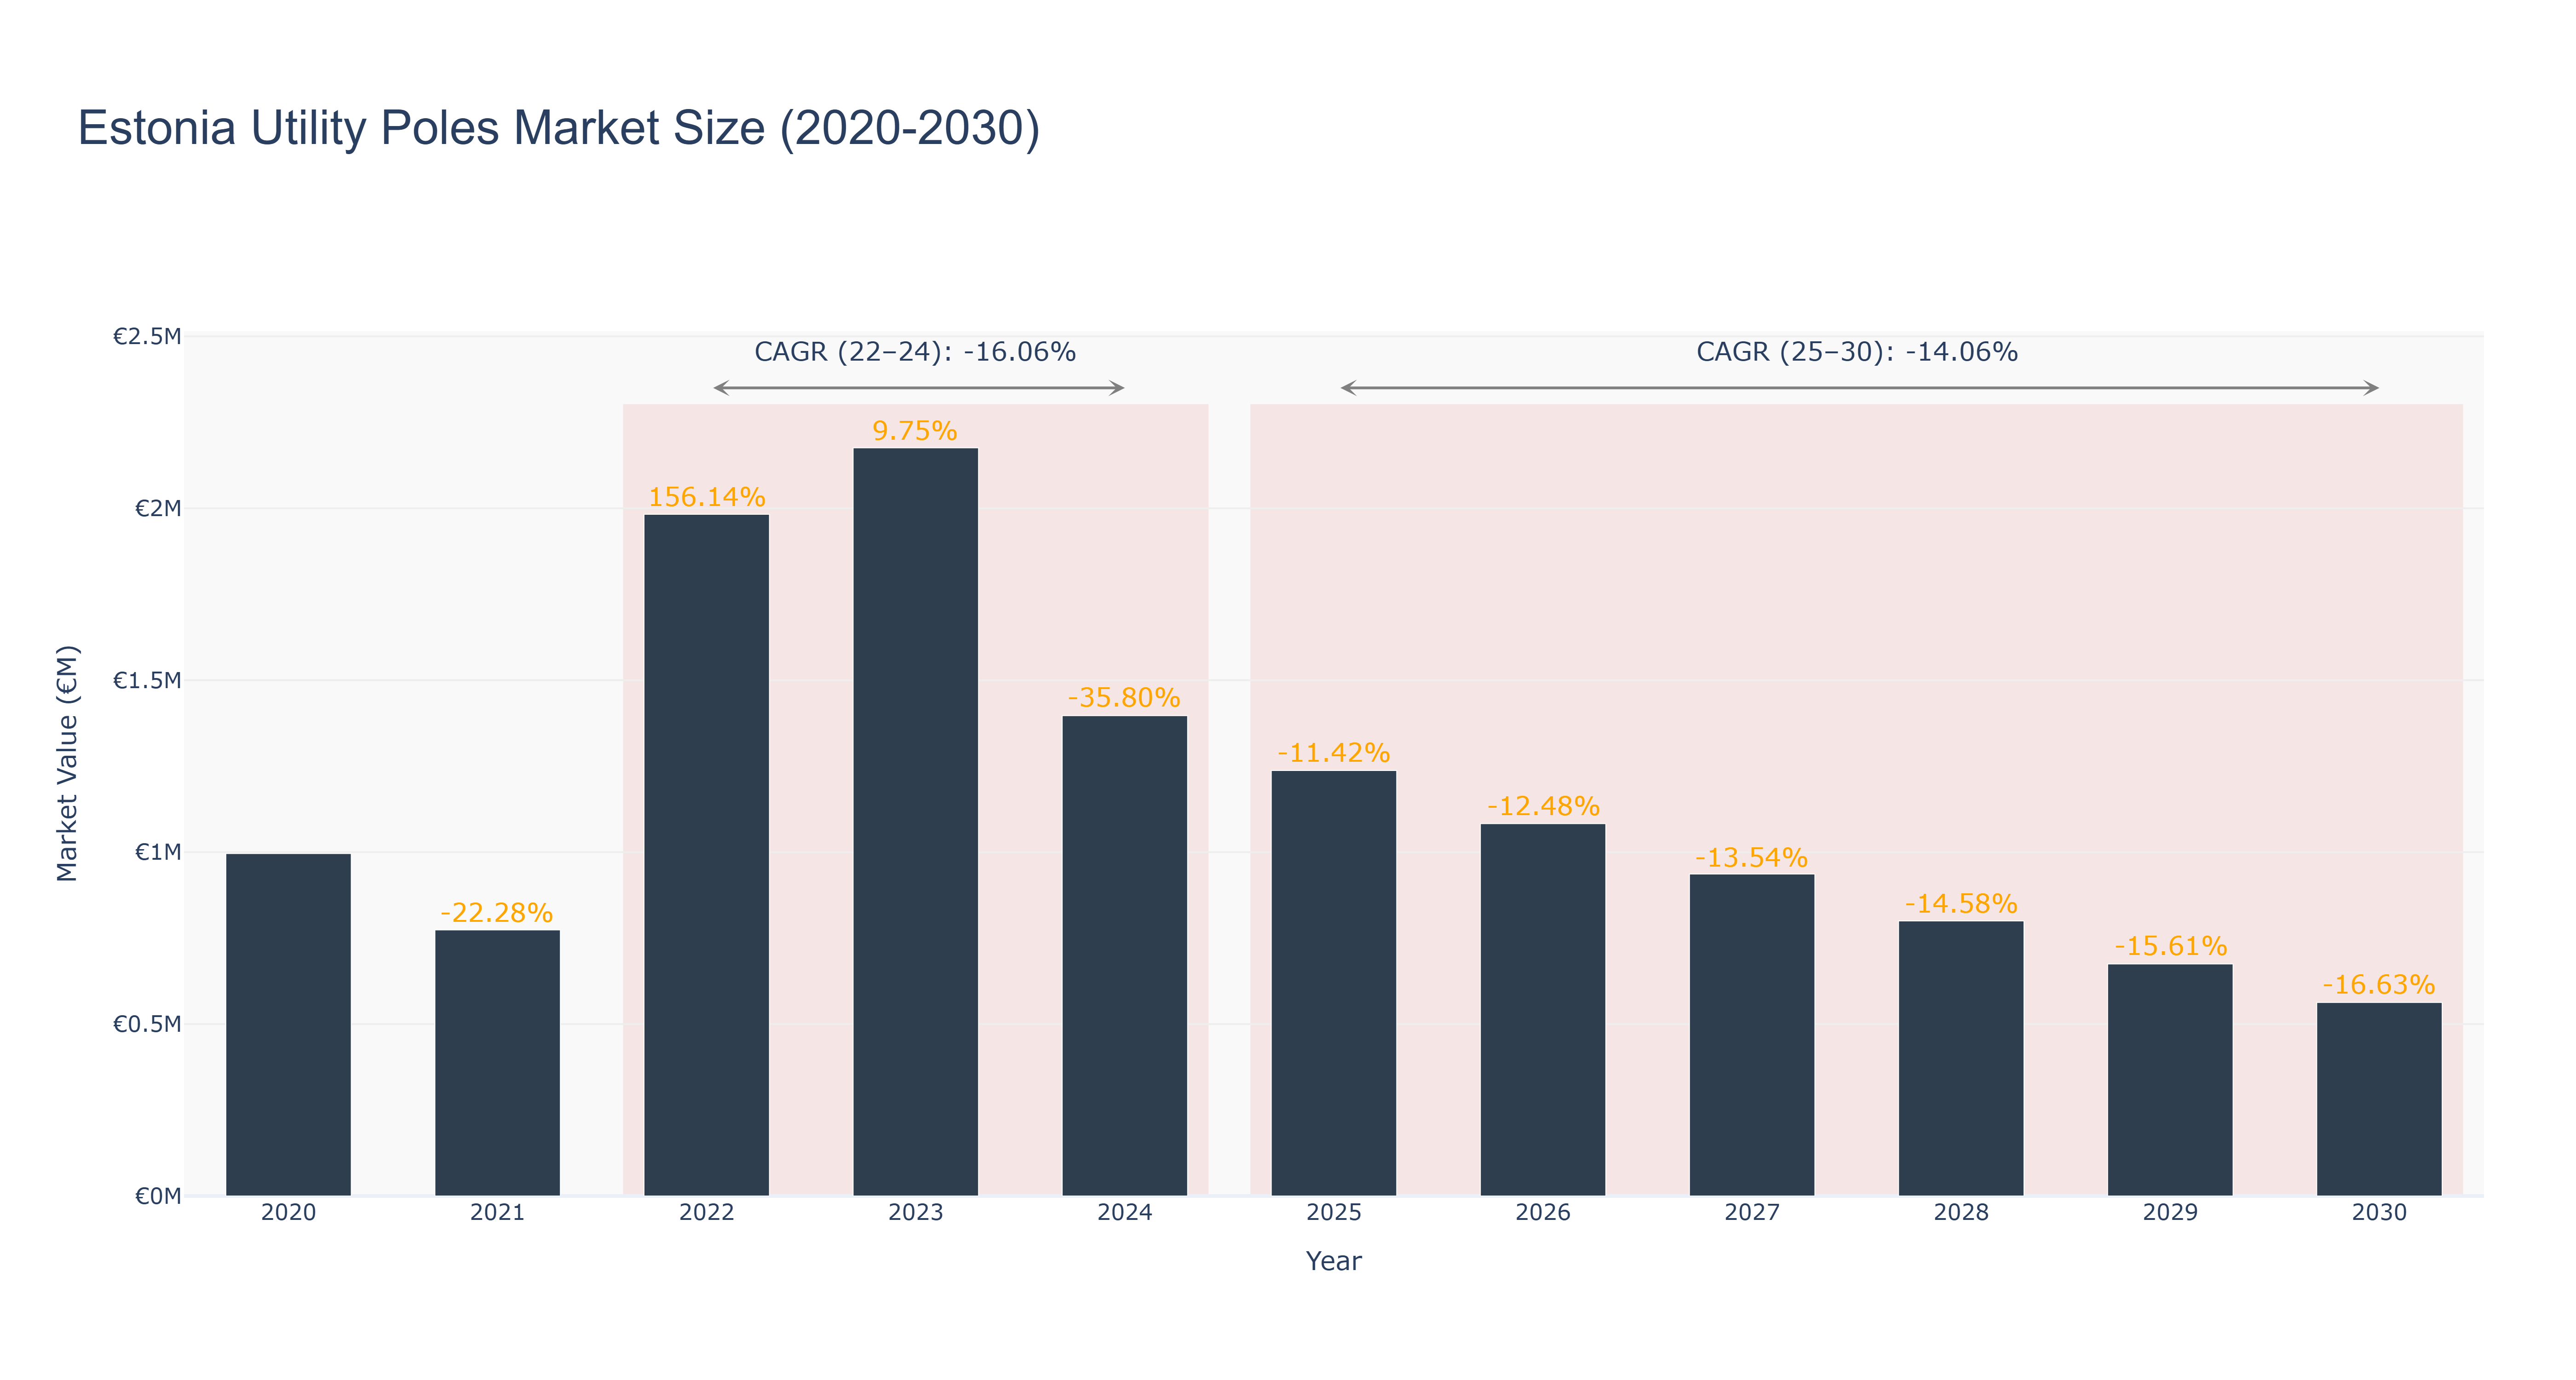
The Estonia Utility Poles Market experienced a peak market size of €2.18 million in 2023, followed by a decline to €1.40 million in 2024. The market continued to shrink to €1.08 million in 2026, with a negative CAGR of -12.48% from 2020 to 2026. The forecasted market size is expected to further decrease to €0.56 million by 2030, with a CAGR of -14.06% from 2025 to 2030. The downward trend can be attributed to factors such as reduced infrastructure spending and technological advancements impacting traditional utility poles demand. Looking ahead, Estonia is set to embark on a national initiative to modernize its utility pole network, focusing on sustainability and efficiency, which could potentially reshape the market landscape in the coming years.
Estonia Utility Poles Market: Production & Trade Performance (2019-2025)
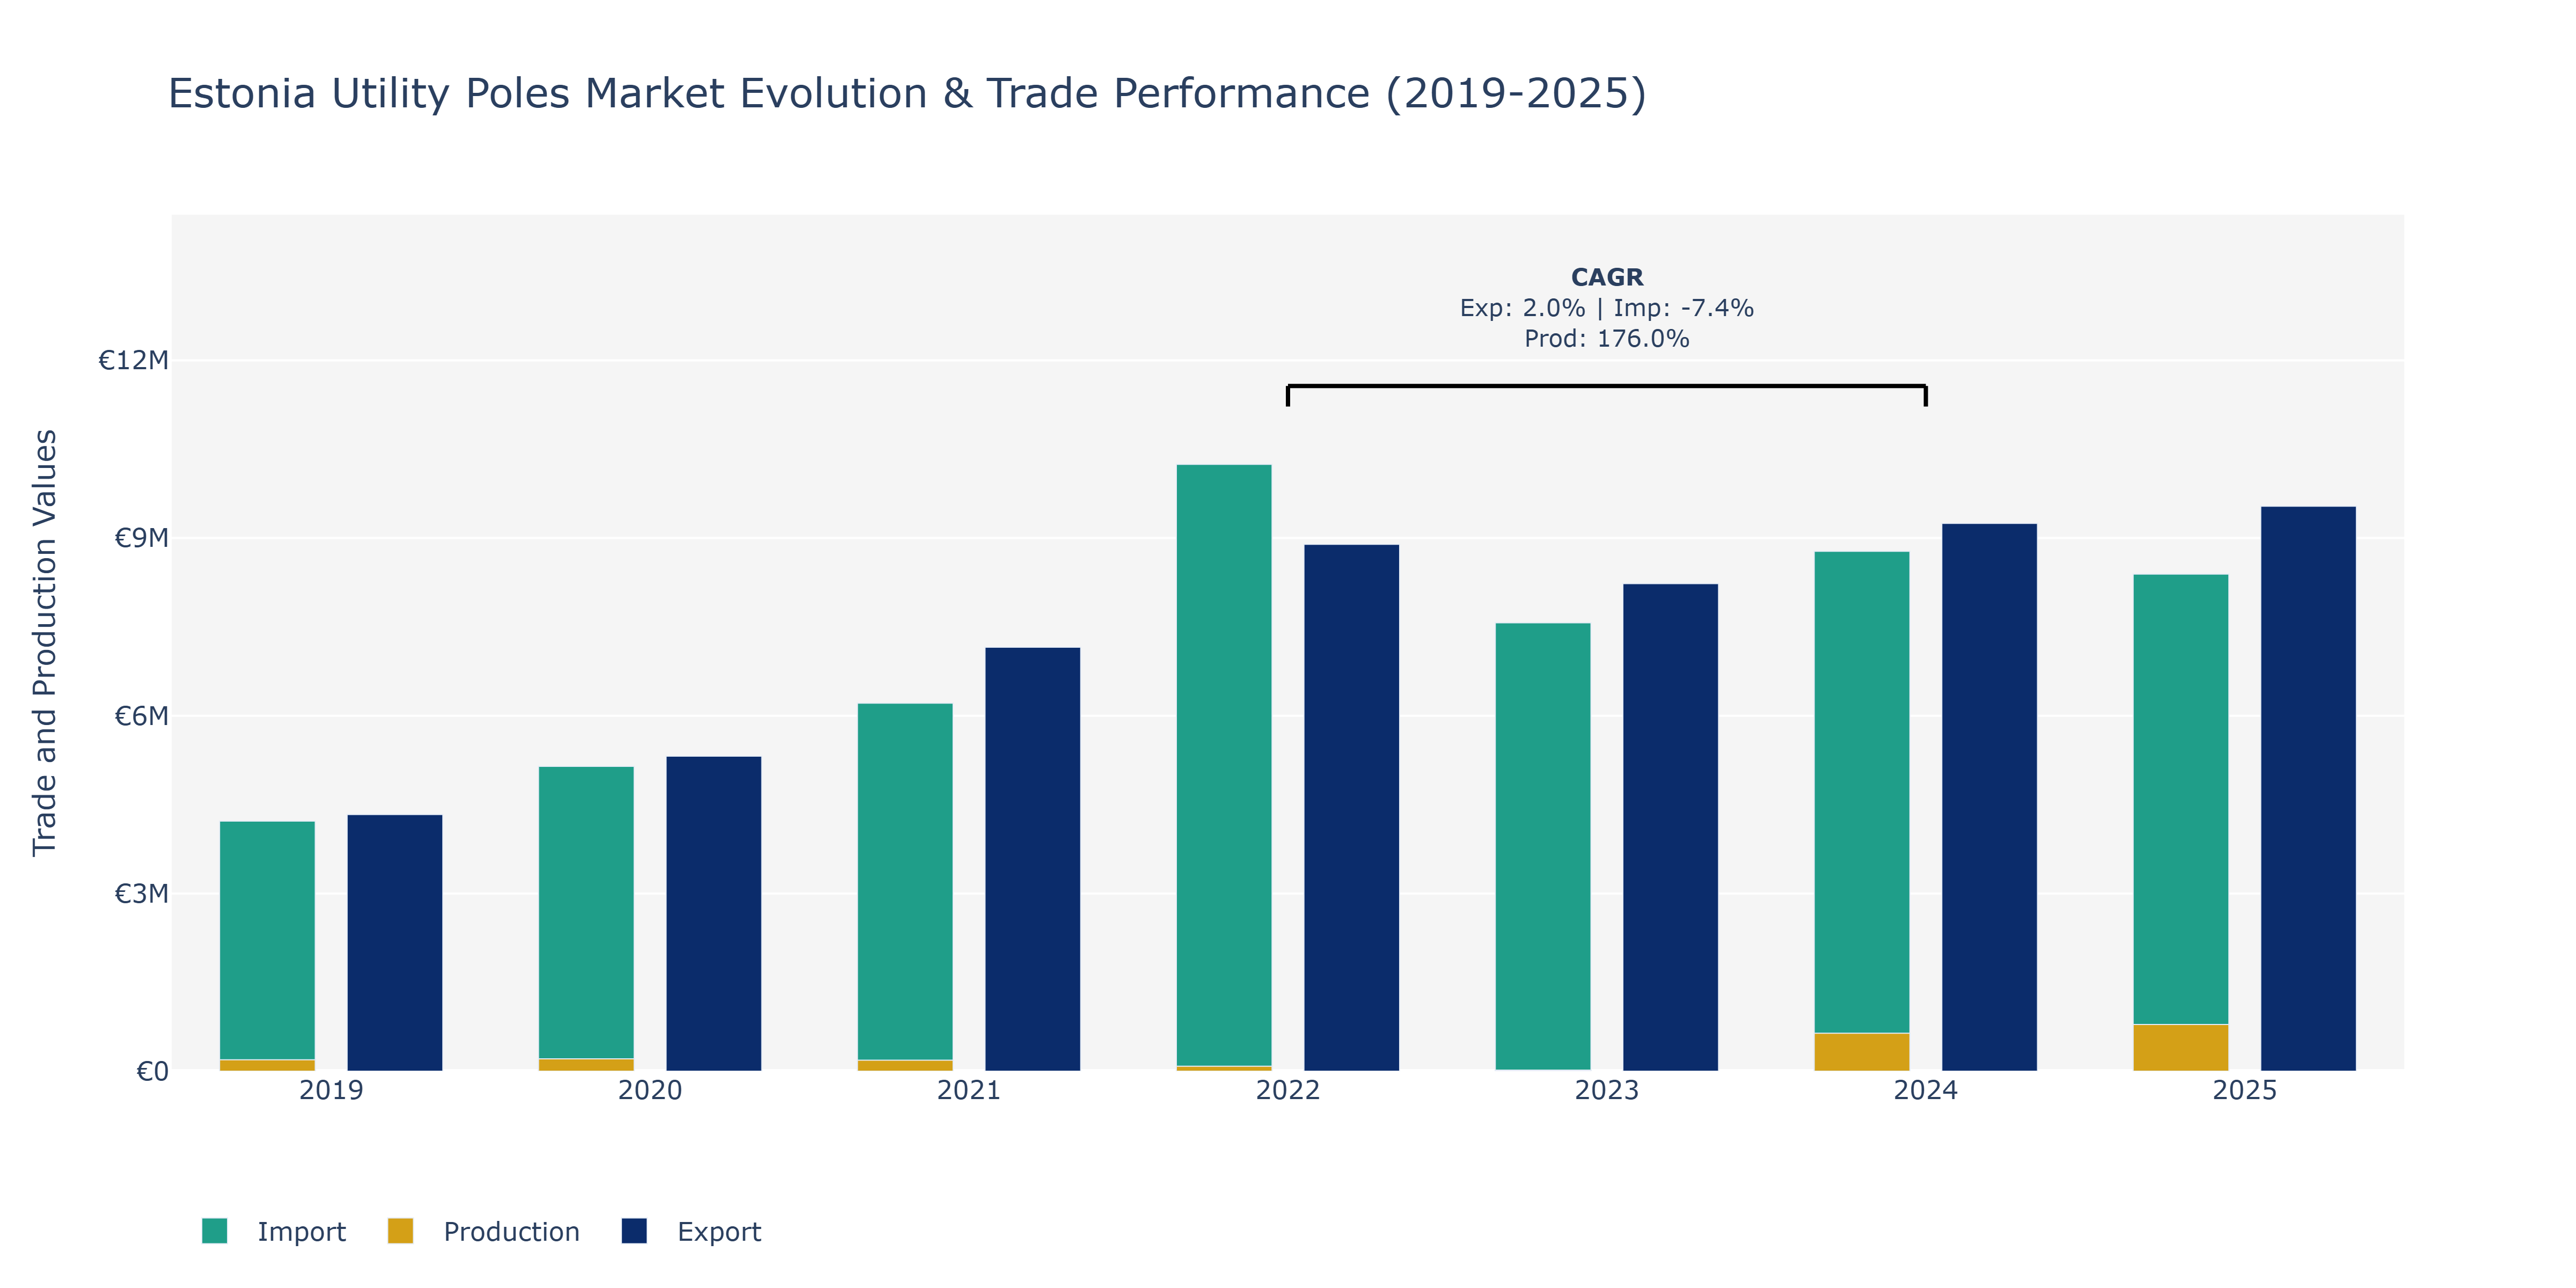
In the Estonia Utility Poles Market, from 2019 to 2025, exports demonstrated an upward trajectory, increasing from €4.33 million to €9.54 million, with notable peaks in 2024 and 2025. Imports followed a similar trend, rising from €4.22 million to €8.39 million, peaking in 2025. Production, however, fluctuated significantly, decreasing sharply in 2023 to €17 million but rebounding to €789 million in 2025, showing exceptional growth with a CAGR of 176.03% from 2022 to 2024. These fluctuations can be attributed to various factors such as changing demand in the construction sector, infrastructure development projects, and advancements in the utility pole manufacturing process. The rise in exports and imports could be linked to increasing infrastructure projects in Estonia and neighboring regions, boosting the demand for utility poles. To maintain this growth trajectory, market players should focus on sustainable sourcing practices and technological innovations in production processes to meet the evolving demands of the utility poles market.
Estonia Utility Poles Market Overview
The Utility Poles market in Estonia is linked to the growth of infrastructure development, particularly in the energy and telecommunications sectors. Utility poles are crucial for supporting overhead power lines and communication networks, and their demand is driven by the ongoing expansion and modernization of utility services. With Estonia`s continued focus on digital and energy infrastructure, the market for utility poles is expected to grow, with a shift towards more durable and sustainable materials. The growth in renewable energy projects, including wind and solar farms, is also influencing the market dynamics.
Drivers of the market
The Estonia Utility Poles market is influenced by the rising demand for electricity distribution and the expansion of telecommunication networks. The shift toward renewable energy integration and the replacement of aging infrastructure support market growth.
Challenges of the market
The Estonia Utility Poles Market contends with issues such as aging infrastructure, material sustainability, and cost management. Many existing utility poles require replacement or reinforcement, creating a high demand for investment in maintenance. The shift toward sustainable and composite materials to replace traditional wood poles involves higher production costs, impacting market pricing. Additionally, maintaining cost-efficiency in remote and rural installations poses logistical challenges.
Government Policy of the market
Estonia supports the utility poles market through policies that ensure the efficient development, maintenance, and replacement of infrastructure for electrical, telecommunications, and other utility networks. The government prioritizes sustainability in the materials used for utility poles, promoting the use of environmentally friendly and durable materials. Policies also encourage the adoption of smart poles that incorporate sensors and communication technologies for better infrastructure monitoring and management, aligning with Estonias focus on smart city development.
Key Highlights of the Report:
- Estonia Utility Poles Market Outlook
- Market Size of Estonia Utility Poles Market, 2024
- Forecast of Estonia Utility Poles Market, 2031
- Historical Data and Forecast of Estonia Utility Poles Revenues & Volume for the Period 2021-2031
- Estonia Utility Poles Market Trend Evolution
- Estonia Utility Poles Market Drivers and Challenges
- Estonia Utility Poles Price Trends
- Estonia Utility Poles Porter`s Five Forces
- Estonia Utility Poles Industry Life Cycle
- Historical Data and Forecast of Estonia Utility Poles Market Revenues & Volume By Type for the Period 2021-2031
- Historical Data and Forecast of Estonia Utility Poles Market Revenues & Volume By Transmission Poles for the Period 2021-2031
- Historical Data and Forecast of Estonia Utility Poles Market Revenues & Volume By Distribution Poles for the Period 2021-2031
- Historical Data and Forecast of Estonia Utility Poles Market Revenues & Volume By Material for the Period 2021-2031
- Historical Data and Forecast of Estonia Utility Poles Market Revenues & Volume By Concrete for the Period 2021-2031
- Historical Data and Forecast of Estonia Utility Poles Market Revenues & Volume By Wood for the Period 2021-2031
- Historical Data and Forecast of Estonia Utility Poles Market Revenues & Volume By Steel for the Period 2021-2031
- Historical Data and Forecast of Estonia Utility Poles Market Revenues & Volume By Composites for the Period 2021-2031
- Historical Data and Forecast of Estonia Utility Poles Market Revenues & Volume By Pole Size for the Period 2021-2031
- Historical Data and Forecast of Estonia Utility Poles Market Revenues & Volume By Below 40ft for the Period 2021-2031
- Historical Data and Forecast of Estonia Utility Poles Market Revenues & Volume By Between 40 & 70ft for the Period 2021-2031
- Historical Data and Forecast of Estonia Utility Poles Market Revenues & Volume By Above 70ft for the Period 2021-2031
- Historical Data and Forecast of Estonia Utility Poles Market Revenues & Volume By Application for the Period 2021-2031
- Historical Data and Forecast of Estonia Utility Poles Market Revenues & Volume By Electricity Transmission & Distribution for the Period 2021-2031
- Historical Data and Forecast of Estonia Utility Poles Market Revenues & Volume By Telecommunication for the Period 2021-2031
- Historical Data and Forecast of Estonia Utility Poles Market Revenues & Volume By Street Lighting for the Period 2021-2031
- Historical Data and Forecast of Estonia Utility Poles Market Revenues & Volume By Heavy Power Lines for the Period 2021-2031
- Historical Data and Forecast of Estonia Utility Poles Market Revenues & Volume By Subtransmission Lines for the Period 2021-2031
- Historical Data and Forecast of Estonia Utility Poles Market Revenues & Volume By Others for the Period 2021-2031
- Estonia Utility Poles Import Export Trade Statistics
- Market Opportunity Assessment By Type
- Market Opportunity Assessment By Material
- Market Opportunity Assessment By Pole Size
- Market Opportunity Assessment By Application
- Estonia Utility Poles Top Companies Market Share
- Estonia Utility Poles Competitive Benchmarking By Technical and Operational Parameters
- Estonia Utility Poles Company Profiles
- Estonia Utility Poles Key Strategic Recommendations
Frequently Asked Questions About the Market Study (FAQs):
6Wresearch actively monitors the Estonia Utility Poles Market and publishes its comprehensive annual report, highlighting emerging trends, growth drivers, revenue analysis, and forecast outlook. Our insights help businesses to make data-backed strategic decisions with ongoing market dynamics. Our analysts track relevent industries related to the Estonia Utility Poles Market, allowing our clients with actionable intelligence and reliable forecasts tailored to emerging regional needs.
Yes, we provide customisation as per your requirements. To learn more, feel free to contact us on sales@6wresearch.com
1 Executive Summary |
2 Introduction |
2.1 Key Highlights of the Report |
2.2 Report Description |
2.3 Market Scope & Segmentation |
2.4 Research Methodology |
2.5 Assumptions |
3 Estonia Utility Poles Market Overview |
3.1 Estonia Country Macro Economic Indicators |
3.2 Estonia Utility Poles Market Revenues & Volume, 2021 & 2031F |
3.3 Estonia Utility Poles Market - Industry Life Cycle |
3.4 Estonia Utility Poles Market - Porter's Five Forces |
3.5 Estonia Utility Poles Market Revenues & Volume Share, By Type, 2021 & 2031F |
3.6 Estonia Utility Poles Market Revenues & Volume Share, By Material, 2021 & 2031F |
3.7 Estonia Utility Poles Market Revenues & Volume Share, By Pole Size, 2021 & 2031F |
3.8 Estonia Utility Poles Market Revenues & Volume Share, By Application, 2021 & 2031F |
4 Estonia Utility Poles Market Dynamics |
4.1 Impact Analysis |
4.2 Market Drivers |
4.3 Market Restraints |
5 Estonia Utility Poles Market Trends |
6 Estonia Utility Poles Market Segmentations |
6.1 Estonia Utility Poles Market, By Type |
6.1.1 Overview and Analysis |
6.1.2 Estonia Utility Poles Market Revenues & Volume, By Transmission Poles, 2021-2031F |
6.1.3 Estonia Utility Poles Market Revenues & Volume, By Distribution Poles, 2021-2031F |
6.2 Estonia Utility Poles Market, By Material |
6.2.1 Overview and Analysis |
6.2.2 Estonia Utility Poles Market Revenues & Volume, By Concrete, 2021-2031F |
6.2.3 Estonia Utility Poles Market Revenues & Volume, By Wood, 2021-2031F |
6.2.4 Estonia Utility Poles Market Revenues & Volume, By Steel, 2021-2031F |
6.2.5 Estonia Utility Poles Market Revenues & Volume, By Composites, 2021-2031F |
6.3 Estonia Utility Poles Market, By Pole Size |
6.3.1 Overview and Analysis |
6.3.2 Estonia Utility Poles Market Revenues & Volume, By Below 40ft, 2021-2031F |
6.3.3 Estonia Utility Poles Market Revenues & Volume, By Between 40 & 70ft, 2021-2031F |
6.3.4 Estonia Utility Poles Market Revenues & Volume, By Above 70ft, 2021-2031F |
6.4 Estonia Utility Poles Market, By Application |
6.4.1 Overview and Analysis |
6.4.2 Estonia Utility Poles Market Revenues & Volume, By Electricity Transmission & Distribution, 2021-2031F |
6.4.3 Estonia Utility Poles Market Revenues & Volume, By Telecommunication, 2021-2031F |
6.4.4 Estonia Utility Poles Market Revenues & Volume, By Street Lighting, 2021-2031F |
6.4.5 Estonia Utility Poles Market Revenues & Volume, By Heavy Power Lines, 2021-2031F |
6.4.6 Estonia Utility Poles Market Revenues & Volume, By Subtransmission Lines, 2021-2031F |
6.4.7 Estonia Utility Poles Market Revenues & Volume, By Others, 2021-2031F |
7 Estonia Utility Poles Market Import-Export Trade Statistics |
7.1 Estonia Utility Poles Market Export to Major Countries |
7.2 Estonia Utility Poles Market Imports from Major Countries |
8 Estonia Utility Poles Market Key Performance Indicators |
9 Estonia Utility Poles Market - Opportunity Assessment |
9.1 Estonia Utility Poles Market Opportunity Assessment, By Type, 2021 & 2031F |
9.2 Estonia Utility Poles Market Opportunity Assessment, By Material, 2021 & 2031F |
9.3 Estonia Utility Poles Market Opportunity Assessment, By Pole Size, 2021 & 2031F |
9.4 Estonia Utility Poles Market Opportunity Assessment, By Application, 2021 & 2031F |
10 Estonia Utility Poles Market - Competitive Landscape |
10.1 Estonia Utility Poles Market Revenue Share, By Companies, 2024 |
10.2 Estonia Utility Poles Market Competitive Benchmarking, By Operating and Technical Parameters |
11 Company Profiles |
12 Recommendations | 13 Disclaimer |
Global Go To Market Strategy - 2030
Export potential enables firms to identify high-growth global markets with greater confidence by combining advanced trade intelligence with a structured quantitative methodology. The framework analyzes emerging demand trends and country-level import patterns while integrating macroeconomic and trade datasets such as GDP and population forecasts, bilateral import–export flows, tariff structures, elasticity differentials between developed and developing economies, geographic distance, and import demand projections. Using weighted trade values from 2020–2024 as the base period to project country-to-country export potential for 2030, these inputs are operationalized through calculated drivers such as gravity model parameters, tariff impact factors, and projected GDP per-capita growth. Through an analysis of hidden potentials, demand hotspots, and market conditions that are most favorable to success, this method enables firms to focus on target countries, maximize returns, and global expansion with data, backed by accuracy.
By factoring in the projected importer demand gap that is currently unmet and could be potential opportunity, it identifies the potential for the Exporter (Country) among 190 countries, against the general trade analysis, which identifies the biggest importer or exporter.
To discover high-growth global markets and optimize your business strategy:
Click Here
Pricing
- Single User License$ 1,995
- Department License$ 2,400
- Site License$ 3,120
- Global License$ 3,795

Leadership Perspectives from Industry Events
Search
Thought Leadership and Analyst Meet


Our Clients
6WResearch In News
- India Export Attractiveness Tracker 2026
- India Air Conditioner Market Set for Strong Rebound in 2026 After Weather-Led Correction and GST-Driven Recovery: 6Wresearch
- ADAS in India: How Automatic Emergency Braking, Blind Spot Detection & Driver Monitoring are Transforming Road Safety
- Doha a strategic location for EV manufacturing hub: IPA Qatar
- Demand for luxury TVs surging in the GCC, says Samsung
- Empowering Growth: The Thriving Journey of Bangladesh’s Cable Industry
Latest Reports
- Nicaragua RPG Gaming Market (2026-2032)
- New Zealand RPG Gaming Market (2026-2032)
- Netherlands RPG Gaming Market (2026-2032)
- Nauru RPG Gaming Market (2026-2032)
- Namibia RPG Gaming Market (2026-2032)
- Mozambique RPG Gaming Market (2026-2032)
- Montenegro RPG Gaming Market (2026-2032)
- Mongolia RPG Gaming Market (2026-2032)
- Monaco RPG Gaming Market (2026-2032)
- Micronesia RPG Gaming Market (2026-2032)
Industry Events and Analyst Meet

EV India Expo 2026

HIMTEX 2026

India Refining Summit 2026

India EV Show 2026

EV tech India Expo 2026
Whitepaper
- Middle East & Africa Commercial Security Market Click here to view more.
- Middle East & Africa Fire Safety Systems & Equipment Market Click here to view more.
- GCC Drone Market Click here to view more.
- Middle East Lighting Fixture Market Click here to view more.
- GCC Physical & Perimeter Security Market Click here to view more.