Finland Aluminum Beverage Can Market (2025-2031) | Forecast, Companies, Value, Analysis, Share, Growth, Competitive Landscape, Industry, Trends, Outlook, Segmentation, Size & Revenue
Market Forecast By Application (Carbonated Soft Drinks (CSD), Alcoholic Beverages, Others) And Competitive Landscape
| Product Code: ETC7190540 | Publication Date: Sep 2024 | Updated Date: Apr 2026 | Product Type: Market Research Report | |
| Publisher: 6Wresearch | Author: Sumit Sagar | No. of Pages: 75 | No. of Figures: 35 | No. of Tables: 20 |
Finland Aluminum Beverage Can Market Size (2020-2030)
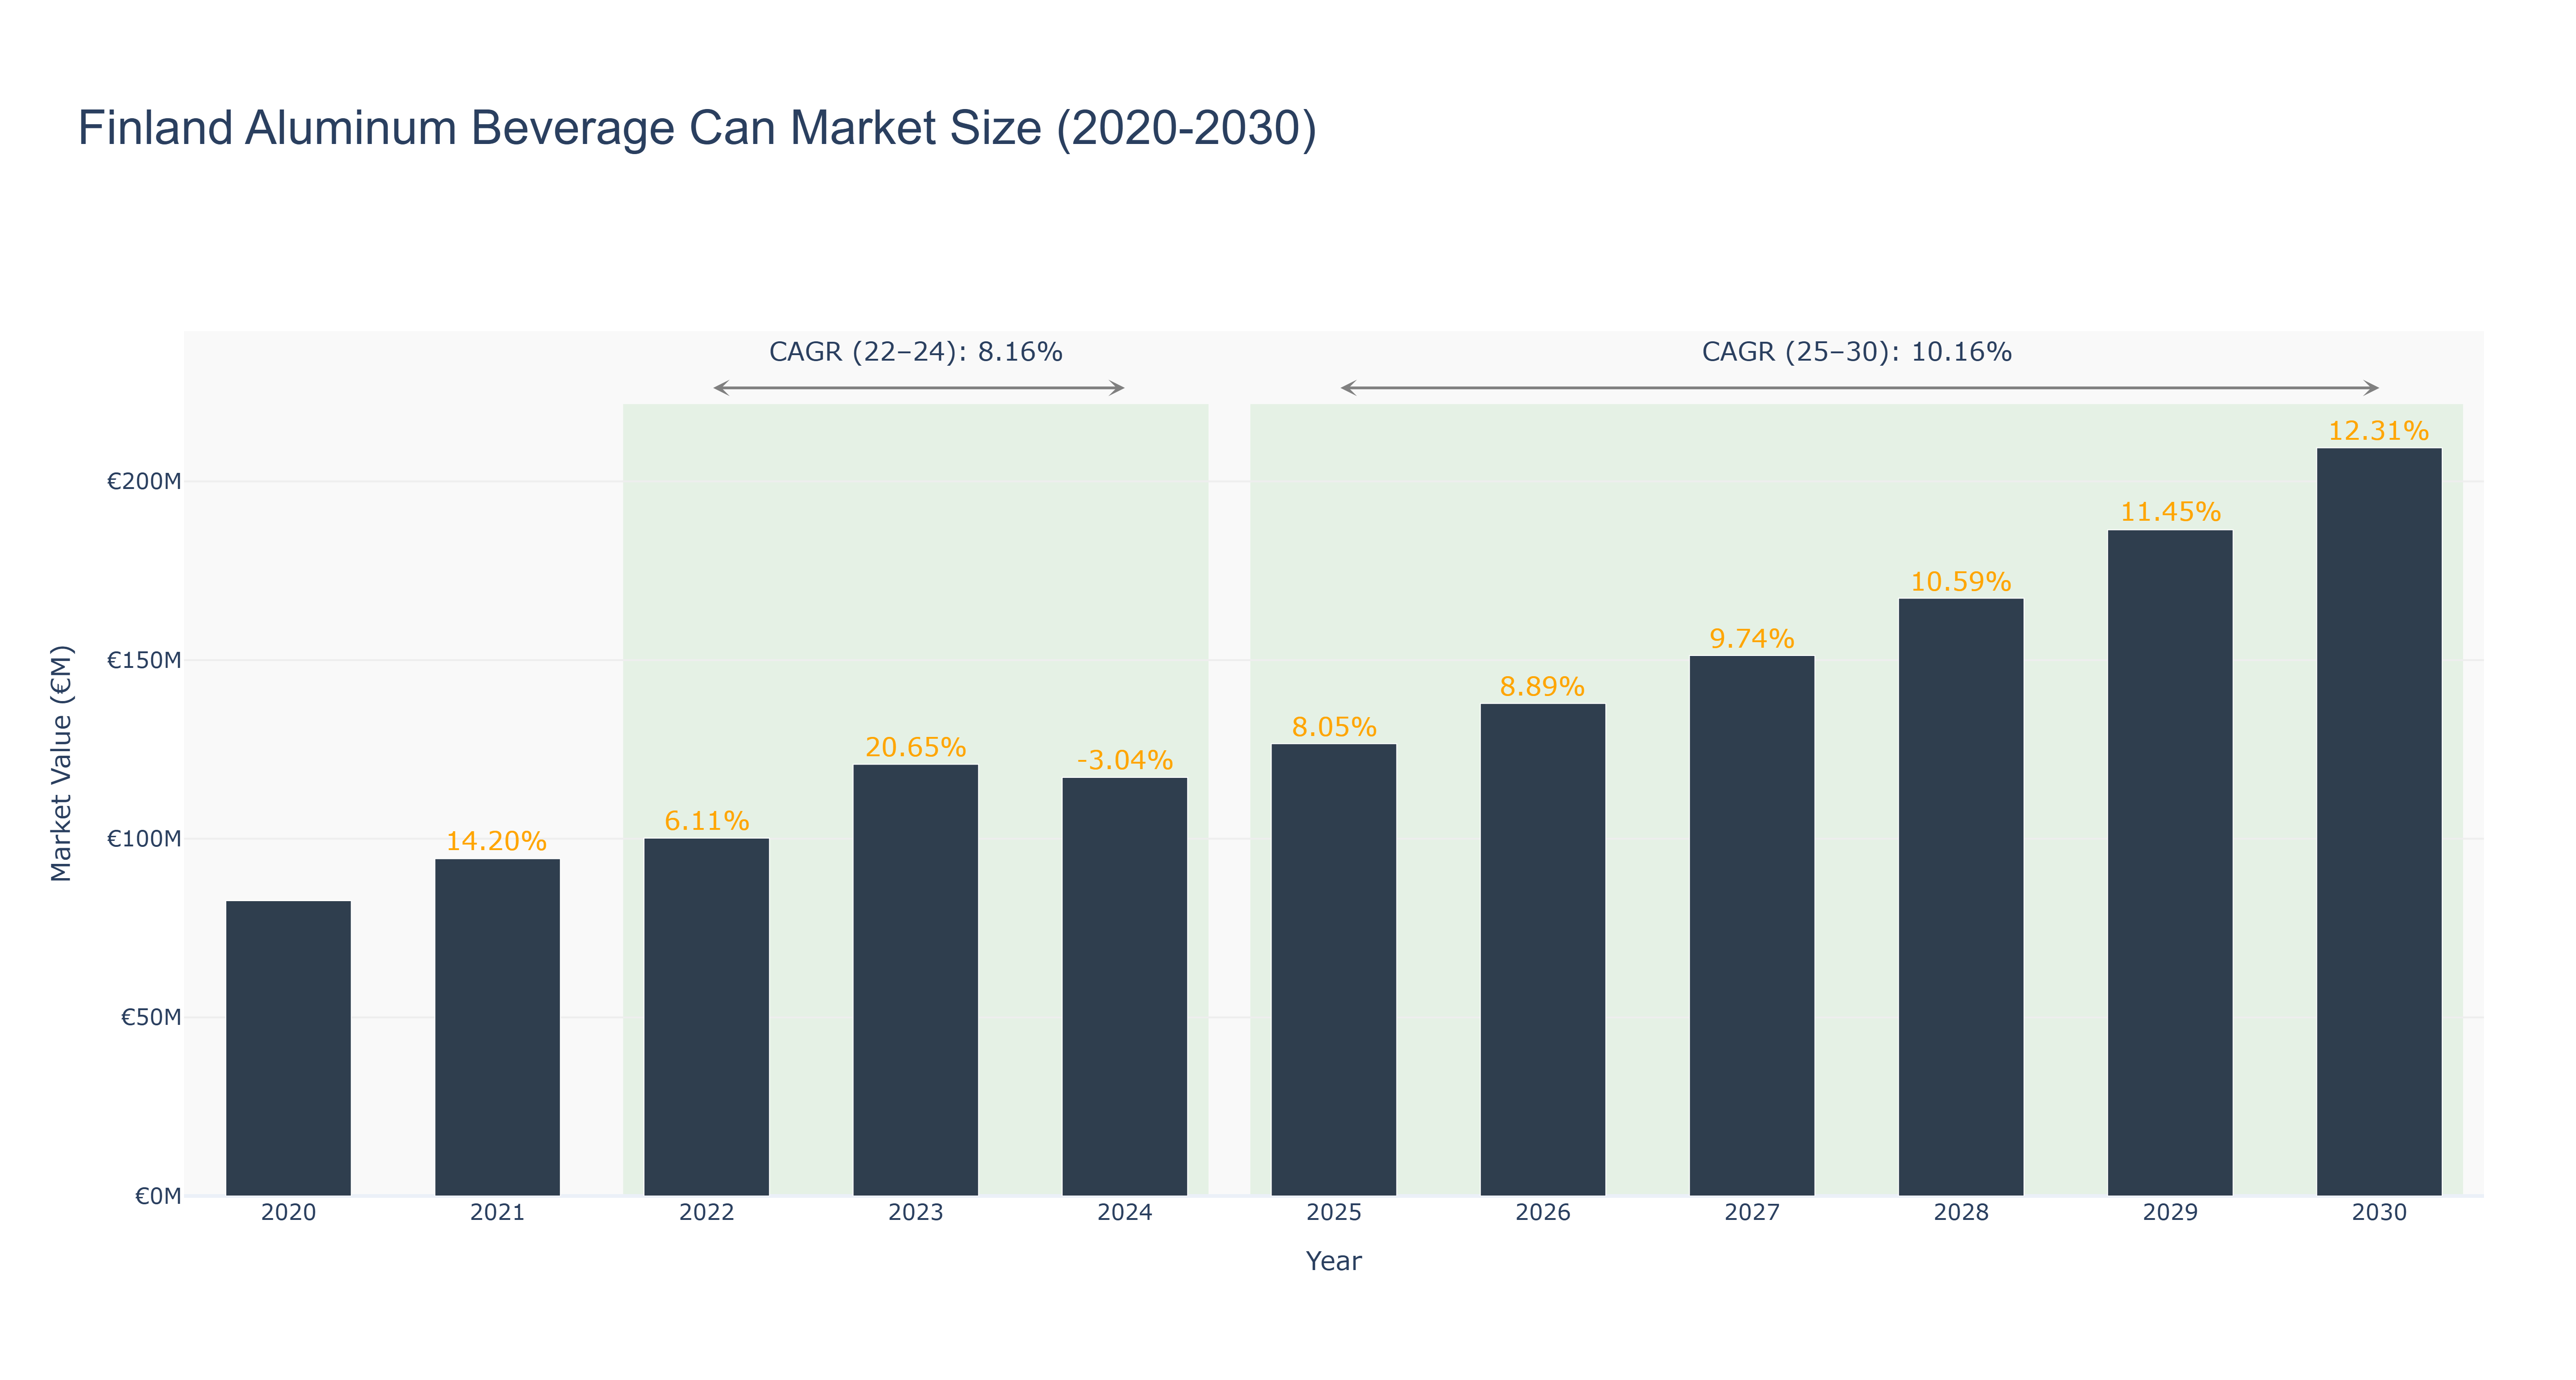
The Finland Aluminum Beverage Can Market exhibited notable fluctuations from 2020 to 2024, peaking at €120.84 million in 2023 before experiencing a decline to €117.17 million in 2024, reflecting a compound annual growth rate (CAGR) of 8.16% during the actual data period. This decline can be attributed to factors such as shifting consumer preferences and increased competition within the packaging sector. Looking ahead, the forecasted period from 2025 to 2030 presents a more optimistic outlook, with projected market growth reaching €209.41 million by 2030, corresponding to a CAGR of 10.16%. This anticipated growth will likely be driven by rising sustainability concerns, coupled with the expansion of the beverage industry and technological advancements in can production. As companies increasingly focus on eco-friendly packaging solutions, the aluminum beverage can market in Finland is poised for significant development in the coming years.
Finland Aluminum Beverage Can Market: Production & Trade Performance (2019-2025)
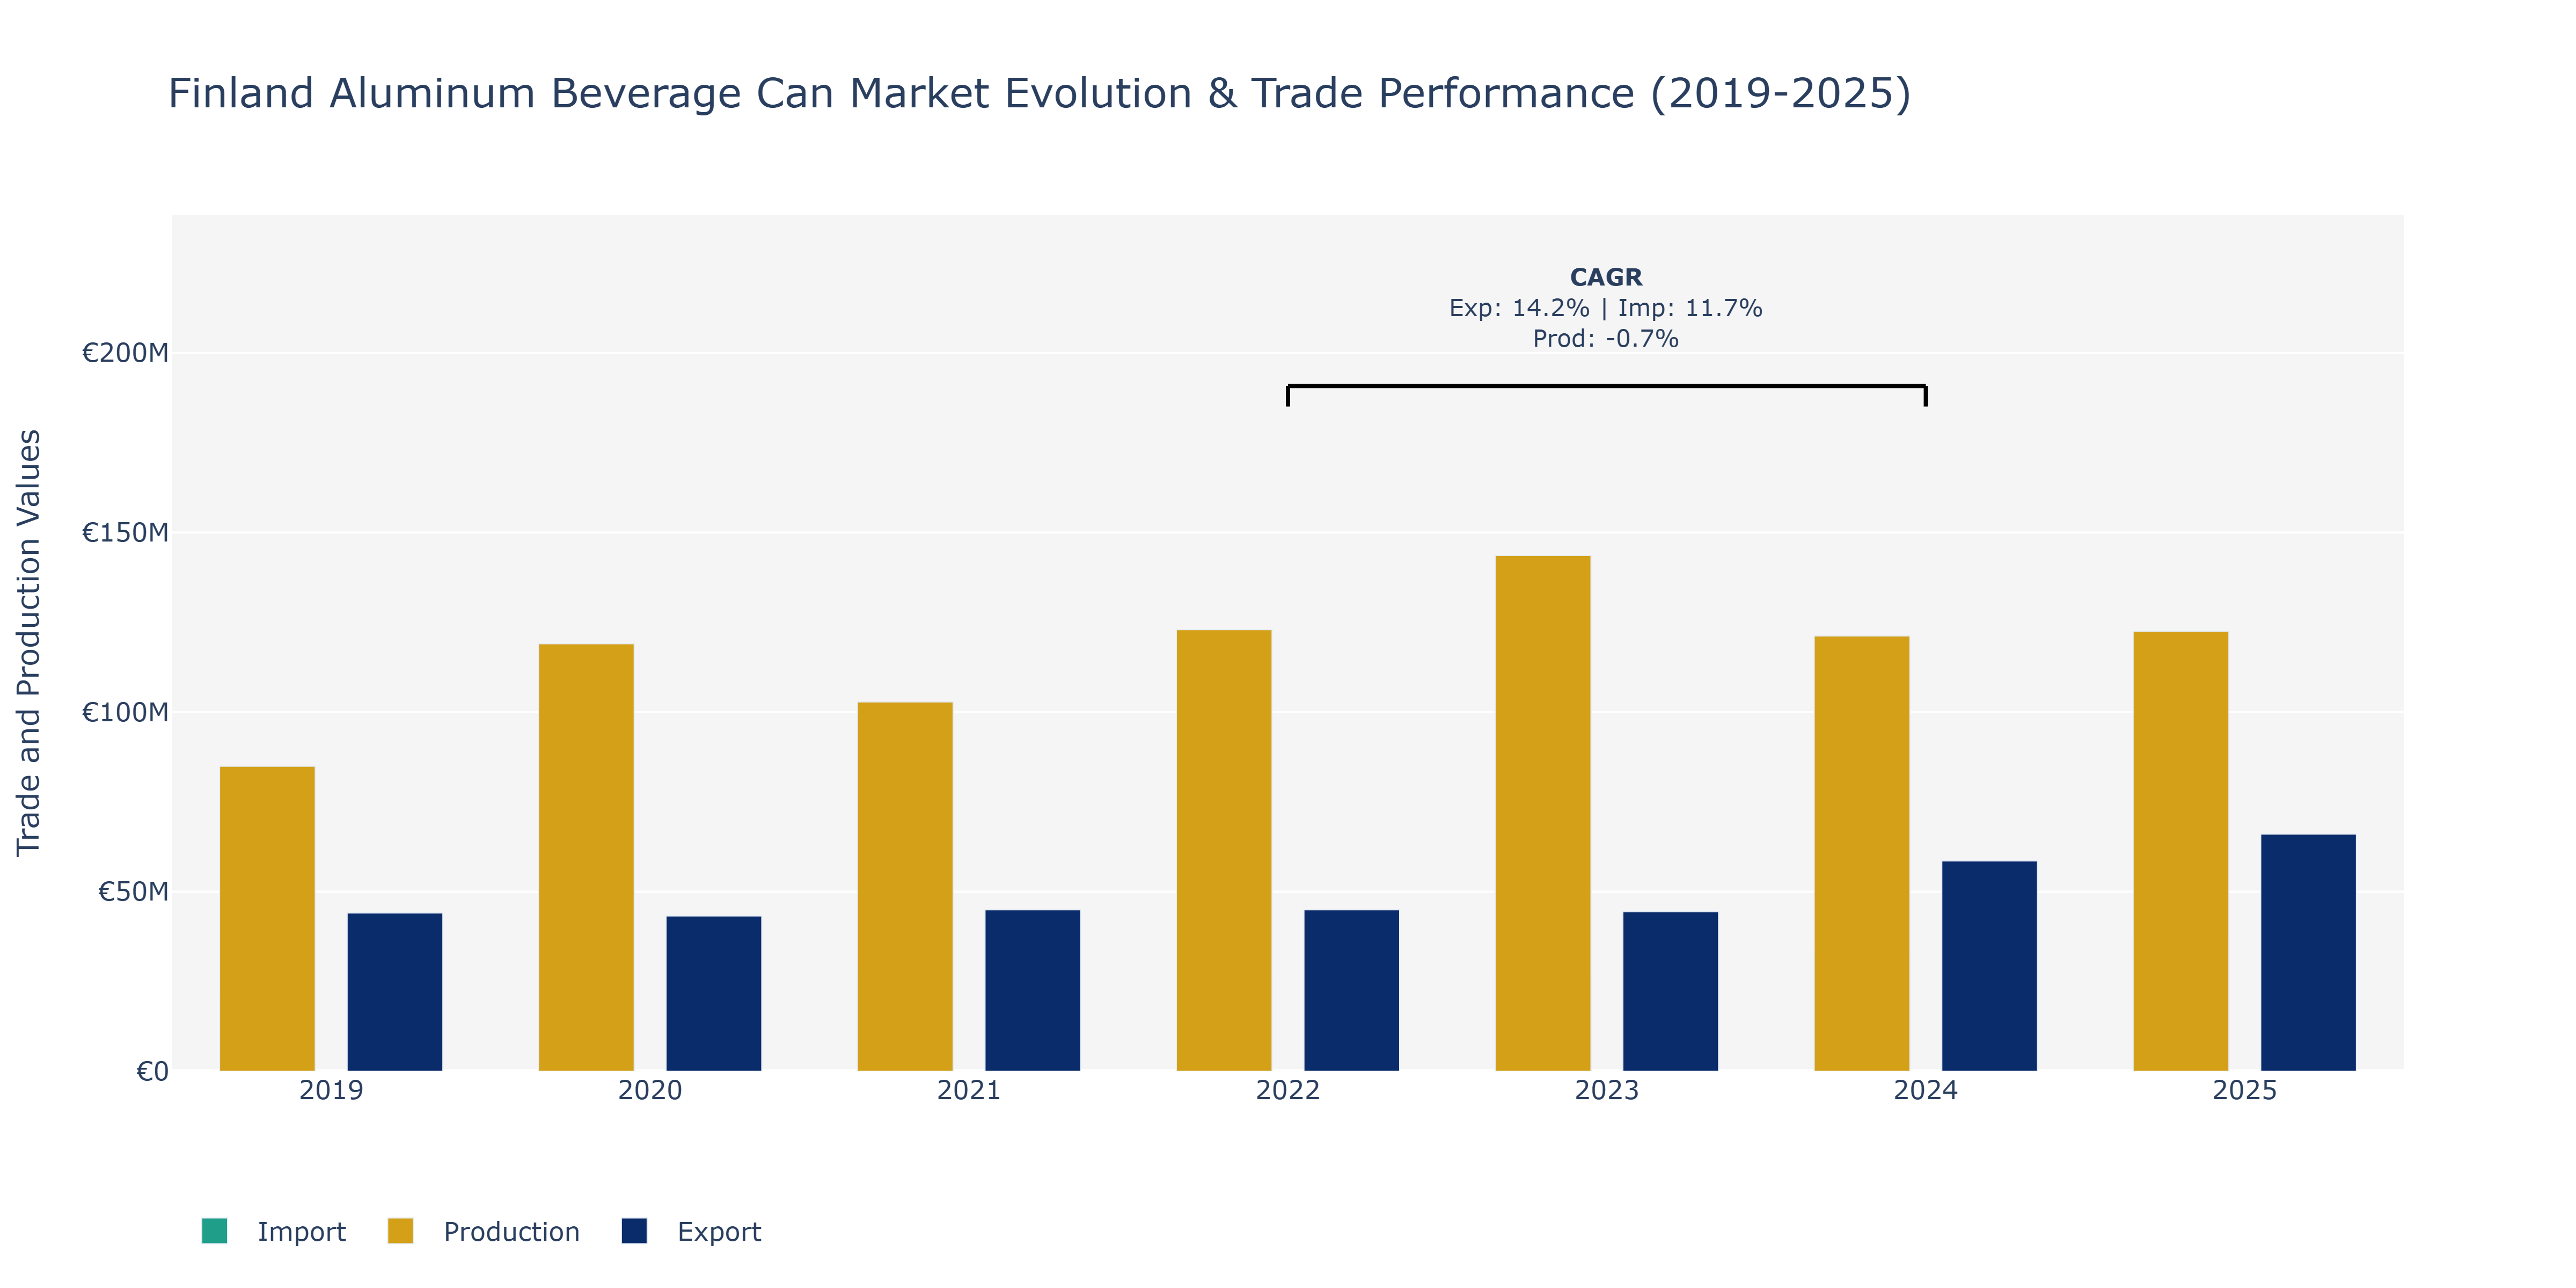
In the Finland Aluminum Beverage Can Market, from 2019 to 2025, exports displayed a fluctuating pattern. Exports peaked in 2025 at approximately €66.01 million, showing an increasing trend over the period. This growth can be attributed to the rising demand for sustainable packaging solutions globally, leading to an increased preference for aluminum beverage cans. Conversely, imports followed a similar pattern, peaking in 2025 at around €37.27 million, indicating a steady increase in foreign aluminum beverage can purchases. The surge in imports could be linked to the expanding beverage industry in Finland, necessitating a higher volume of raw materials. On the production front, there was a decline from 2019 to 2021, with a significant drop in 2020. However, production rebounded in 2022, reaching approximately €122.95 million, driven by advancements in manufacturing technologies and increased efficiency in production processes. Overall, the market's dynamics reflect a growing industry adapting to evolving consumer preferences and sustainability trends.
Key Highlights of the Report:
- Finland Aluminum Beverage Can Market Outlook
- Market Size of Finland Aluminum Beverage Can Market, 2024
- Forecast of Finland Aluminum Beverage Can Market, 2031
- Historical Data and Forecast of Finland Aluminum Beverage Can Revenues & Volume for the Period 2021- 2031
- Finland Aluminum Beverage Can Market Trend Evolution
- Finland Aluminum Beverage Can Market Drivers and Challenges
- Finland Aluminum Beverage Can Price Trends
- Finland Aluminum Beverage Can Porter's Five Forces
- Finland Aluminum Beverage Can Industry Life Cycle
- Historical Data and Forecast of Finland Aluminum Beverage Can Market Revenues & Volume By Application for the Period 2021- 2031
- Historical Data and Forecast of Finland Aluminum Beverage Can Market Revenues & Volume By Carbonated Soft Drinks (CSD) for the Period 2021- 2031
- Historical Data and Forecast of Finland Aluminum Beverage Can Market Revenues & Volume By Alcoholic Beverages for the Period 2021- 2031
- Historical Data and Forecast of Finland Aluminum Beverage Can Market Revenues & Volume By Others for the Period 2021- 2031
- Finland Aluminum Beverage Can Import Export Trade Statistics
- Market Opportunity Assessment By Application
- Finland Aluminum Beverage Can Top Companies Market Share
- Finland Aluminum Beverage Can Competitive Benchmarking By Technical and Operational Parameters
- Finland Aluminum Beverage Can Company Profiles
- Finland Aluminum Beverage Can Key Strategic Recommendations
Frequently Asked Questions About the Market Study (FAQs):
6Wresearch actively monitors the Finland Aluminum Beverage Can Market and publishes its comprehensive annual report, highlighting emerging trends, growth drivers, revenue analysis, and forecast outlook. Our insights help businesses to make data-backed strategic decisions with ongoing market dynamics. Our analysts track relevent industries related to the Finland Aluminum Beverage Can Market, allowing our clients with actionable intelligence and reliable forecasts tailored to emerging regional needs.
Yes, we provide customisation as per your requirements. To learn more, feel free to contact us on sales@6wresearch.com
1 Executive Summary |
2 Introduction |
2.1 Key Highlights of the Report |
2.2 Report Description |
2.3 Market Scope & Segmentation |
2.4 Research Methodology |
2.5 Assumptions |
3 Finland Aluminum Beverage Can Market Overview |
3.1 Finland Country Macro Economic Indicators |
3.2 Finland Aluminum Beverage Can Market Revenues & Volume, 2021 & 2031F |
3.3 Finland Aluminum Beverage Can Market - Industry Life Cycle |
3.4 Finland Aluminum Beverage Can Market - Porter's Five Forces |
3.5 Finland Aluminum Beverage Can Market Revenues & Volume Share, By Application, 2021 & 2031F |
4 Finland Aluminum Beverage Can Market Dynamics |
4.1 Impact Analysis |
4.2 Market Drivers |
4.2.1 Increasing consumer awareness about environmental sustainability and the recyclability of aluminum beverage cans |
4.2.2 Growth in the beverage industry, leading to higher demand for packaging solutions like aluminum cans |
4.2.3 Innovation in aluminum can design and technology, making them more appealing to consumers |
4.3 Market Restraints |
4.3.1 Fluctuating prices of aluminum and other raw materials, impacting the cost of manufacturing aluminum cans |
4.3.2 Competition from alternative packaging materials like PET bottles or glass containers |
4.3.3 Regulatory challenges related to recycling targets and waste management policies |
5 Finland Aluminum Beverage Can Market Trends |
6 Finland Aluminum Beverage Can Market, By Types |
6.1 Finland Aluminum Beverage Can Market, By Application |
6.1.1 Overview and Analysis |
6.1.2 Finland Aluminum Beverage Can Market Revenues & Volume, By Application, 2021- 2031F |
6.1.3 Finland Aluminum Beverage Can Market Revenues & Volume, By Carbonated Soft Drinks (CSD), 2021- 2031F |
6.1.4 Finland Aluminum Beverage Can Market Revenues & Volume, By Alcoholic Beverages, 2021- 2031F |
6.1.5 Finland Aluminum Beverage Can Market Revenues & Volume, By Others, 2021- 2031F |
7 Finland Aluminum Beverage Can Market Import-Export Trade Statistics |
7.1 Finland Aluminum Beverage Can Market Export to Major Countries |
7.2 Finland Aluminum Beverage Can Market Imports from Major Countries |
8 Finland Aluminum Beverage Can Market Key Performance Indicators |
8.1 Average recycling rate of aluminum beverage cans in Finland |
8.2 Adoption rate of aluminum cans by new beverage brands entering the market |
8.3 Investment in research and development for sustainable packaging solutions within the aluminum can industry |
9 Finland Aluminum Beverage Can Market - Opportunity Assessment |
9.1 Finland Aluminum Beverage Can Market Opportunity Assessment, By Application, 2021 & 2031F |
10 Finland Aluminum Beverage Can Market - Competitive Landscape |
10.1 Finland Aluminum Beverage Can Market Revenue Share, By Companies, 2024 |
10.2 Finland Aluminum Beverage Can Market Competitive Benchmarking, By Operating and Technical Parameters |
11 Company Profiles |
12 Recommendations |
13 Disclaimer |
Global Go To Market Strategy - 2030
Export potential enables firms to identify high-growth global markets with greater confidence by combining advanced trade intelligence with a structured quantitative methodology. The framework analyzes emerging demand trends and country-level import patterns while integrating macroeconomic and trade datasets such as GDP and population forecasts, bilateral import–export flows, tariff structures, elasticity differentials between developed and developing economies, geographic distance, and import demand projections. Using weighted trade values from 2020–2024 as the base period to project country-to-country export potential for 2030, these inputs are operationalized through calculated drivers such as gravity model parameters, tariff impact factors, and projected GDP per-capita growth. Through an analysis of hidden potentials, demand hotspots, and market conditions that are most favorable to success, this method enables firms to focus on target countries, maximize returns, and global expansion with data, backed by accuracy.
By factoring in the projected importer demand gap that is currently unmet and could be potential opportunity, it identifies the potential for the Exporter (Country) among 190 countries, against the general trade analysis, which identifies the biggest importer or exporter.
To discover high-growth global markets and optimize your business strategy:
Click Here
Pricing
- Single User License$ 1,995
- Department License$ 2,400
- Site License$ 3,120
- Global License$ 3,795

Leadership Perspectives from Industry Events
Search
Thought Leadership and Analyst Meet


Our Clients
6WResearch In News
- India Export Attractiveness Tracker 2026
- India Air Conditioner Market Set for Strong Rebound in 2026 After Weather-Led Correction and GST-Driven Recovery: 6Wresearch
- ADAS in India: How Automatic Emergency Braking, Blind Spot Detection & Driver Monitoring are Transforming Road Safety
- Doha a strategic location for EV manufacturing hub: IPA Qatar
- Demand for luxury TVs surging in the GCC, says Samsung
- Empowering Growth: The Thriving Journey of Bangladesh’s Cable Industry
Latest Reports
- Nicaragua RPG Gaming Market (2026-2032)
- New Zealand RPG Gaming Market (2026-2032)
- Netherlands RPG Gaming Market (2026-2032)
- Nauru RPG Gaming Market (2026-2032)
- Namibia RPG Gaming Market (2026-2032)
- Mozambique RPG Gaming Market (2026-2032)
- Montenegro RPG Gaming Market (2026-2032)
- Mongolia RPG Gaming Market (2026-2032)
- Monaco RPG Gaming Market (2026-2032)
- Micronesia RPG Gaming Market (2026-2032)
Industry Events and Analyst Meet

EV India Expo 2026

HIMTEX 2026

India Refining Summit 2026

India EV Show 2026

EV tech India Expo 2026
Whitepaper
- Middle East & Africa Commercial Security Market Click here to view more.
- Middle East & Africa Fire Safety Systems & Equipment Market Click here to view more.
- GCC Drone Market Click here to view more.
- Middle East Lighting Fixture Market Click here to view more.
- GCC Physical & Perimeter Security Market Click here to view more.