Finland Aniline Market (2025-2031) | Industry, Analysis, Revenue, Segmentation, Growth, Size, Companies, Trends, Outlook, Value, Forecast & Share
Market Forecast By Product Type (Synthetic Aniline, Bio-Based Aniline), By Application (Methylene Diphenyl Diisocyanate (MDI), Others), By Industry Vertical (Building & Construction, Rubber, Consumer Goods, Automotive, Packaging, Agriculture, Others) And Competitive Landscape
| Product Code: ETC4708501 | Publication Date: Nov 2023 | Updated Date: Apr 2026 | Product Type: Market Research Report | |
| Publisher: 6Wresearch | Author: Shubham Padhi | No. of Pages: 60 | No. of Figures: 30 | No. of Tables: 5 |
Finland Aniline Market Size (2020-2030)
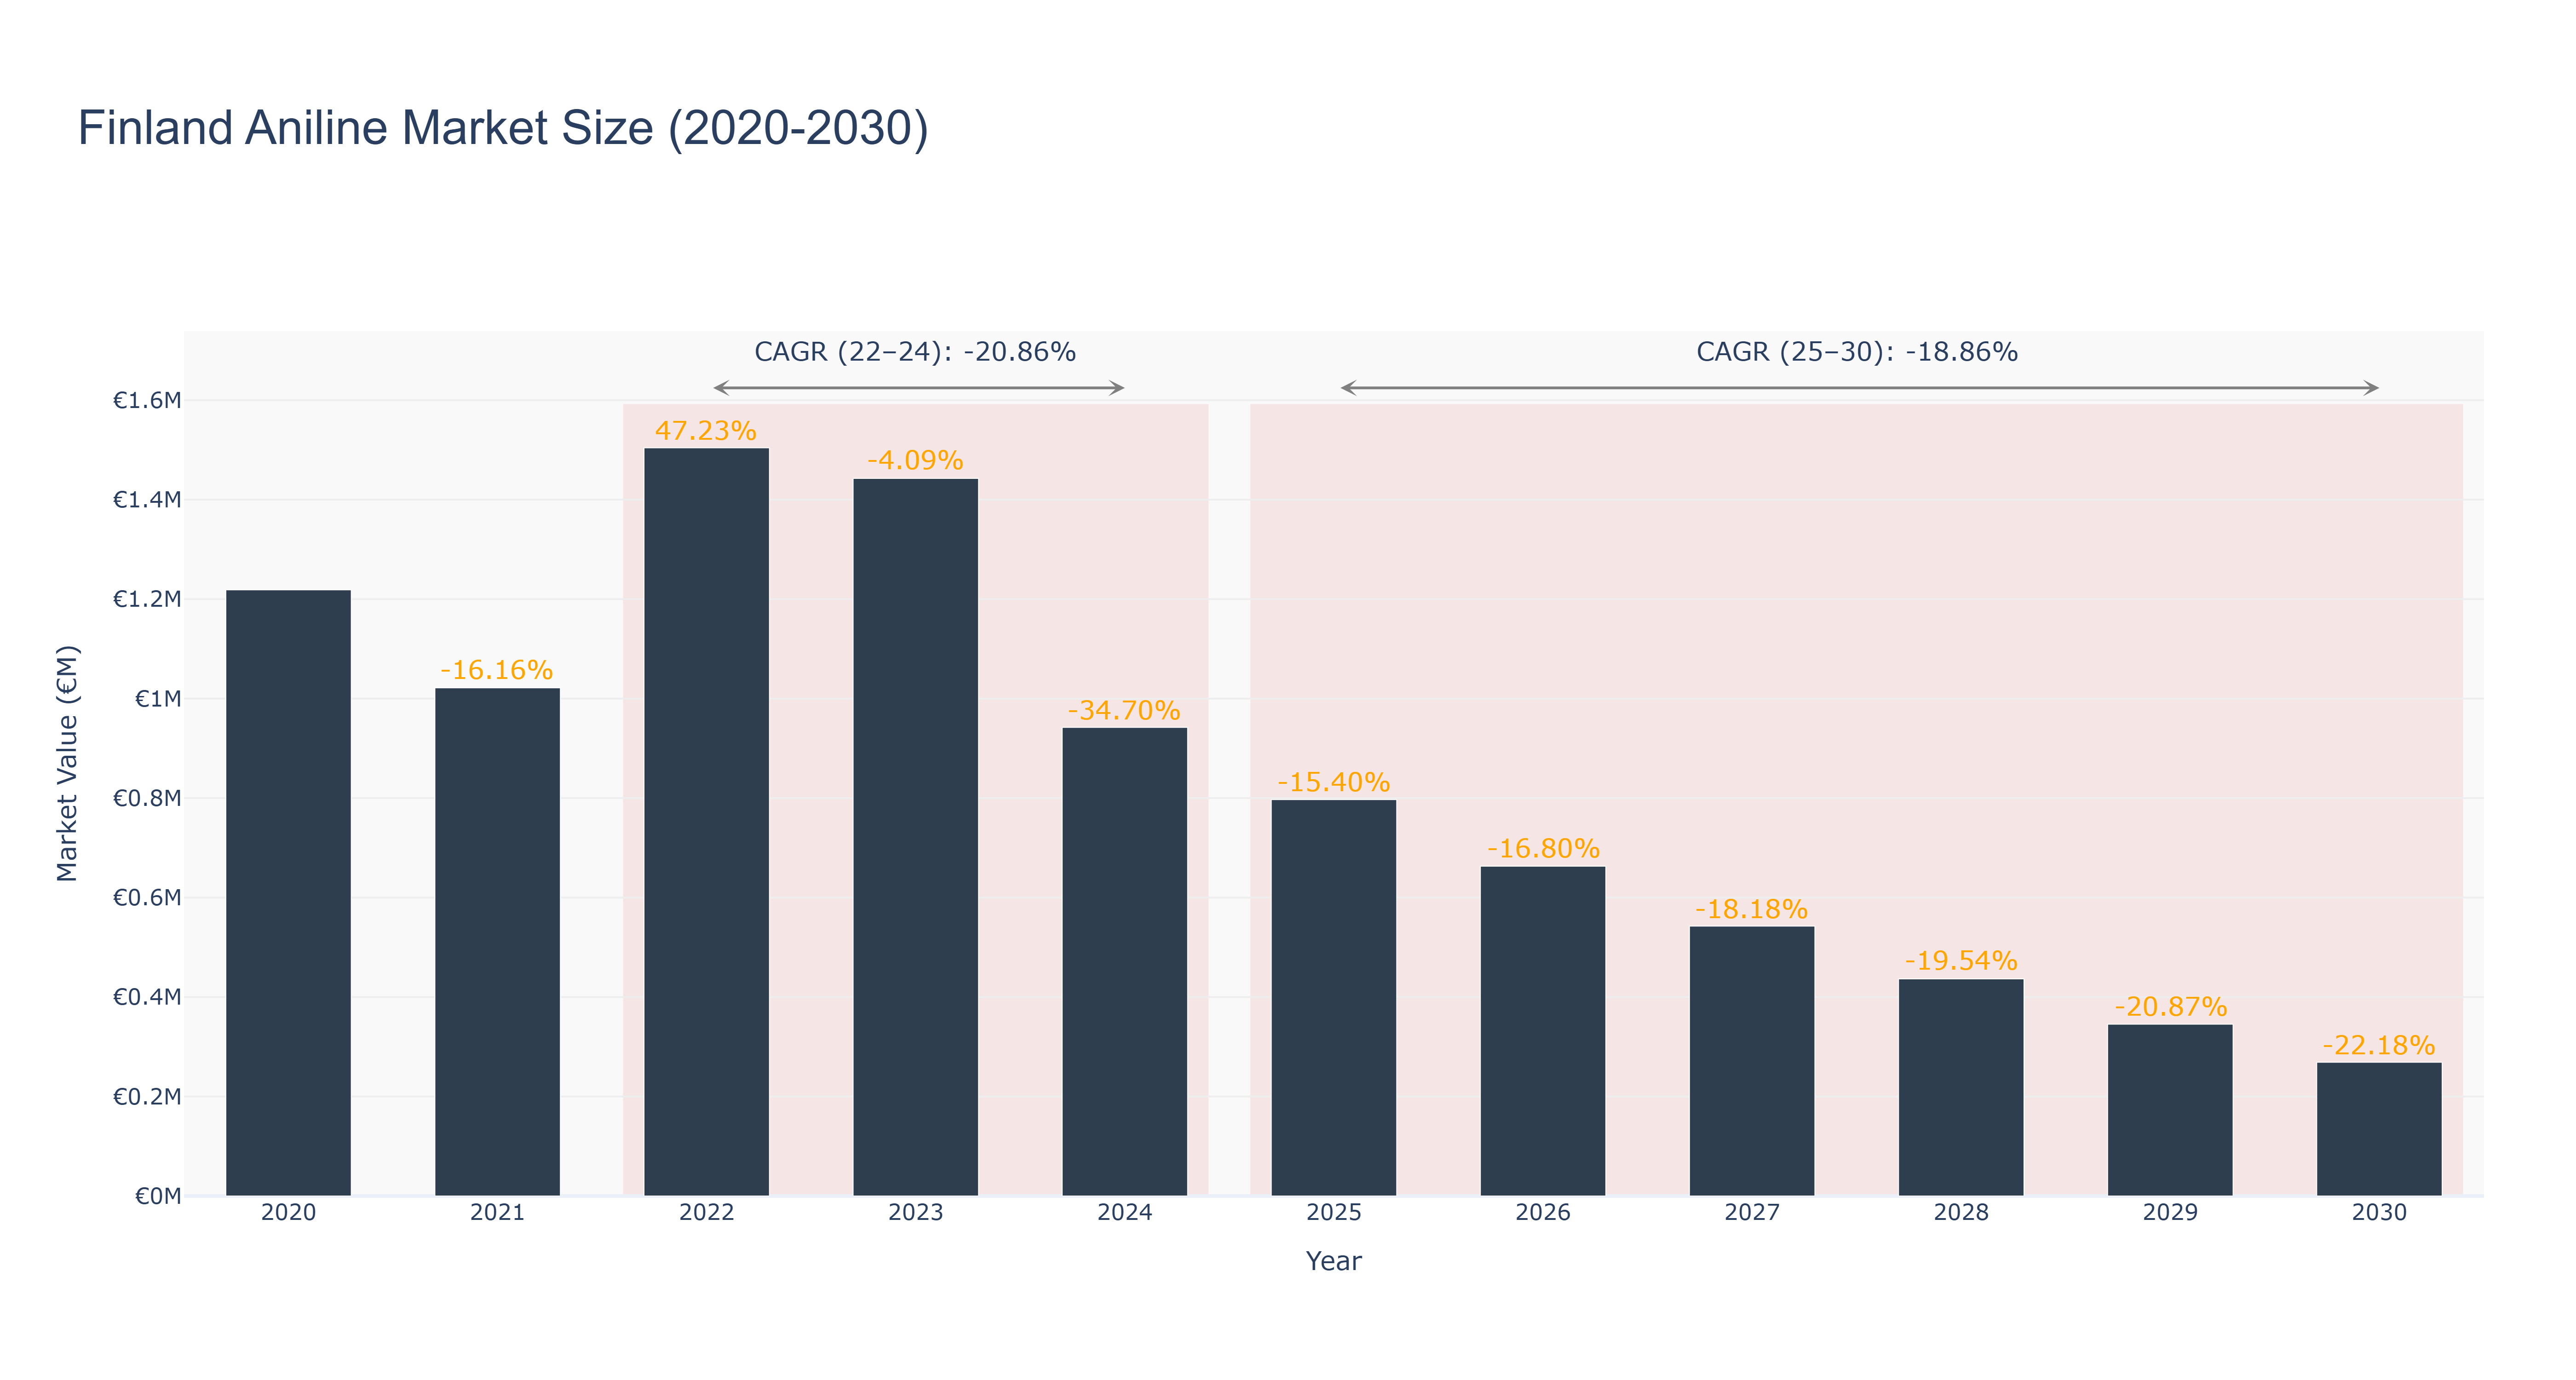
The Finland Aniline Market experienced a peak in 2022 with a market size of €1.50 million, followed by a decline to €0.94 million in 2024. The market is forecasted to continue shrinking, with a projected market size of €0.27 million in 2030. The CAGR for the period 2022-24 was -20.86%, while for 2025-30 it is expected to be -18.86%. The downward trend can be attributed to factors such as changing consumer preferences, regulatory challenges, and global economic uncertainties impacting demand. However, there are recent developments indicating a shift towards sustainable aniline production methods in Finland, aimed at reducing environmental impact and meeting evolving market demands. These initiatives are expected to drive innovation and potentially revive market growth in the coming years.
Finland Aniline Market: Production & Trade Performance (2019-2025)
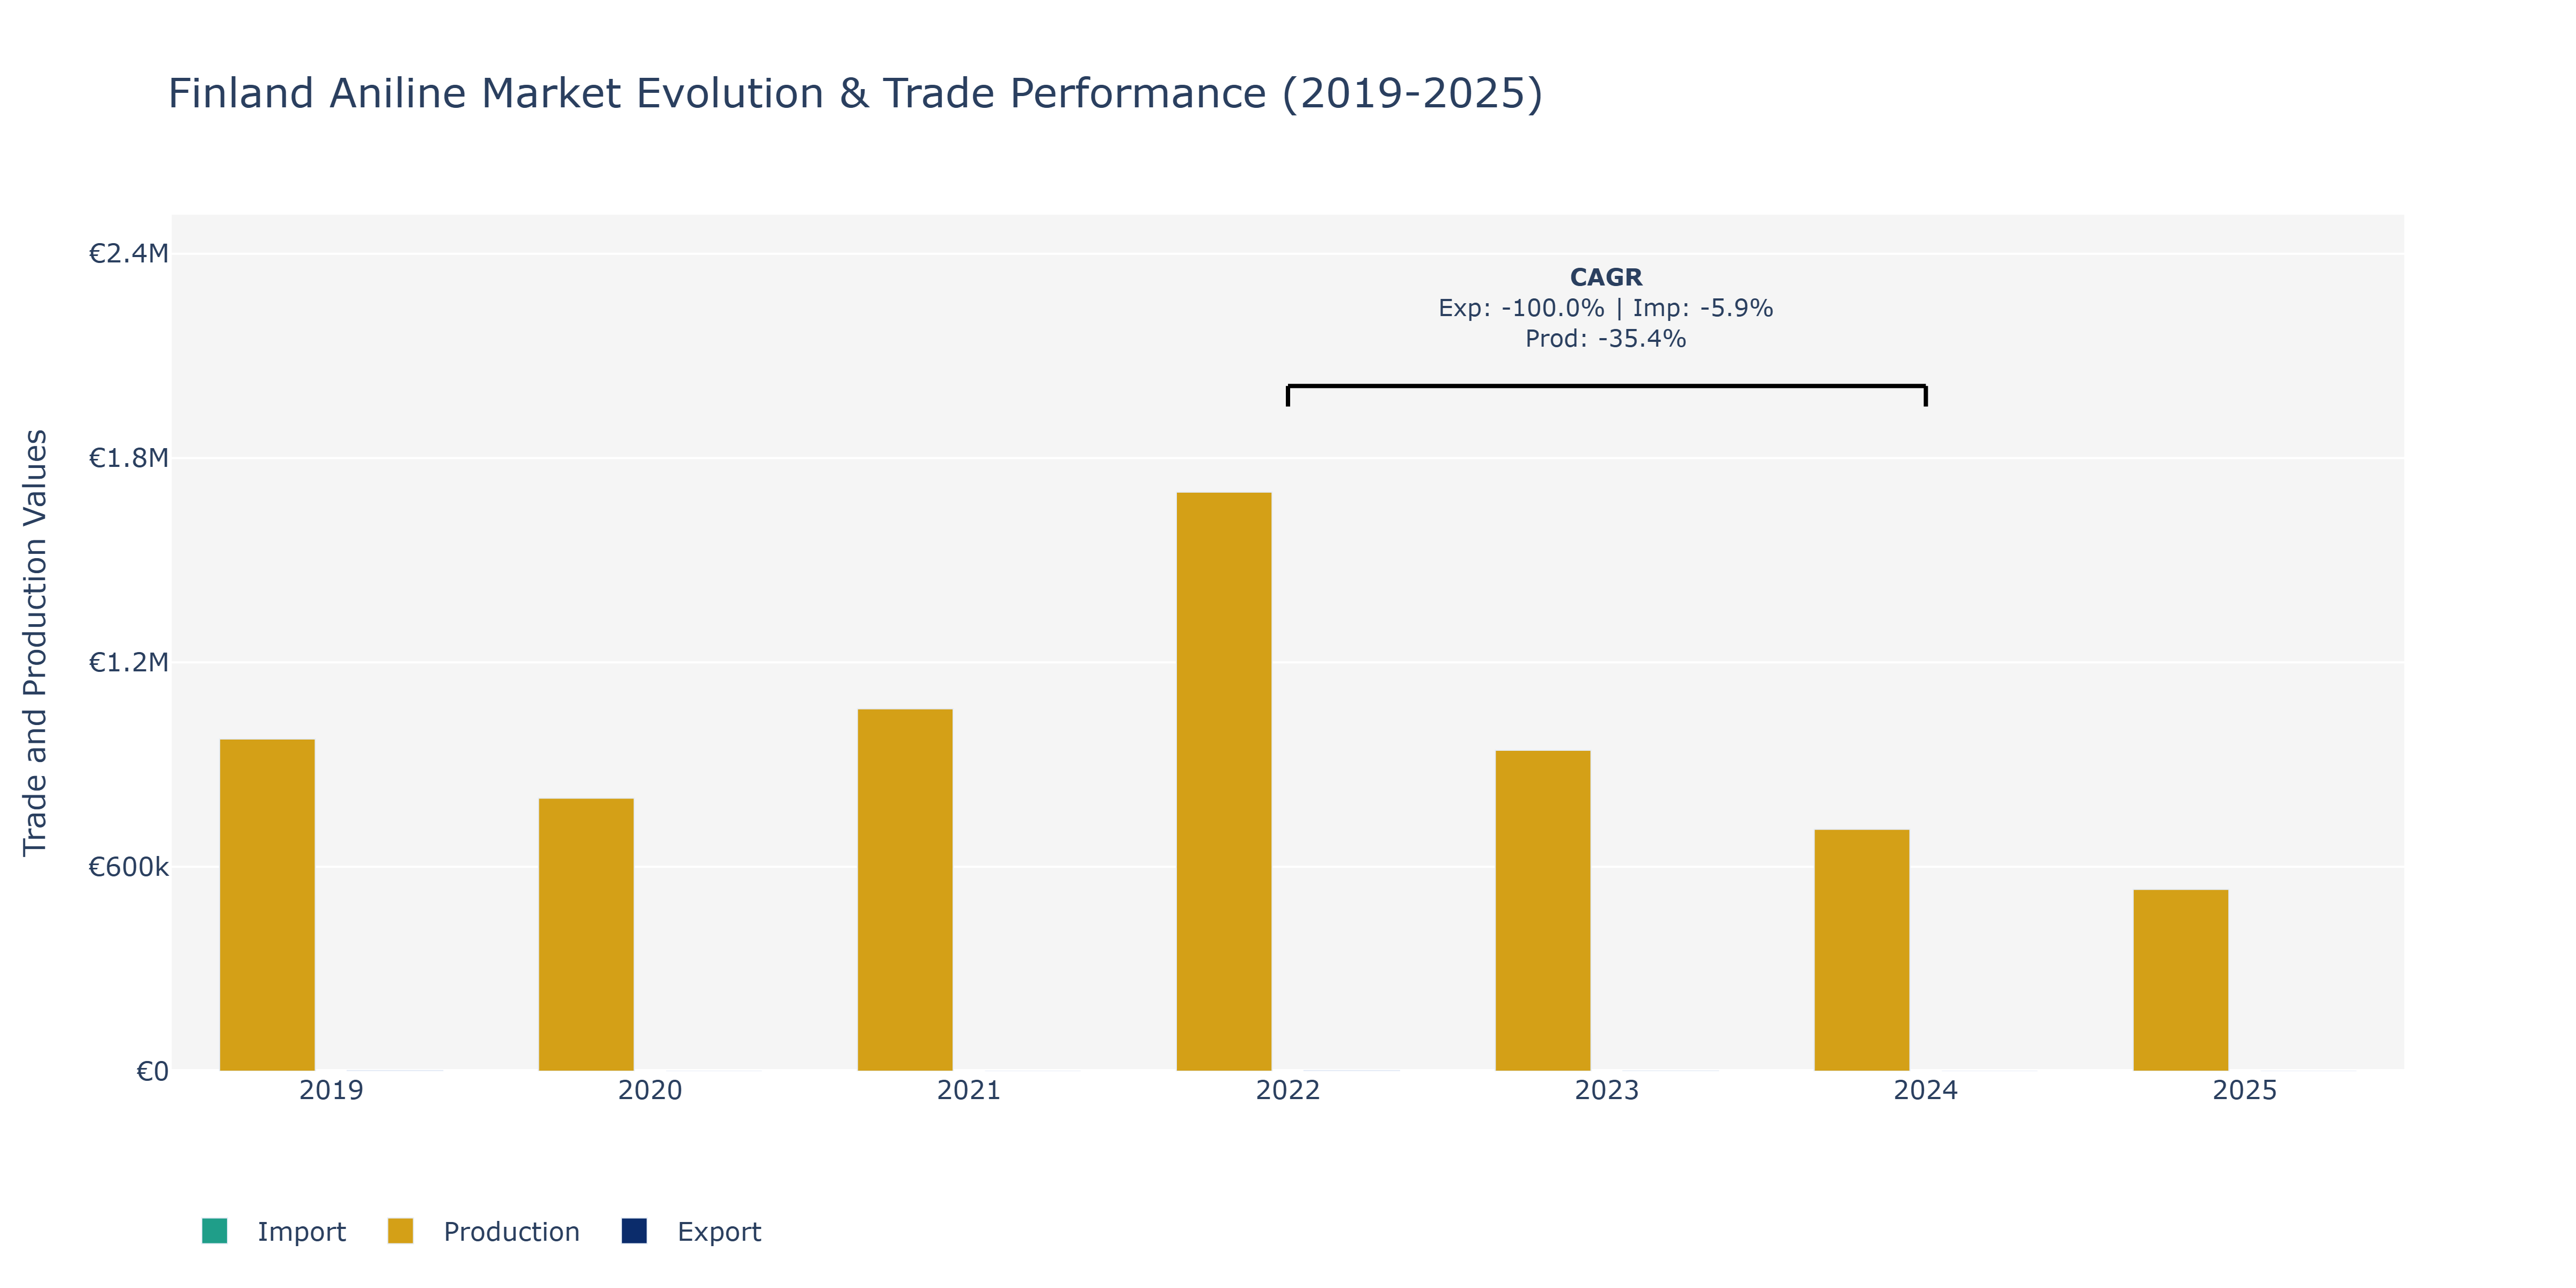
Between 2019 and 2025, the Finland Aniline Market witnessed notable shifts in Exports, Imports, and Production. In 2019, Exports started at €2.15 thousand but drastically dropped to €10 thousand in 2020 before showing a recovery trend to €1.956 thousand in 2022, followed by a slight decrease in 2023 to €0.935 million. Imports were at their peak in 2019 at €513.56 thousand, declining consistently to €82.299 thousand in 2025. Production value displayed a mixed pattern, starting at €975.258 thousand in 2019, peaking at €1.7 thousand in 2022, and then decreasing to €533.749 thousand in 2025. The notable decline in Exports could be attributed to a decrease in demand from key importing countries or disruptions in the supply chain. The fluctuation in Imports might be due to changes in domestic consumption patterns or evolving trade agreements impacting import volumes. The varying Production levels could be linked to technological advancements leading to enhanced efficiency or changes in raw material availability affecting output. These trends highlight the sensitivity of the Finland Aniline Market to global market dynamics and internal factors, necessitating strategic adaptation to maintain market competitiveness.
Key Highlights of the Report:
- Finland Aniline Market Outlook
- Market Size of Finland Aniline Market, 2024
- Forecast of Finland Aniline Market, 2031
- Historical Data and Forecast of Finland Aniline Revenues & Volume for the Period 2021-2031
- Finland Aniline Market Trend Evolution
- Finland Aniline Market Drivers and Challenges
- Finland Aniline Price Trends
- Finland Aniline Porter`s Five Forces
- Finland Aniline Industry Life Cycle
- Historical Data and Forecast of Finland Aniline Market Revenues & Volume By Product Type for the Period 2021-2031
- Historical Data and Forecast of Finland Aniline Market Revenues & Volume By Synthetic Aniline for the Period 2021-2031
- Historical Data and Forecast of Finland Aniline Market Revenues & Volume By Bio-Based Aniline for the Period 2021-2031
- Historical Data and Forecast of Finland Aniline Market Revenues & Volume By Application for the Period 2021-2031
- Historical Data and Forecast of Finland Aniline Market Revenues & Volume By Methylene Diphenyl Diisocyanate (MDI) for the Period 2021-2031
- Historical Data and Forecast of Finland Aniline Market Revenues & Volume By Others for the Period 2021-2031
- Historical Data and Forecast of Finland Aniline Market Revenues & Volume By Industry Vertical for the Period 2021-2031
- Historical Data and Forecast of Finland Aniline Market Revenues & Volume By Building & Construction for the Period 2021-2031
- Historical Data and Forecast of Finland Aniline Market Revenues & Volume By Rubber for the Period 2021-2031
- Historical Data and Forecast of Finland Aniline Market Revenues & Volume By Consumer Goods for the Period 2021-2031
- Historical Data and Forecast of Finland Aniline Market Revenues & Volume By Automotive for the Period 2021-2031
- Historical Data and Forecast of Finland Aniline Market Revenues & Volume By Packaging for the Period 2021-2031
- Historical Data and Forecast of Finland Aniline Market Revenues & Volume By Agriculture for the Period 2021-2031
- Historical Data and Forecast of Finland Aniline Market Revenues & Volume By Others for the Period 2021-2031
- Finland Aniline Import Export Trade Statistics
- Market Opportunity Assessment By Product Type
- Market Opportunity Assessment By Application
- Market Opportunity Assessment By Industry Vertical
- Finland Aniline Top Companies Market Share
- Finland Aniline Competitive Benchmarking By Technical and Operational Parameters
- Finland Aniline Company Profiles
- Finland Aniline Key Strategic Recommendations
Frequently Asked Questions About the Market Study (FAQs):
6Wresearch actively monitors the Finland Aniline Market and publishes its comprehensive annual report, highlighting emerging trends, growth drivers, revenue analysis, and forecast outlook. Our insights help businesses to make data-backed strategic decisions with ongoing market dynamics. Our analysts track relevent industries related to the Finland Aniline Market, allowing our clients with actionable intelligence and reliable forecasts tailored to emerging regional needs.
Yes, we provide customisation as per your requirements. To learn more, feel free to contact us on sales@6wresearch.com
1 Executive Summary |
2 Introduction |
2.1 Key Highlights of the Report |
2.2 Report Description |
2.3 Market Scope & Segmentation |
2.4 Research Methodology |
2.5 Assumptions |
3 Finland Aniline Market Overview |
3.1 Finland Country Macro Economic Indicators |
3.2 Finland Aniline Market Revenues & Volume, 2021 & 2031F |
3.3 Finland Aniline Market - Industry Life Cycle |
3.4 Finland Aniline Market - Porter's Five Forces |
3.5 Finland Aniline Market Revenues & Volume Share, By Product Type, 2021 & 2031F |
3.6 Finland Aniline Market Revenues & Volume Share, By Application, 2021 & 2031F |
3.7 Finland Aniline Market Revenues & Volume Share, By Industry Vertical, 2021 & 2031F |
4 Finland Aniline Market Dynamics |
4.1 Impact Analysis |
4.2 Market Drivers |
4.2.1 Increasing demand for aniline in various end-use industries such as rubber, plastics, and pharmaceuticals |
4.2.2 Growing investments in research and development for the production of aniline derivatives |
4.2.3 Favorable government regulations promoting the use of aniline in eco-friendly products |
4.3 Market Restraints |
4.3.1 Volatility in raw material prices impacting the production cost of aniline |
4.3.2 Environmental concerns related to the disposal of aniline by-products |
4.3.3 Competition from alternative chemicals in the market |
5 Finland Aniline Market Trends |
6 Finland Aniline Market Segmentations |
6.1 Finland Aniline Market, By Product Type |
6.1.1 Overview and Analysis |
6.1.2 Finland Aniline Market Revenues & Volume, By Synthetic Aniline, 2021-2031F |
6.1.3 Finland Aniline Market Revenues & Volume, By Bio-Based Aniline, 2021-2031F |
6.2 Finland Aniline Market, By Application |
6.2.1 Overview and Analysis |
6.2.2 Finland Aniline Market Revenues & Volume, By Methylene Diphenyl Diisocyanate (MDI), 2021-2031F |
6.2.3 Finland Aniline Market Revenues & Volume, By Others, 2021-2031F |
6.3 Finland Aniline Market, By Industry Vertical |
6.3.1 Overview and Analysis |
6.3.2 Finland Aniline Market Revenues & Volume, By Building & Construction, 2021-2031F |
6.3.3 Finland Aniline Market Revenues & Volume, By Rubber, 2021-2031F |
6.3.4 Finland Aniline Market Revenues & Volume, By Consumer Goods, 2021-2031F |
6.3.5 Finland Aniline Market Revenues & Volume, By Automotive, 2021-2031F |
6.3.6 Finland Aniline Market Revenues & Volume, By Packaging, 2021-2031F |
6.3.7 Finland Aniline Market Revenues & Volume, By Agriculture, 2021-2031F |
7 Finland Aniline Market Import-Export Trade Statistics |
7.1 Finland Aniline Market Export to Major Countries |
7.2 Finland Aniline Market Imports from Major Countries |
8 Finland Aniline Market Key Performance Indicators |
8.1 Research and development expenditure on aniline and its derivatives |
8.2 Number of new product launches using aniline as a key ingredient |
8.3 Environmental impact assessments and improvement initiatives related to aniline production and usage |
9 Finland Aniline Market - Opportunity Assessment |
9.1 Finland Aniline Market Opportunity Assessment, By Product Type, 2021 & 2031F |
9.2 Finland Aniline Market Opportunity Assessment, By Application, 2021 & 2031F |
9.3 Finland Aniline Market Opportunity Assessment, By Industry Vertical, 2021 & 2031F |
10 Finland Aniline Market - Competitive Landscape |
10.1 Finland Aniline Market Revenue Share, By Companies, 2024 |
10.2 Finland Aniline Market Competitive Benchmarking, By Operating and Technical Parameters |
11 Company Profiles |
12 Recommendations | 13 Disclaimer |
Global Go To Market Strategy - 2030
Export potential enables firms to identify high-growth global markets with greater confidence by combining advanced trade intelligence with a structured quantitative methodology. The framework analyzes emerging demand trends and country-level import patterns while integrating macroeconomic and trade datasets such as GDP and population forecasts, bilateral import–export flows, tariff structures, elasticity differentials between developed and developing economies, geographic distance, and import demand projections. Using weighted trade values from 2020–2024 as the base period to project country-to-country export potential for 2030, these inputs are operationalized through calculated drivers such as gravity model parameters, tariff impact factors, and projected GDP per-capita growth. Through an analysis of hidden potentials, demand hotspots, and market conditions that are most favorable to success, this method enables firms to focus on target countries, maximize returns, and global expansion with data, backed by accuracy.
By factoring in the projected importer demand gap that is currently unmet and could be potential opportunity, it identifies the potential for the Exporter (Country) among 190 countries, against the general trade analysis, which identifies the biggest importer or exporter.
To discover high-growth global markets and optimize your business strategy:
Click Here
Pricing
- Single User License$ 1,995
- Department License$ 2,400
- Site License$ 3,120
- Global License$ 3,795

Leadership Perspectives from Industry Events
Search
Thought Leadership and Analyst Meet


Our Clients
6WResearch In News
- India Export Attractiveness Tracker 2026
- India Air Conditioner Market Set for Strong Rebound in 2026 After Weather-Led Correction and GST-Driven Recovery: 6Wresearch
- ADAS in India: How Automatic Emergency Braking, Blind Spot Detection & Driver Monitoring are Transforming Road Safety
- Doha a strategic location for EV manufacturing hub: IPA Qatar
- Demand for luxury TVs surging in the GCC, says Samsung
- Empowering Growth: The Thriving Journey of Bangladesh’s Cable Industry
Latest Reports
- Nicaragua RPG Gaming Market (2026-2032)
- New Zealand RPG Gaming Market (2026-2032)
- Netherlands RPG Gaming Market (2026-2032)
- Nauru RPG Gaming Market (2026-2032)
- Namibia RPG Gaming Market (2026-2032)
- Mozambique RPG Gaming Market (2026-2032)
- Montenegro RPG Gaming Market (2026-2032)
- Mongolia RPG Gaming Market (2026-2032)
- Monaco RPG Gaming Market (2026-2032)
- Micronesia RPG Gaming Market (2026-2032)
Industry Events and Analyst Meet

EV India Expo 2026

HIMTEX 2026

India Refining Summit 2026

India EV Show 2026

EV tech India Expo 2026
Whitepaper
- Middle East & Africa Commercial Security Market Click here to view more.
- Middle East & Africa Fire Safety Systems & Equipment Market Click here to view more.
- GCC Drone Market Click here to view more.
- Middle East Lighting Fixture Market Click here to view more.
- GCC Physical & Perimeter Security Market Click here to view more.