Finland Chlorine Market (2025-2031) | Analysis, Value, Outlook, Forecast, Revenue, Growth, Industry, Segmentation, Trends, Share, Companies & Size
Market Forecast By Application (EDC/PVC, Isocyanates and Oxygenates, Chloromethanes, Solvents and Epichlorohydrin, Inorganic Chemicals, Other Applications), By End-user (Water Treatment, Pharmaceutical, Chemicals, Paper and Pulp, Plastic, Pesticides, Other) And Competitive Landscape
| Product Code: ETC4820620 | Publication Date: Nov 2023 | Updated Date: Apr 2026 | Product Type: Market Research Report | |
| Publisher: 6Wresearch | Author: Sachin Kumar Rai | No. of Pages: 60 | No. of Figures: 30 | No. of Tables: 5 |
Finland Chlorine Market Size (2020-2030)
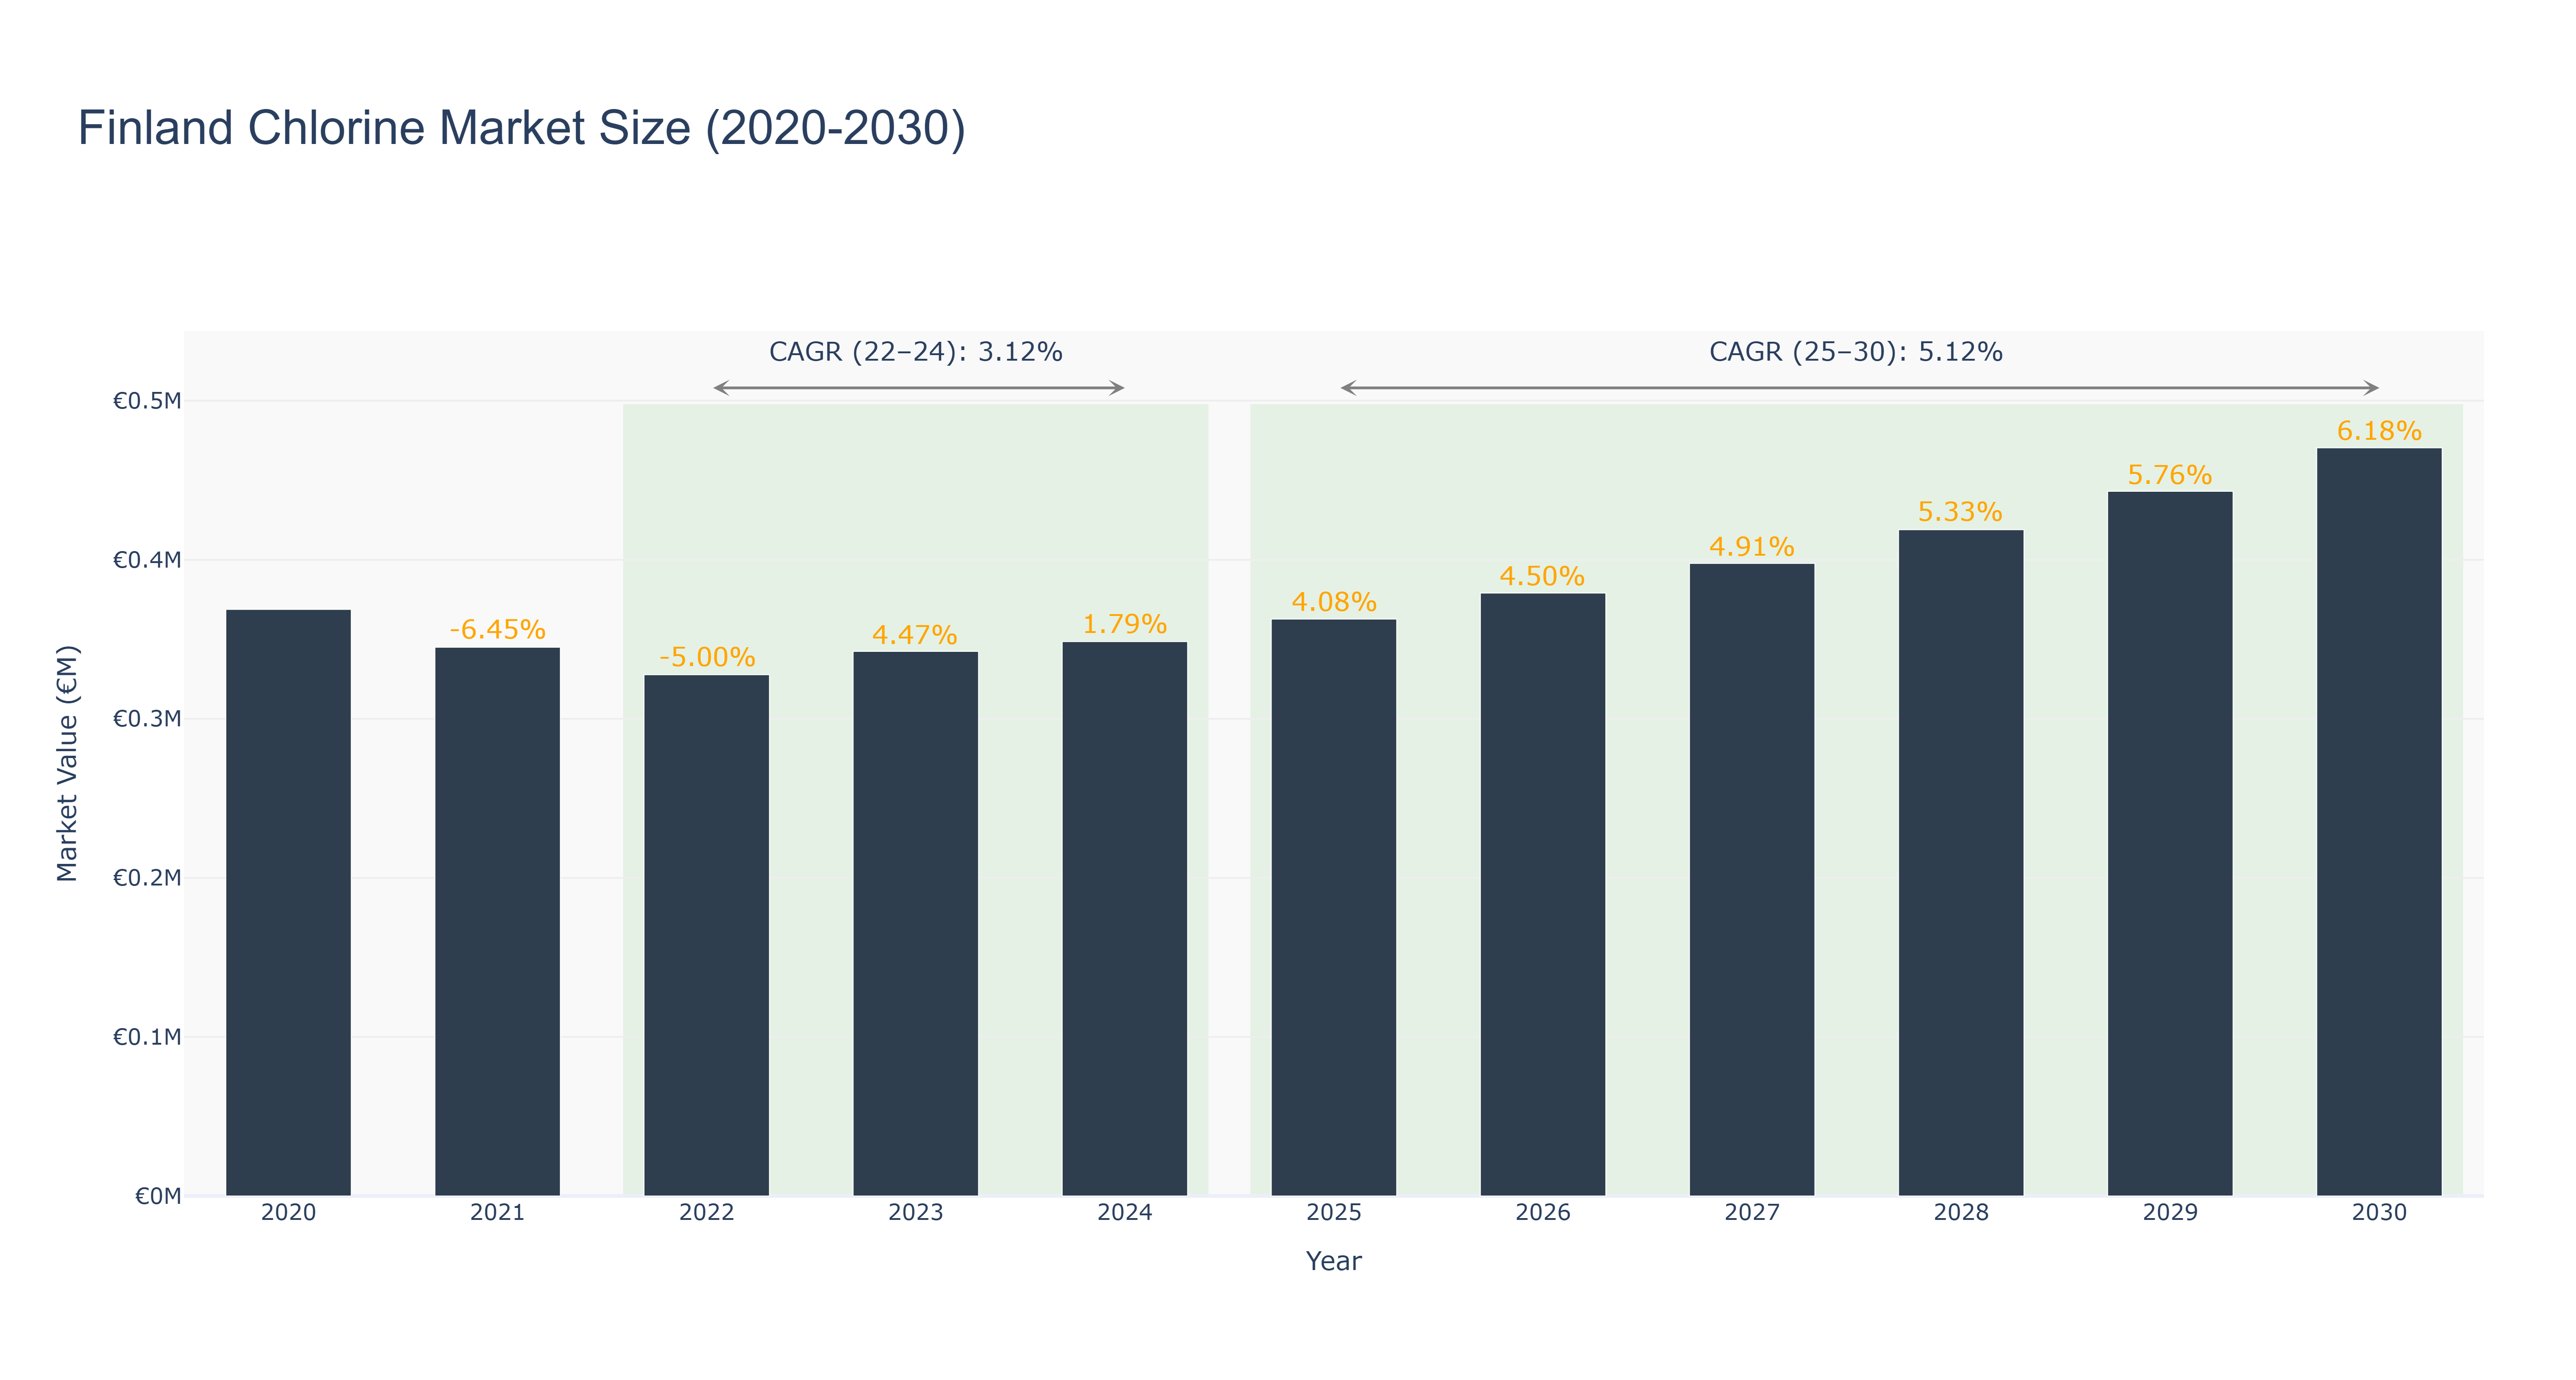
The Finland Chlorine Market experienced a gradual decline in market size from €0.37 million in 2020 to €0.33 million in 2022, attributed to factors like economic slowdown and changing consumer preferences. However, from 2023 onwards, the market showed a positive growth trajectory, with the market size reaching €0.47 million in 2030. The Compound Annual Growth Rate (CAGR) for the period 2025-2030 is projected at 5.12%, indicating a steady expansion in the market. Recent developments in the market include increased demand for eco-friendly chlorine products and advancements in chlorine production technologies. Future projects are focused on enhancing product sustainability and exploring new applications for chlorine in industries such as water treatment and pharmaceuticals. These initiatives are expected to drive further growth and innovation in the Finland Chlorine Market.
Finland Chlorine Market: Production & Trade Performance (2019-2025)
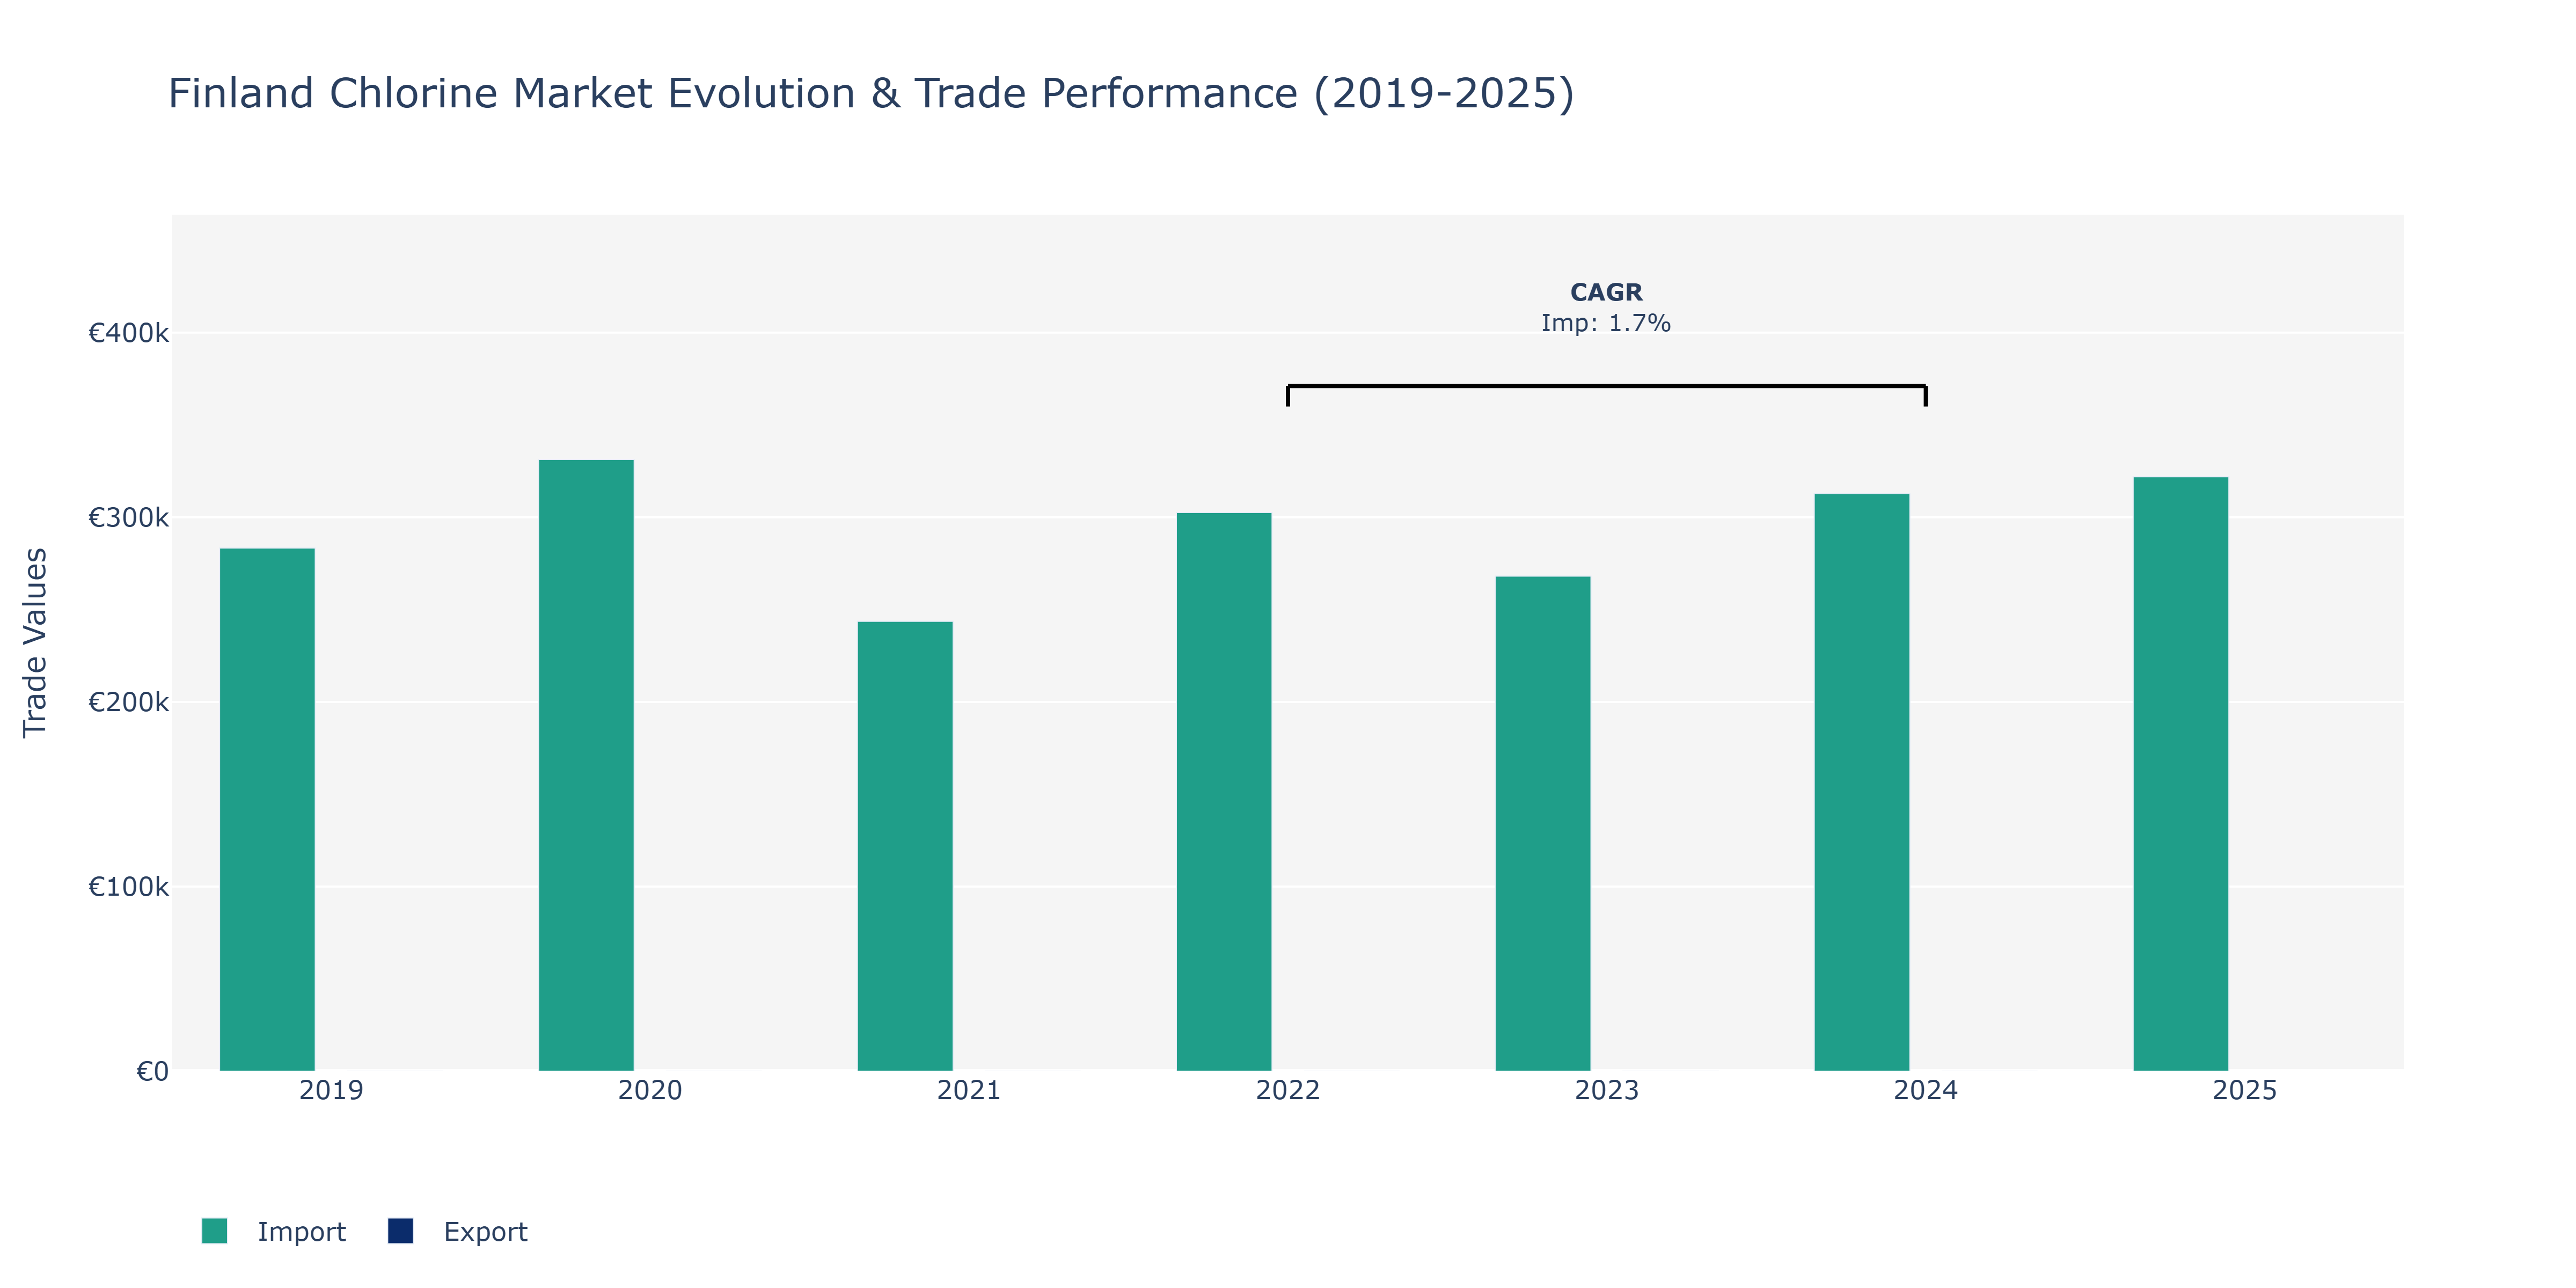
In the Finland Chlorine Market, imports experienced a fluctuating pattern between 2019 and 2025, showcasing a peak in 2025 at approximately €322 million. Notably, imports recorded a decline in 2021 but recovered in 2022, eventually reaching a peak in 2025. On the other hand, exports saw a modest figure of €1 million in 2021, followed by a remarkable increase to €18 million in 2023. These movements may be attributed to various factors such as changes in demand for chlorine-based products, global market trends, and domestic production capacities. The surge in exports in 2023 could indicate growing competitiveness in the international market or the introduction of innovative chlorine-related products by Finnish companies. The rebound of imports in 2022 and subsequent peak in 2025 might reflect increasing consumption rates or the need to meet evolving industrial requirements within Finland. Such trends emphasize the market's responsiveness to both domestic and global dynamics, highlighting the adaptability of stakeholders in the face of changing market conditions.
Finland Chlorine Market Overview
The chlorine market in Finland is influenced by its applications in water treatment, disinfection, and the production of chemicals like PVC. The market is also driven by the demand from industries such as pharmaceuticals, agriculture, and food processing, where chlorine compounds are used for sterilization and preservation.
Drivers of the market
The Chlorine Market in Finland is expanding due to the increasing use of chlorine in water purification, disinfectants, and the production of essential chemicals. With growing environmental concerns, chlorine remains critical for maintaining public health and improving the safety of water supplies, boosting market demand.
Challenges of the market
The chlorine market in Finland faces challenges from environmental concerns about its production and handling, particularly its role in the creation of toxic by-products. Additionally, fluctuations in demand from industries like water treatment and chemicals, and the need for eco-friendly alternatives, impact market stability.
Government Policy of the market
The Finnish government regulates the chlorine market with a focus on promoting the safe and sustainable production of chlorine, which is used in various industrial applications, including water treatment and chemical manufacturing. Policies aim to reduce the environmental impact of chlorine production through cleaner technologies and encourage the responsible use of chlorine in manufacturing processes.
Key Highlights of the Report:
- Finland Chlorine Market Outlook
- Market Size of Finland Chlorine Market, 2024
- Forecast of Finland Chlorine Market, 2031
- Historical Data and Forecast of Finland Chlorine Revenues & Volume for the Period 2021-2031
- Finland Chlorine Market Trend Evolution
- Finland Chlorine Market Drivers and Challenges
- Finland Chlorine Price Trends
- Finland Chlorine Porter`s Five Forces
- Finland Chlorine Industry Life Cycle
- Historical Data and Forecast of Finland Chlorine Market Revenues & Volume By Application for the Period 2021-2031
- Historical Data and Forecast of Finland Chlorine Market Revenues & Volume By EDC/PVC for the Period 2021-2031
- Historical Data and Forecast of Finland Chlorine Market Revenues & Volume By Isocyanates and Oxygenates for the Period 2021-2031
- Historical Data and Forecast of Finland Chlorine Market Revenues & Volume By Chloromethanes for the Period 2021-2031
- Historical Data and Forecast of Finland Chlorine Market Revenues & Volume By Solvents and Epichlorohydrin for the Period 2021-2031
- Historical Data and Forecast of Finland Chlorine Market Revenues & Volume By Inorganic Chemicals for the Period 2021-2031
- Historical Data and Forecast of Finland Chlorine Market Revenues & Volume By Other Applications for the Period 2021-2031
- Historical Data and Forecast of Finland Chlorine Market Revenues & Volume By End-user for the Period 2021-2031
- Historical Data and Forecast of Finland Chlorine Market Revenues & Volume By Water Treatment for the Period 2021-2031
- Historical Data and Forecast of Finland Chlorine Market Revenues & Volume By Pharmaceutical for the Period 2021-2031
- Historical Data and Forecast of Finland Chlorine Market Revenues & Volume By Chemicals for the Period 2021-2031
- Historical Data and Forecast of Finland Chlorine Market Revenues & Volume By Paper and Pulp for the Period 2021-2031
- Historical Data and Forecast of Finland Chlorine Market Revenues & Volume By Plastic for the Period 2021-2031
- Historical Data and Forecast of Finland Chlorine Market Revenues & Volume By Pesticides for the Period 2021-2031
- Historical Data and Forecast of Finland Chlorine Market Revenues & Volume By Other for the Period 2021-2031
- Finland Chlorine Import Export Trade Statistics
- Market Opportunity Assessment By Application
- Market Opportunity Assessment By End-user
- Finland Chlorine Top Companies Market Share
- Finland Chlorine Competitive Benchmarking By Technical and Operational Parameters
- Finland Chlorine Company Profiles
- Finland Chlorine Key Strategic Recommendations
Frequently Asked Questions About the Market Study (FAQs):
6Wresearch actively monitors the Finland Chlorine Market and publishes its comprehensive annual report, highlighting emerging trends, growth drivers, revenue analysis, and forecast outlook. Our insights help businesses to make data-backed strategic decisions with ongoing market dynamics. Our analysts track relevent industries related to the Finland Chlorine Market, allowing our clients with actionable intelligence and reliable forecasts tailored to emerging regional needs.
Yes, we provide customisation as per your requirements. To learn more, feel free to contact us on sales@6wresearch.com
1 Executive Summary |
2 Introduction |
2.1 Key Highlights of the Report |
2.2 Report Description |
2.3 Market Scope & Segmentation |
2.4 Research Methodology |
2.5 Assumptions |
3 Finland Chlorine Market Overview |
3.1 Finland Country Macro Economic Indicators |
3.2 Finland Chlorine Market Revenues & Volume, 2021 & 2031F |
3.3 Finland Chlorine Market - Industry Life Cycle |
3.4 Finland Chlorine Market - Porter's Five Forces |
3.5 Finland Chlorine Market Revenues & Volume Share, By Application, 2021 & 2031F |
3.6 Finland Chlorine Market Revenues & Volume Share, By End-user, 2021 & 2031F |
4 Finland Chlorine Market Dynamics |
4.1 Impact Analysis |
4.2 Market Drivers |
4.2.1 Increasing demand for chlorine in water treatment applications due to growing concerns about water quality and sanitation |
4.2.2 Growth in the chemical industry in Finland, leading to higher demand for chlorine as a raw material |
4.2.3 Government regulations promoting the use of chlorine for disinfection purposes |
4.3 Market Restraints |
4.3.1 Fluctuating prices of raw materials used in chlorine production, impacting the overall cost of manufacturing |
4.3.2 Environmental concerns related to the use of chlorine and its by-products, leading to stricter regulations and potential limitations on its usage |
5 Finland Chlorine Market Trends |
6 Finland Chlorine Market Segmentations |
6.1 Finland Chlorine Market, By Application |
6.1.1 Overview and Analysis |
6.1.2 Finland Chlorine Market Revenues & Volume, By EDC/PVC, 2021-2031F |
6.1.3 Finland Chlorine Market Revenues & Volume, By Isocyanates and Oxygenates, 2021-2031F |
6.1.4 Finland Chlorine Market Revenues & Volume, By Chloromethanes, 2021-2031F |
6.1.5 Finland Chlorine Market Revenues & Volume, By Solvents and Epichlorohydrin, 2021-2031F |
6.1.6 Finland Chlorine Market Revenues & Volume, By Inorganic Chemicals, 2021-2031F |
6.1.7 Finland Chlorine Market Revenues & Volume, By Other Applications, 2021-2031F |
6.2 Finland Chlorine Market, By End-user |
6.2.1 Overview and Analysis |
6.2.2 Finland Chlorine Market Revenues & Volume, By Water Treatment, 2021-2031F |
6.2.3 Finland Chlorine Market Revenues & Volume, By Pharmaceutical, 2021-2031F |
6.2.4 Finland Chlorine Market Revenues & Volume, By Chemicals, 2021-2031F |
6.2.5 Finland Chlorine Market Revenues & Volume, By Paper and Pulp, 2021-2031F |
6.2.6 Finland Chlorine Market Revenues & Volume, By Plastic, 2021-2031F |
6.2.7 Finland Chlorine Market Revenues & Volume, By Pesticides, 2021-2031F |
7 Finland Chlorine Market Import-Export Trade Statistics |
7.1 Finland Chlorine Market Export to Major Countries |
7.2 Finland Chlorine Market Imports from Major Countries |
8 Finland Chlorine Market Key Performance Indicators |
8.1 Chlorine production capacity utilization rate |
8.2 Number of new water treatment projects utilizing chlorine |
8.3 Compliance rate with environmental regulations for chlorine production and usage |
9 Finland Chlorine Market - Opportunity Assessment |
9.1 Finland Chlorine Market Opportunity Assessment, By Application, 2021 & 2031F |
9.2 Finland Chlorine Market Opportunity Assessment, By End-user, 2021 & 2031F |
10 Finland Chlorine Market - Competitive Landscape |
10.1 Finland Chlorine Market Revenue Share, By Companies, 2024 |
10.2 Finland Chlorine Market Competitive Benchmarking, By Operating and Technical Parameters |
11 Company Profiles |
12 Recommendations | 13 Disclaimer |
Global Go To Market Strategy - 2030
Export potential enables firms to identify high-growth global markets with greater confidence by combining advanced trade intelligence with a structured quantitative methodology. The framework analyzes emerging demand trends and country-level import patterns while integrating macroeconomic and trade datasets such as GDP and population forecasts, bilateral import–export flows, tariff structures, elasticity differentials between developed and developing economies, geographic distance, and import demand projections. Using weighted trade values from 2020–2024 as the base period to project country-to-country export potential for 2030, these inputs are operationalized through calculated drivers such as gravity model parameters, tariff impact factors, and projected GDP per-capita growth. Through an analysis of hidden potentials, demand hotspots, and market conditions that are most favorable to success, this method enables firms to focus on target countries, maximize returns, and global expansion with data, backed by accuracy.
By factoring in the projected importer demand gap that is currently unmet and could be potential opportunity, it identifies the potential for the Exporter (Country) among 190 countries, against the general trade analysis, which identifies the biggest importer or exporter.
To discover high-growth global markets and optimize your business strategy:
Click Here
Pricing
- Single User License$ 1,995
- Department License$ 2,400
- Site License$ 3,120
- Global License$ 3,795

Leadership Perspectives from Industry Events
Search
Thought Leadership and Analyst Meet


Our Clients
6WResearch In News
- India Export Attractiveness Tracker 2026
- India Air Conditioner Market Set for Strong Rebound in 2026 After Weather-Led Correction and GST-Driven Recovery: 6Wresearch
- ADAS in India: How Automatic Emergency Braking, Blind Spot Detection & Driver Monitoring are Transforming Road Safety
- Doha a strategic location for EV manufacturing hub: IPA Qatar
- Demand for luxury TVs surging in the GCC, says Samsung
- Empowering Growth: The Thriving Journey of Bangladesh’s Cable Industry
Latest Reports
- Nicaragua RPG Gaming Market (2026-2032)
- New Zealand RPG Gaming Market (2026-2032)
- Netherlands RPG Gaming Market (2026-2032)
- Nauru RPG Gaming Market (2026-2032)
- Namibia RPG Gaming Market (2026-2032)
- Mozambique RPG Gaming Market (2026-2032)
- Montenegro RPG Gaming Market (2026-2032)
- Mongolia RPG Gaming Market (2026-2032)
- Monaco RPG Gaming Market (2026-2032)
- Micronesia RPG Gaming Market (2026-2032)
Industry Events and Analyst Meet

EV India Expo 2026

HIMTEX 2026

India Refining Summit 2026

India EV Show 2026

EV tech India Expo 2026
Whitepaper
- Middle East & Africa Commercial Security Market Click here to view more.
- Middle East & Africa Fire Safety Systems & Equipment Market Click here to view more.
- GCC Drone Market Click here to view more.
- Middle East Lighting Fixture Market Click here to view more.
- GCC Physical & Perimeter Security Market Click here to view more.