Finland Electronic Grade Sulfuric Acid Market (2026-2032) | Trends, Share, Analysis, Outlook, Segmentation, Industry, Value, Companies, Growth, Forecast, Revenue & Size
Market Forecast By Grade (Parts per trillion (ppt), Parts per billion (ppb)), By Application (Semiconductors, PCB Panels, Pharmaceutical) And Competitive Landscape
| Product Code: ETC5671269 | Publication Date: Nov 2023 | Updated Date: Apr 2026 | Product Type: Market Research Report | |
| Publisher: 6Wresearch | Author: Ravi Bhandari | No. of Pages: 60 | No. of Figures: 30 | No. of Tables: 5 |
Finland Electronic Grade Sulfuric Acid Market Size (2020-2030)
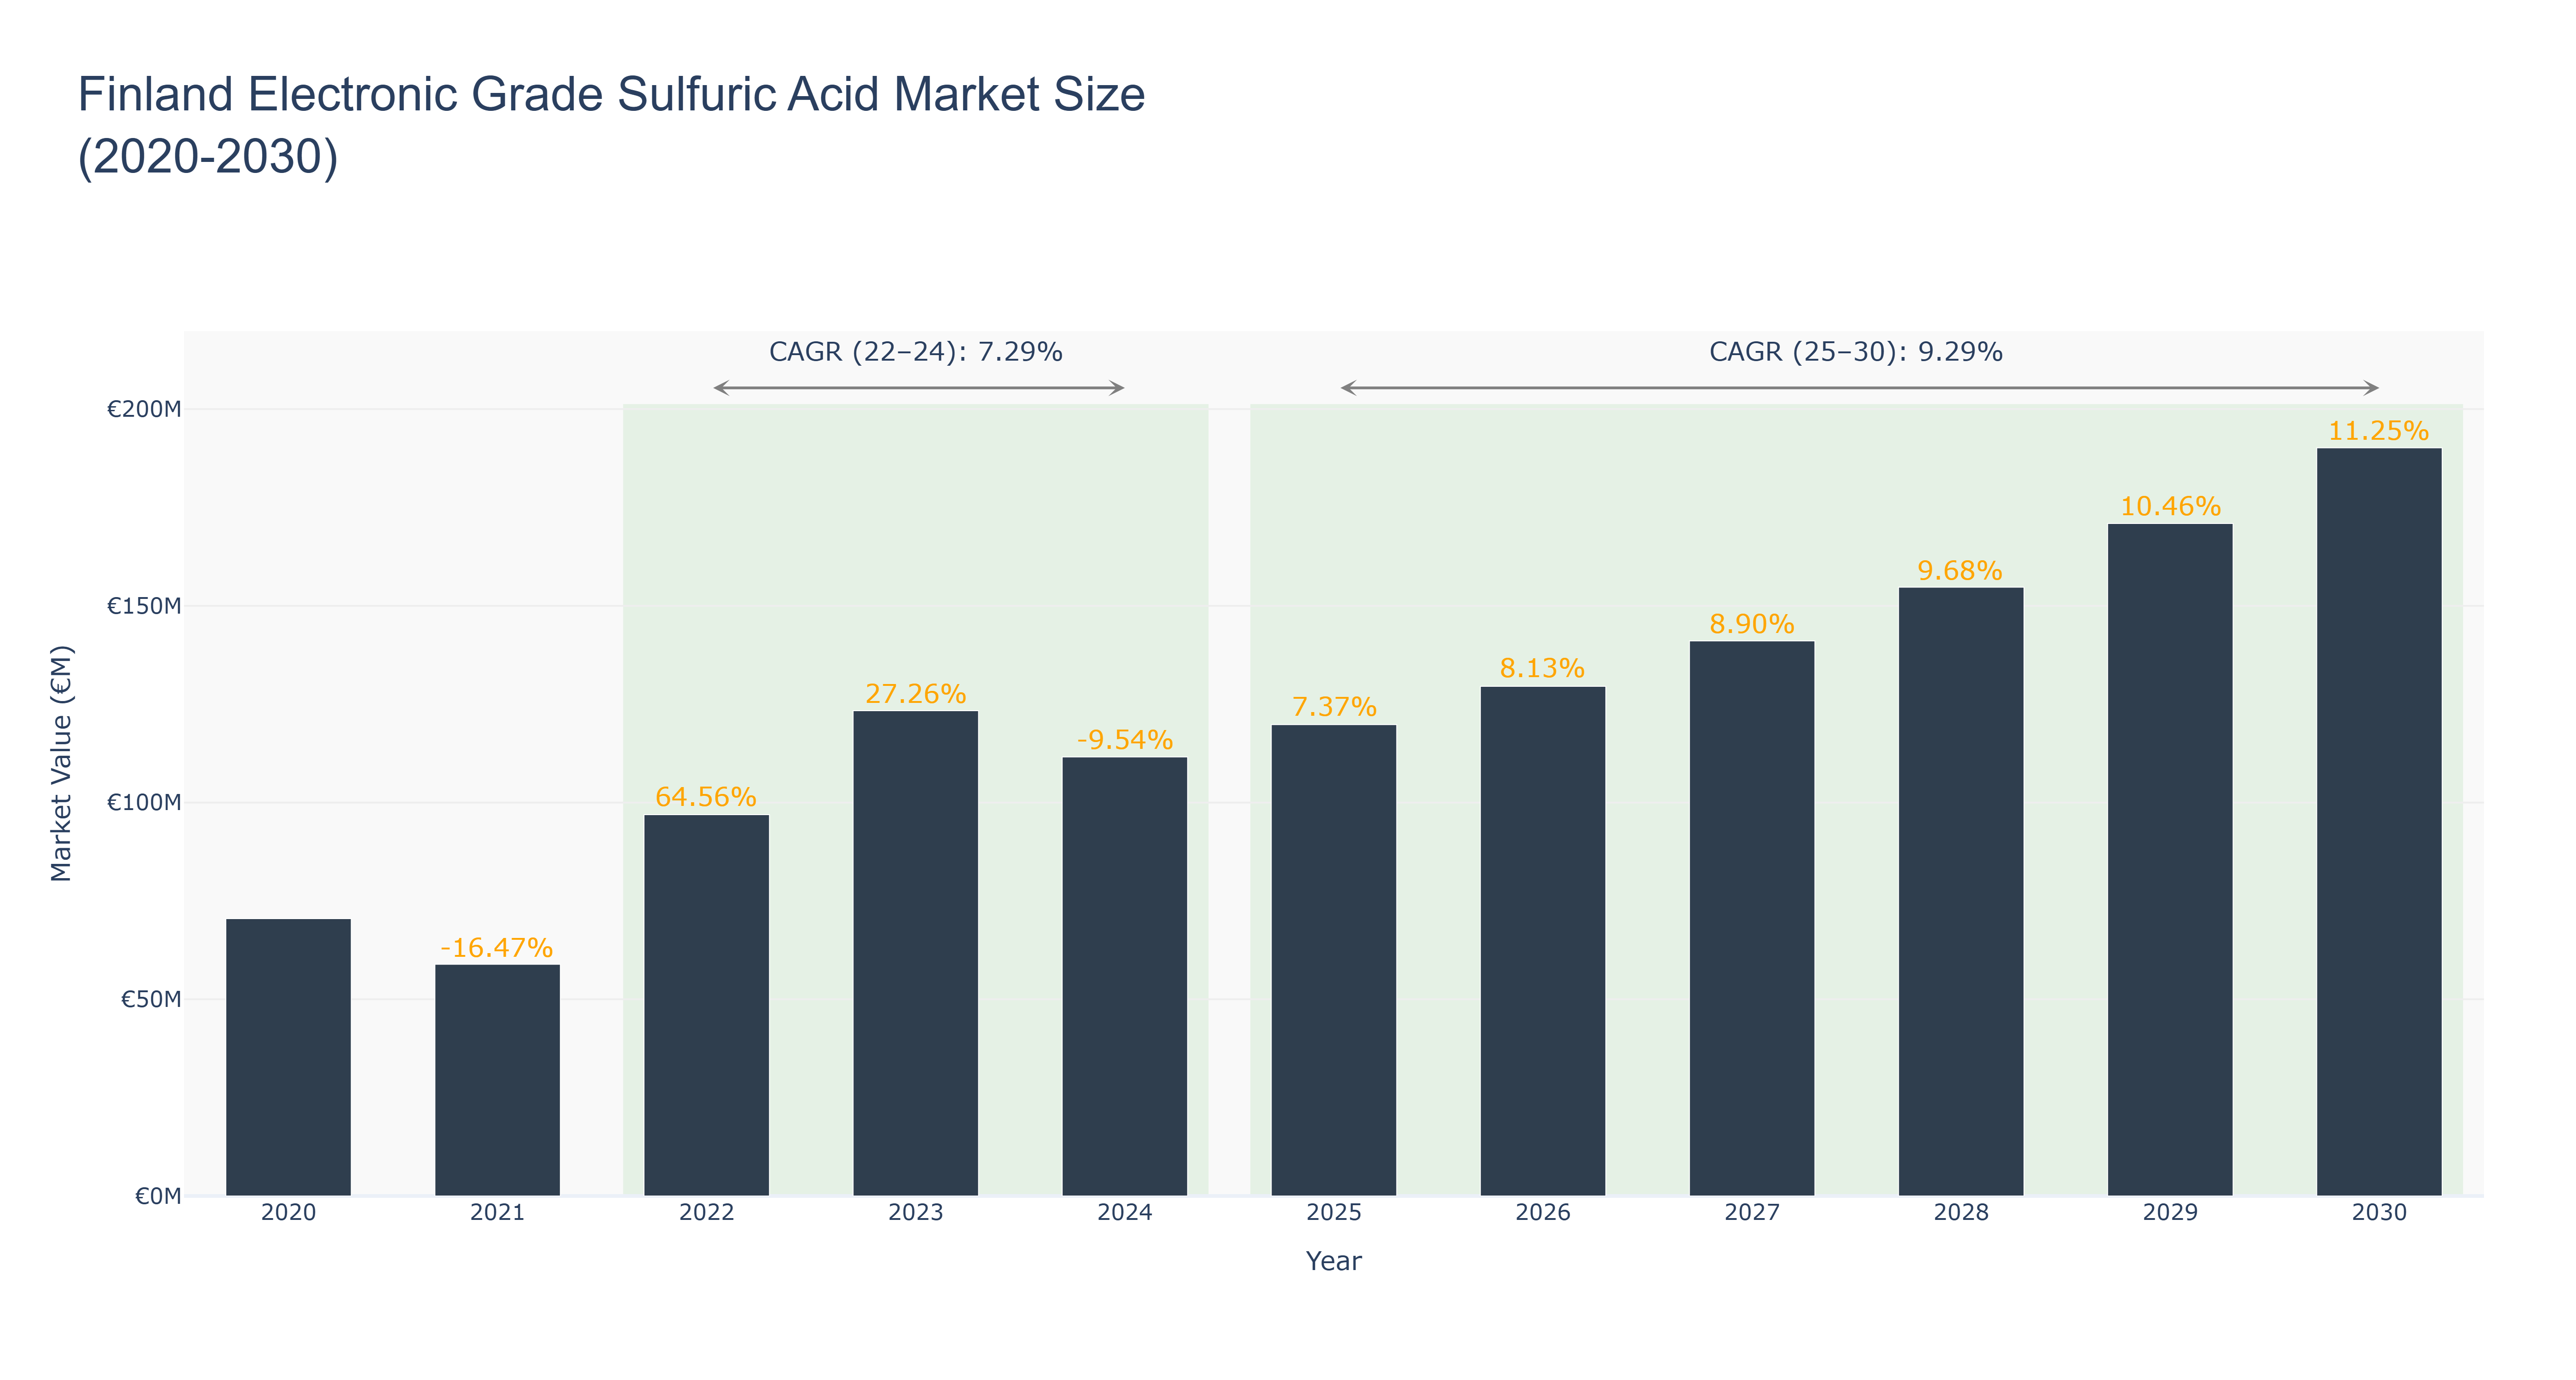
The Finland Electronic Grade Sulfuric Acid Market experienced significant volatility between 2020 and 2024, peaking at €123.35 million in 2023, following a sharp decline of 16.47% in 2021. This fluctuation can be attributed to the pandemic's impact on supply chains and a subsequent recovery in 2022, which saw an impressive growth of 64.56%. The market is projected to stabilize with a CAGR of 9.29% from 2025 to 2030, with the market size expected to reach €190.17 million by 2030. Drivers of growth in the forecasted period include increasing demand for high-purity chemicals in semiconductor manufacturing and advancements in battery technology. Furthermore, ongoing investments in renewable energy and electronic manufacturing in Finland are likely to stimulate market expansion, positioning the country as a key player in the European electronic-grade sulfuric acid landscape.
Finland Electronic Grade Sulfuric Acid Market: Production & Trade Performance (2019-2025)
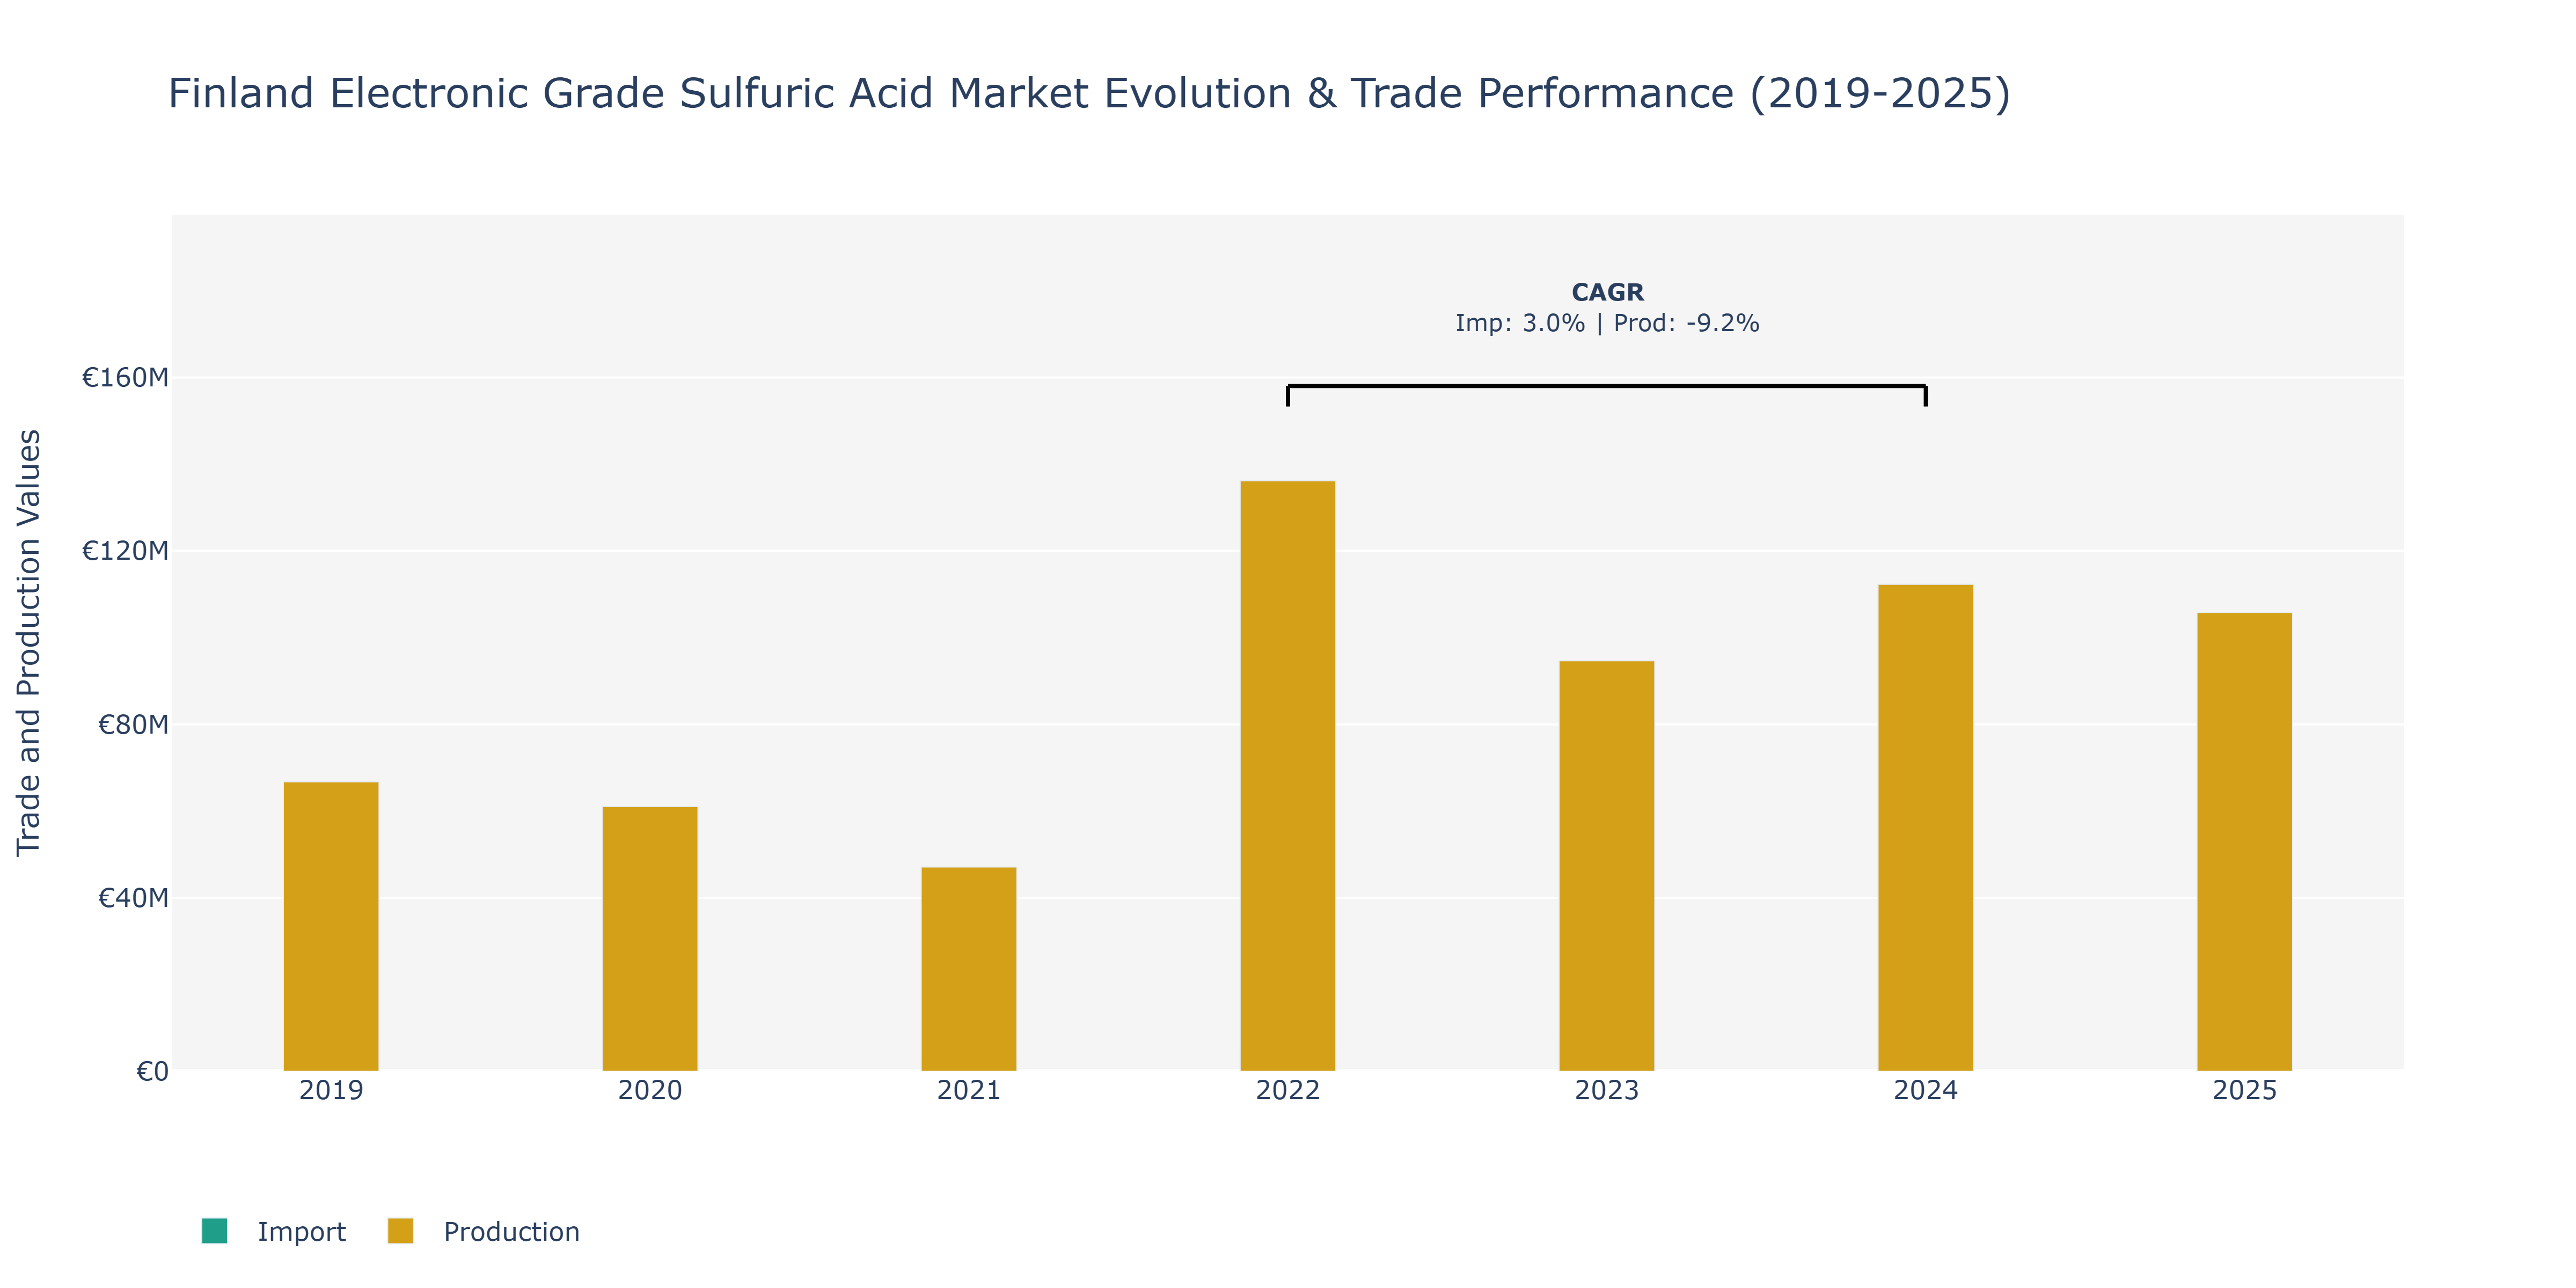
In the Finland Electronic Grade Sulfuric Acid Market, imports experienced fluctuations over the years, starting at €6.87 million in 2019 and declining to €3.88 million in 2021 before reaching €5.41 million in 2025. This market saw a peak in imports in 2023 at €8.27 million. On the other hand, production levels showed a contrasting trend, increasing from €66.75 million in 2019 to a peak of €136.21 million in 2022, before gradually decreasing to €105.81 million in 2025. The notable decline in production from 2022 to 2024 can be attributed to factors such as changes in demand patterns, technological advancements impacting production efficiency, and global market dynamics affecting supply chain management. As the market evolves, companies may need to adapt their production strategies to align with shifting consumer preferences and regulatory requirements to maintain a competitive edge.
Key Highlights of the Report:
- Finland Electronic Grade Sulfuric Acid Market Outlook
- Market Size of Finland Electronic Grade Sulfuric Acid Market, 2025
- Forecast of Finland Electronic Grade Sulfuric Acid Market, 2032
- Historical Data and Forecast of Finland Electronic Grade Sulfuric Acid Revenues & Volume for the Period 2022 - 2032F
- Finland Electronic Grade Sulfuric Acid Market Trend Evolution
- Finland Electronic Grade Sulfuric Acid Market Drivers and Challenges
- Finland Electronic Grade Sulfuric Acid Price Trends
- Finland Electronic Grade Sulfuric Acid Porter`s Five Forces
- Finland Electronic Grade Sulfuric Acid Industry Life Cycle
- Historical Data and Forecast of Finland Electronic Grade Sulfuric Acid Market Revenues & Volume By Grade for the Period 2022 - 2032F
- Historical Data and Forecast of Finland Electronic Grade Sulfuric Acid Market Revenues & Volume By Parts per trillion (ppt) for the Period 2022 - 2032F
- Historical Data and Forecast of Finland Electronic Grade Sulfuric Acid Market Revenues & Volume By Parts per billion (ppb) for the Period 2022 - 2032F
- Historical Data and Forecast of Finland Electronic Grade Sulfuric Acid Market Revenues & Volume By Application for the Period 2022 - 2032F
- Historical Data and Forecast of Finland Electronic Grade Sulfuric Acid Market Revenues & Volume By Semiconductors for the Period 2022 - 2032F
- Historical Data and Forecast of Finland Electronic Grade Sulfuric Acid Market Revenues & Volume By PCB Panels for the Period 2022 - 2032F
- Historical Data and Forecast of Finland Electronic Grade Sulfuric Acid Market Revenues & Volume By Pharmaceutical for the Period 2022 - 2032F
- Finland Electronic Grade Sulfuric Acid Import Export Trade Statistics
- Market Opportunity Assessment By Grade
- Market Opportunity Assessment By Application
- Finland Electronic Grade Sulfuric Acid Top Companies Market Share
- Finland Electronic Grade Sulfuric Acid Competitive Benchmarking By Technical and Operational Parameters
- Finland Electronic Grade Sulfuric Acid Company Profiles
- Finland Electronic Grade Sulfuric Acid Key Strategic Recommendations
Frequently Asked Questions About the Market Study (FAQs):
6Wresearch actively monitors the Finland Electronic Grade Sulfuric Acid Market and publishes its comprehensive annual report, highlighting emerging trends, growth drivers, revenue analysis, and forecast outlook. Our insights help businesses to make data-backed strategic decisions with ongoing market dynamics. Our analysts track relevent industries related to the Finland Electronic Grade Sulfuric Acid Market, allowing our clients with actionable intelligence and reliable forecasts tailored to emerging regional needs.
Yes, we provide customisation as per your requirements. To learn more, feel free to contact us on sales@6wresearch.com
1 Executive Summary |
2 Introduction |
2.1 Key Highlights of the Report |
2.2 Report Description |
2.3 Market Scope & Segmentation |
2.4 Research Methodology |
2.5 Assumptions |
3 Finland Electronic Grade Sulfuric Acid Market Overview |
3.1 Finland Country Macro Economic Indicators |
3.2 Finland Electronic Grade Sulfuric Acid Market Revenues & Volume, 2022 & 2032F |
3.3 Finland Electronic Grade Sulfuric Acid Market - Industry Life Cycle |
3.4 Finland Electronic Grade Sulfuric Acid Market - Porter's Five Forces |
3.5 Finland Electronic Grade Sulfuric Acid Market Revenues & Volume Share, By Grade, 2022 & 2032F |
3.6 Finland Electronic Grade Sulfuric Acid Market Revenues & Volume Share, By Application, 2022 & 2032F |
4 Finland Electronic Grade Sulfuric Acid Market Dynamics |
4.1 Impact Analysis |
4.2 Market Drivers |
4.2.1 Increasing demand for electronic components in various industries |
4.2.2 Growing adoption of electronic grade sulfuric acid in semiconductor manufacturing |
4.2.3 Technological advancements leading to higher purity requirements in electronic grade sulfuric acid production |
4.3 Market Restraints |
4.3.1 Fluctuating prices of raw materials such as sulfur and sulfur dioxide |
4.3.2 Stringent regulations regarding the manufacturing and handling of sulfuric acid |
4.3.3 Competition from alternative materials or processes in electronic component manufacturing |
5 Finland Electronic Grade Sulfuric Acid Market Trends |
6 Finland Electronic Grade Sulfuric Acid Market Segmentations |
6.1 Finland Electronic Grade Sulfuric Acid Market, By Grade |
6.1.1 Overview and Analysis |
6.1.2 Finland Electronic Grade Sulfuric Acid Market Revenues & Volume, By Parts per trillion (ppt), 2022 - 2032F |
6.1.3 Finland Electronic Grade Sulfuric Acid Market Revenues & Volume, By Parts per billion (ppb), 2022 - 2032F |
6.2 Finland Electronic Grade Sulfuric Acid Market, By Application |
6.2.1 Overview and Analysis |
6.2.2 Finland Electronic Grade Sulfuric Acid Market Revenues & Volume, By Semiconductors, 2022 - 2032F |
6.2.3 Finland Electronic Grade Sulfuric Acid Market Revenues & Volume, By PCB Panels, 2022 - 2032F |
6.2.4 Finland Electronic Grade Sulfuric Acid Market Revenues & Volume, By Pharmaceutical, 2022 - 2032F |
7 Finland Electronic Grade Sulfuric Acid Market Import-Export Trade Statistics |
7.1 Finland Electronic Grade Sulfuric Acid Market Export to Major Countries |
7.2 Finland Electronic Grade Sulfuric Acid Market Imports from Major Countries |
8 Finland Electronic Grade Sulfuric Acid Market Key Performance Indicators |
8.1 Average purity level of electronic grade sulfuric acid produced |
8.2 Number of new applications or industries adopting electronic grade sulfuric acid |
8.3 Research and development investment in improving the quality of electronic grade sulfuric acid |
9 Finland Electronic Grade Sulfuric Acid Market - Opportunity Assessment |
9.1 Finland Electronic Grade Sulfuric Acid Market Opportunity Assessment, By Grade, 2022 & 2032F |
9.2 Finland Electronic Grade Sulfuric Acid Market Opportunity Assessment, By Application, 2022 & 2032F |
10 Finland Electronic Grade Sulfuric Acid Market - Competitive Landscape |
10.1 Finland Electronic Grade Sulfuric Acid Market Revenue Share, By Companies, 2025 |
10.2 Finland Electronic Grade Sulfuric Acid Market Competitive Benchmarking, By Operating and Technical Parameters |
11 Company Profiles |
12 Recommendations | 13 Disclaimer |
Global Go To Market Strategy - 2030
Export potential enables firms to identify high-growth global markets with greater confidence by combining advanced trade intelligence with a structured quantitative methodology. The framework analyzes emerging demand trends and country-level import patterns while integrating macroeconomic and trade datasets such as GDP and population forecasts, bilateral import–export flows, tariff structures, elasticity differentials between developed and developing economies, geographic distance, and import demand projections. Using weighted trade values from 2020–2024 as the base period to project country-to-country export potential for 2030, these inputs are operationalized through calculated drivers such as gravity model parameters, tariff impact factors, and projected GDP per-capita growth. Through an analysis of hidden potentials, demand hotspots, and market conditions that are most favorable to success, this method enables firms to focus on target countries, maximize returns, and global expansion with data, backed by accuracy.
By factoring in the projected importer demand gap that is currently unmet and could be potential opportunity, it identifies the potential for the Exporter (Country) among 190 countries, against the general trade analysis, which identifies the biggest importer or exporter.
To discover high-growth global markets and optimize your business strategy:
Click Here
Pricing
- Single User License$ 1,995
- Department License$ 2,400
- Site License$ 3,120
- Global License$ 3,795

Leadership Perspectives from Industry Events
Search
Thought Leadership and Analyst Meet


Our Clients
6WResearch In News
- India Export Attractiveness Tracker 2026
- India Air Conditioner Market Set for Strong Rebound in 2026 After Weather-Led Correction and GST-Driven Recovery: 6Wresearch
- ADAS in India: How Automatic Emergency Braking, Blind Spot Detection & Driver Monitoring are Transforming Road Safety
- Doha a strategic location for EV manufacturing hub: IPA Qatar
- Demand for luxury TVs surging in the GCC, says Samsung
- Empowering Growth: The Thriving Journey of Bangladesh’s Cable Industry
Latest Reports
- Nicaragua RPG Gaming Market (2026-2032)
- New Zealand RPG Gaming Market (2026-2032)
- Netherlands RPG Gaming Market (2026-2032)
- Nauru RPG Gaming Market (2026-2032)
- Namibia RPG Gaming Market (2026-2032)
- Mozambique RPG Gaming Market (2026-2032)
- Montenegro RPG Gaming Market (2026-2032)
- Mongolia RPG Gaming Market (2026-2032)
- Monaco RPG Gaming Market (2026-2032)
- Micronesia RPG Gaming Market (2026-2032)
Industry Events and Analyst Meet

EV India Expo 2026

HIMTEX 2026

India Refining Summit 2026

India EV Show 2026

EV tech India Expo 2026
Whitepaper
- Middle East & Africa Commercial Security Market Click here to view more.
- Middle East & Africa Fire Safety Systems & Equipment Market Click here to view more.
- GCC Drone Market Click here to view more.
- Middle East Lighting Fixture Market Click here to view more.
- GCC Physical & Perimeter Security Market Click here to view more.