Finland Hydraulic Turbines Market (2025-2031) | Outlook, Size, Forecast, Revenue, Trends, Industry, Companies, Value, Segmentation, Share, Analysis & Growth
Market Forecast By Designs (Impulse Turbine, Reaction Turbine), By Capacity (Less Than 1000 kW, Between 1000 - 10000 kW, More Than 10000 kW), By Applications (Marine, Oil and Gas, Power Storage and Generation, Others) And Competitive Landscape
| Product Code: ETC5524304 | Publication Date: Nov 2023 | Updated Date: Apr 2026 | Product Type: Market Research Report | |
| Publisher: 6Wresearch | Author: Ravi Bhandari | No. of Pages: 60 | No. of Figures: 30 | No. of Tables: 5 |
Finland Hydraulic Turbines Market Size (2020-2030)
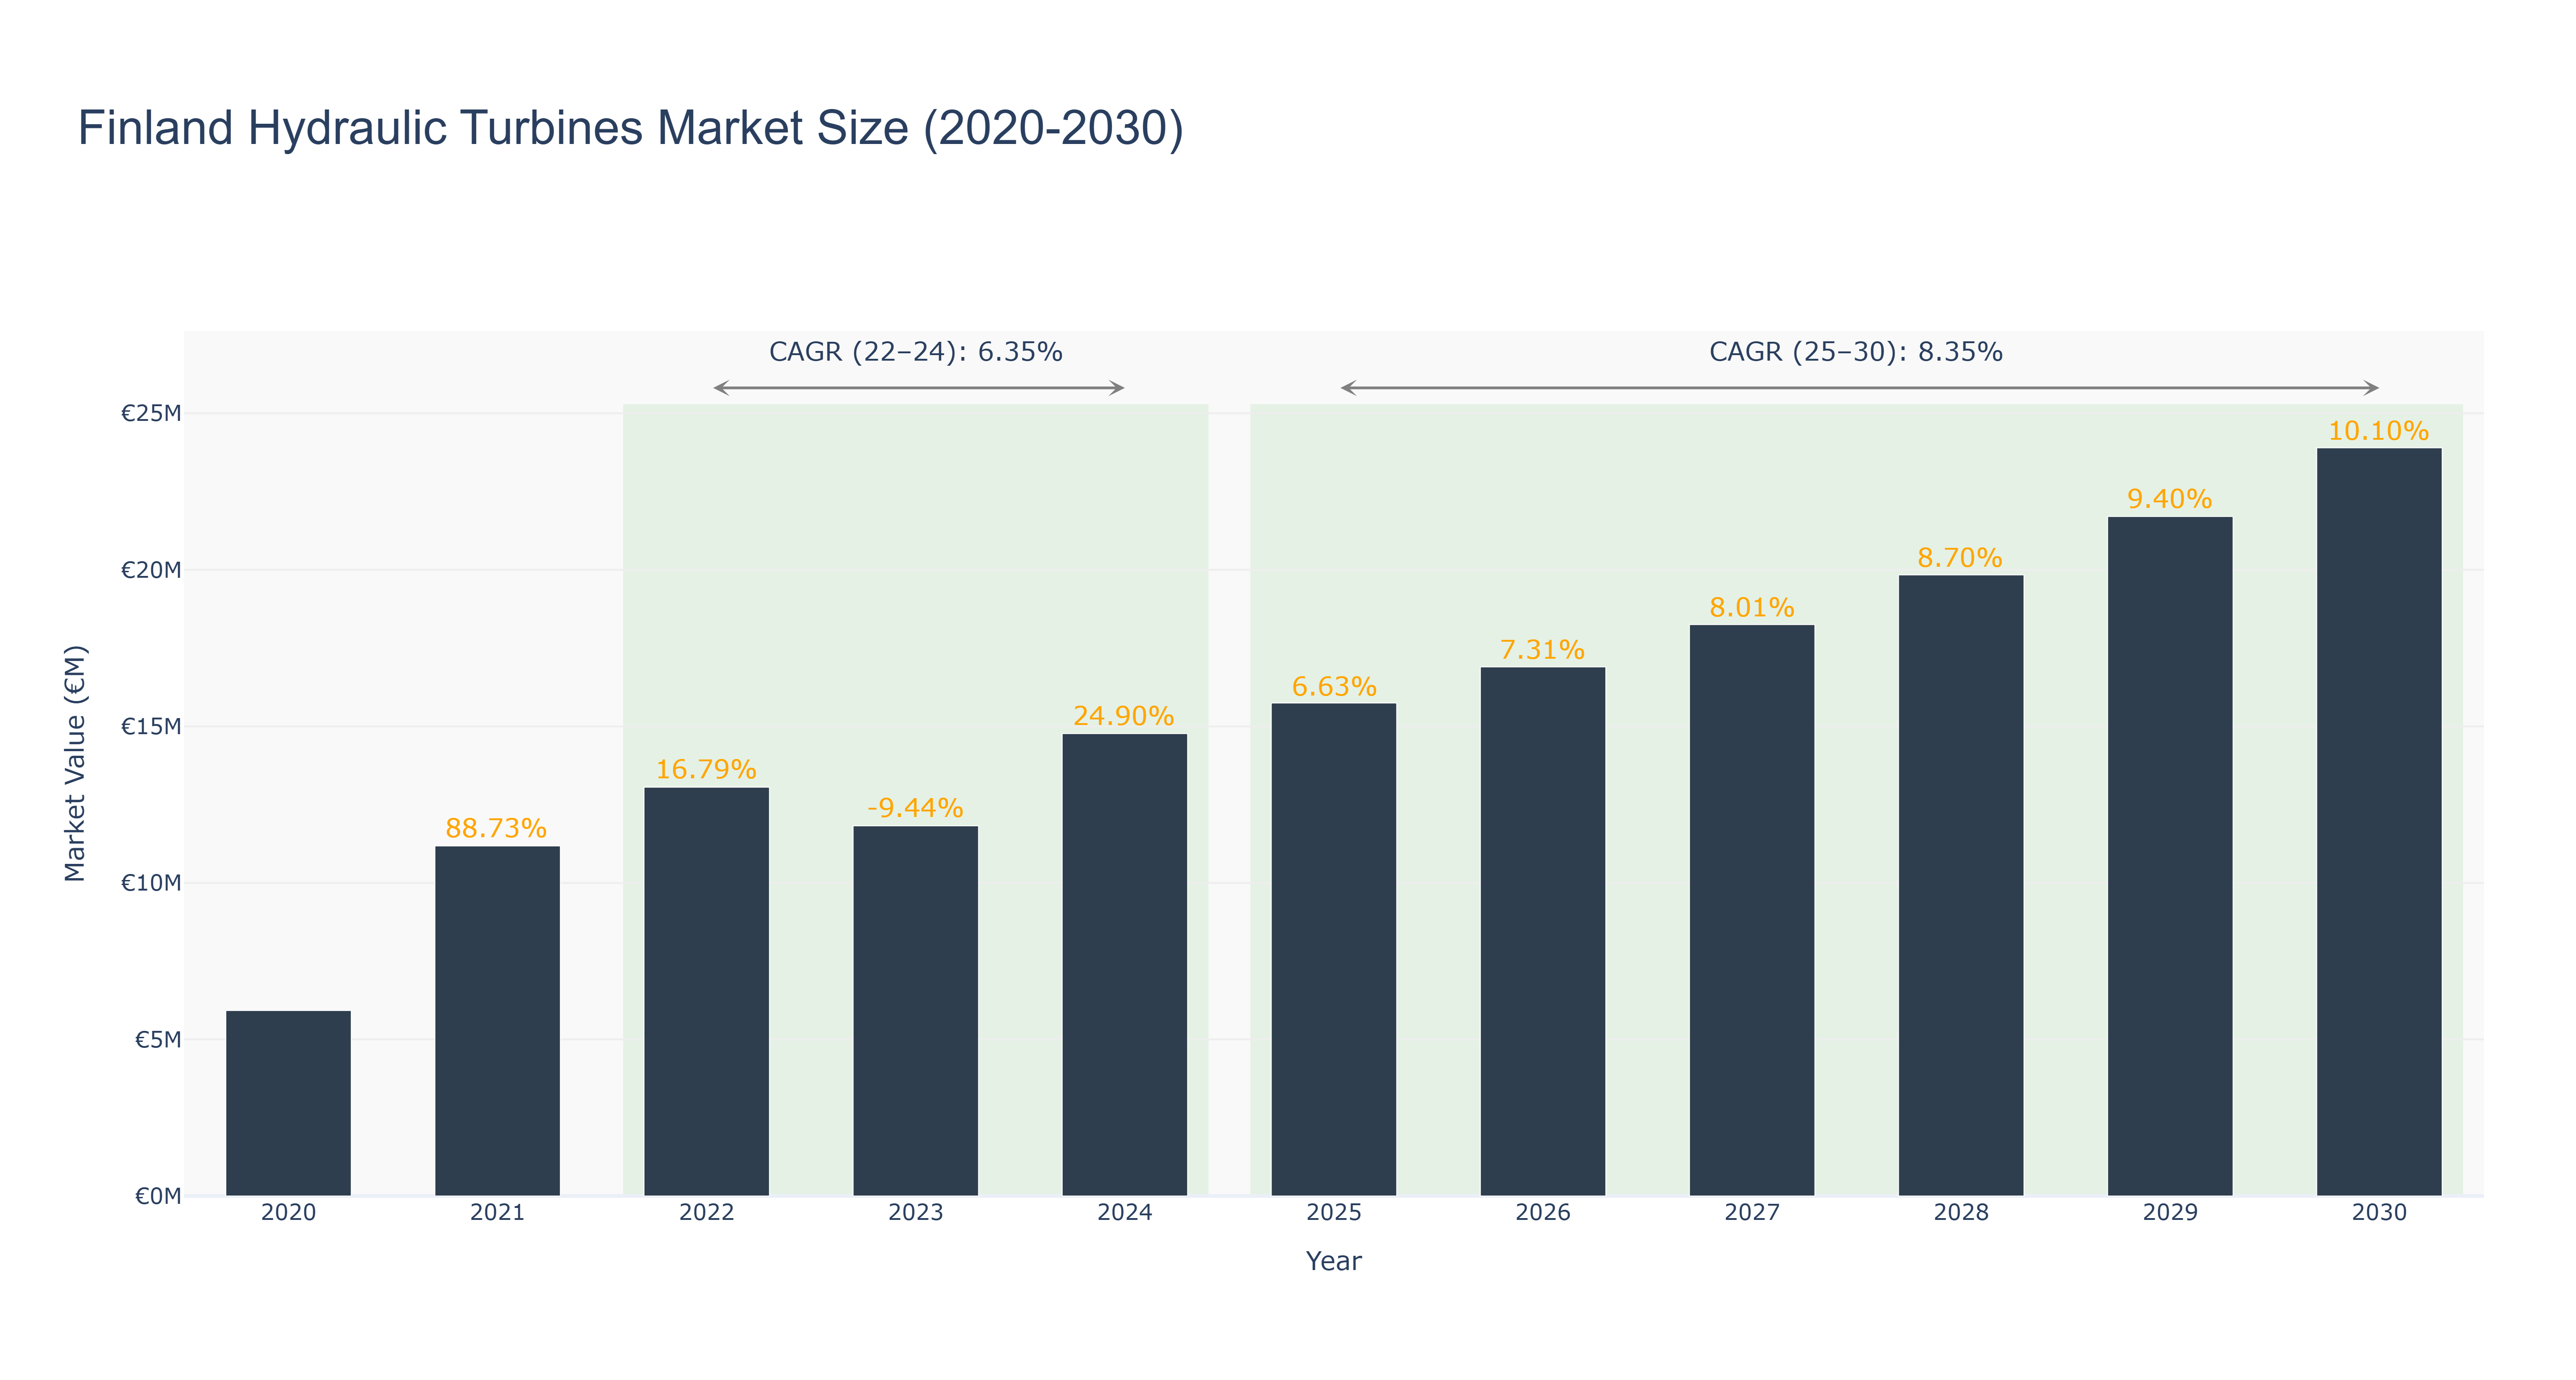
Finland Hydraulic Turbines Market has shown a positive growth trend over the years. The peak market size of €23.90 million is forecasted for 2030. The actual market size has increased steadily from €5.92 million in 2020 to €14.77 million in 2024. The market is expected to continue its growth trajectory, reaching €23.90 million by 2030, with a CAGR of 8.35% from 2025 to 2030. The market experienced a slight dip in 2023 due to external economic factors affecting investment in renewable energy sources. However, the market rebounded swiftly due to increased government support and technological advancements in the sector. Looking ahead, Finland is set to launch a new national energy strategy focusing on further development of renewable energy sources, which will likely drive the growth of the hydraulic turbines market in the country.
Finland Hydraulic Turbines Market: Production & Trade Performance (2019-2025)
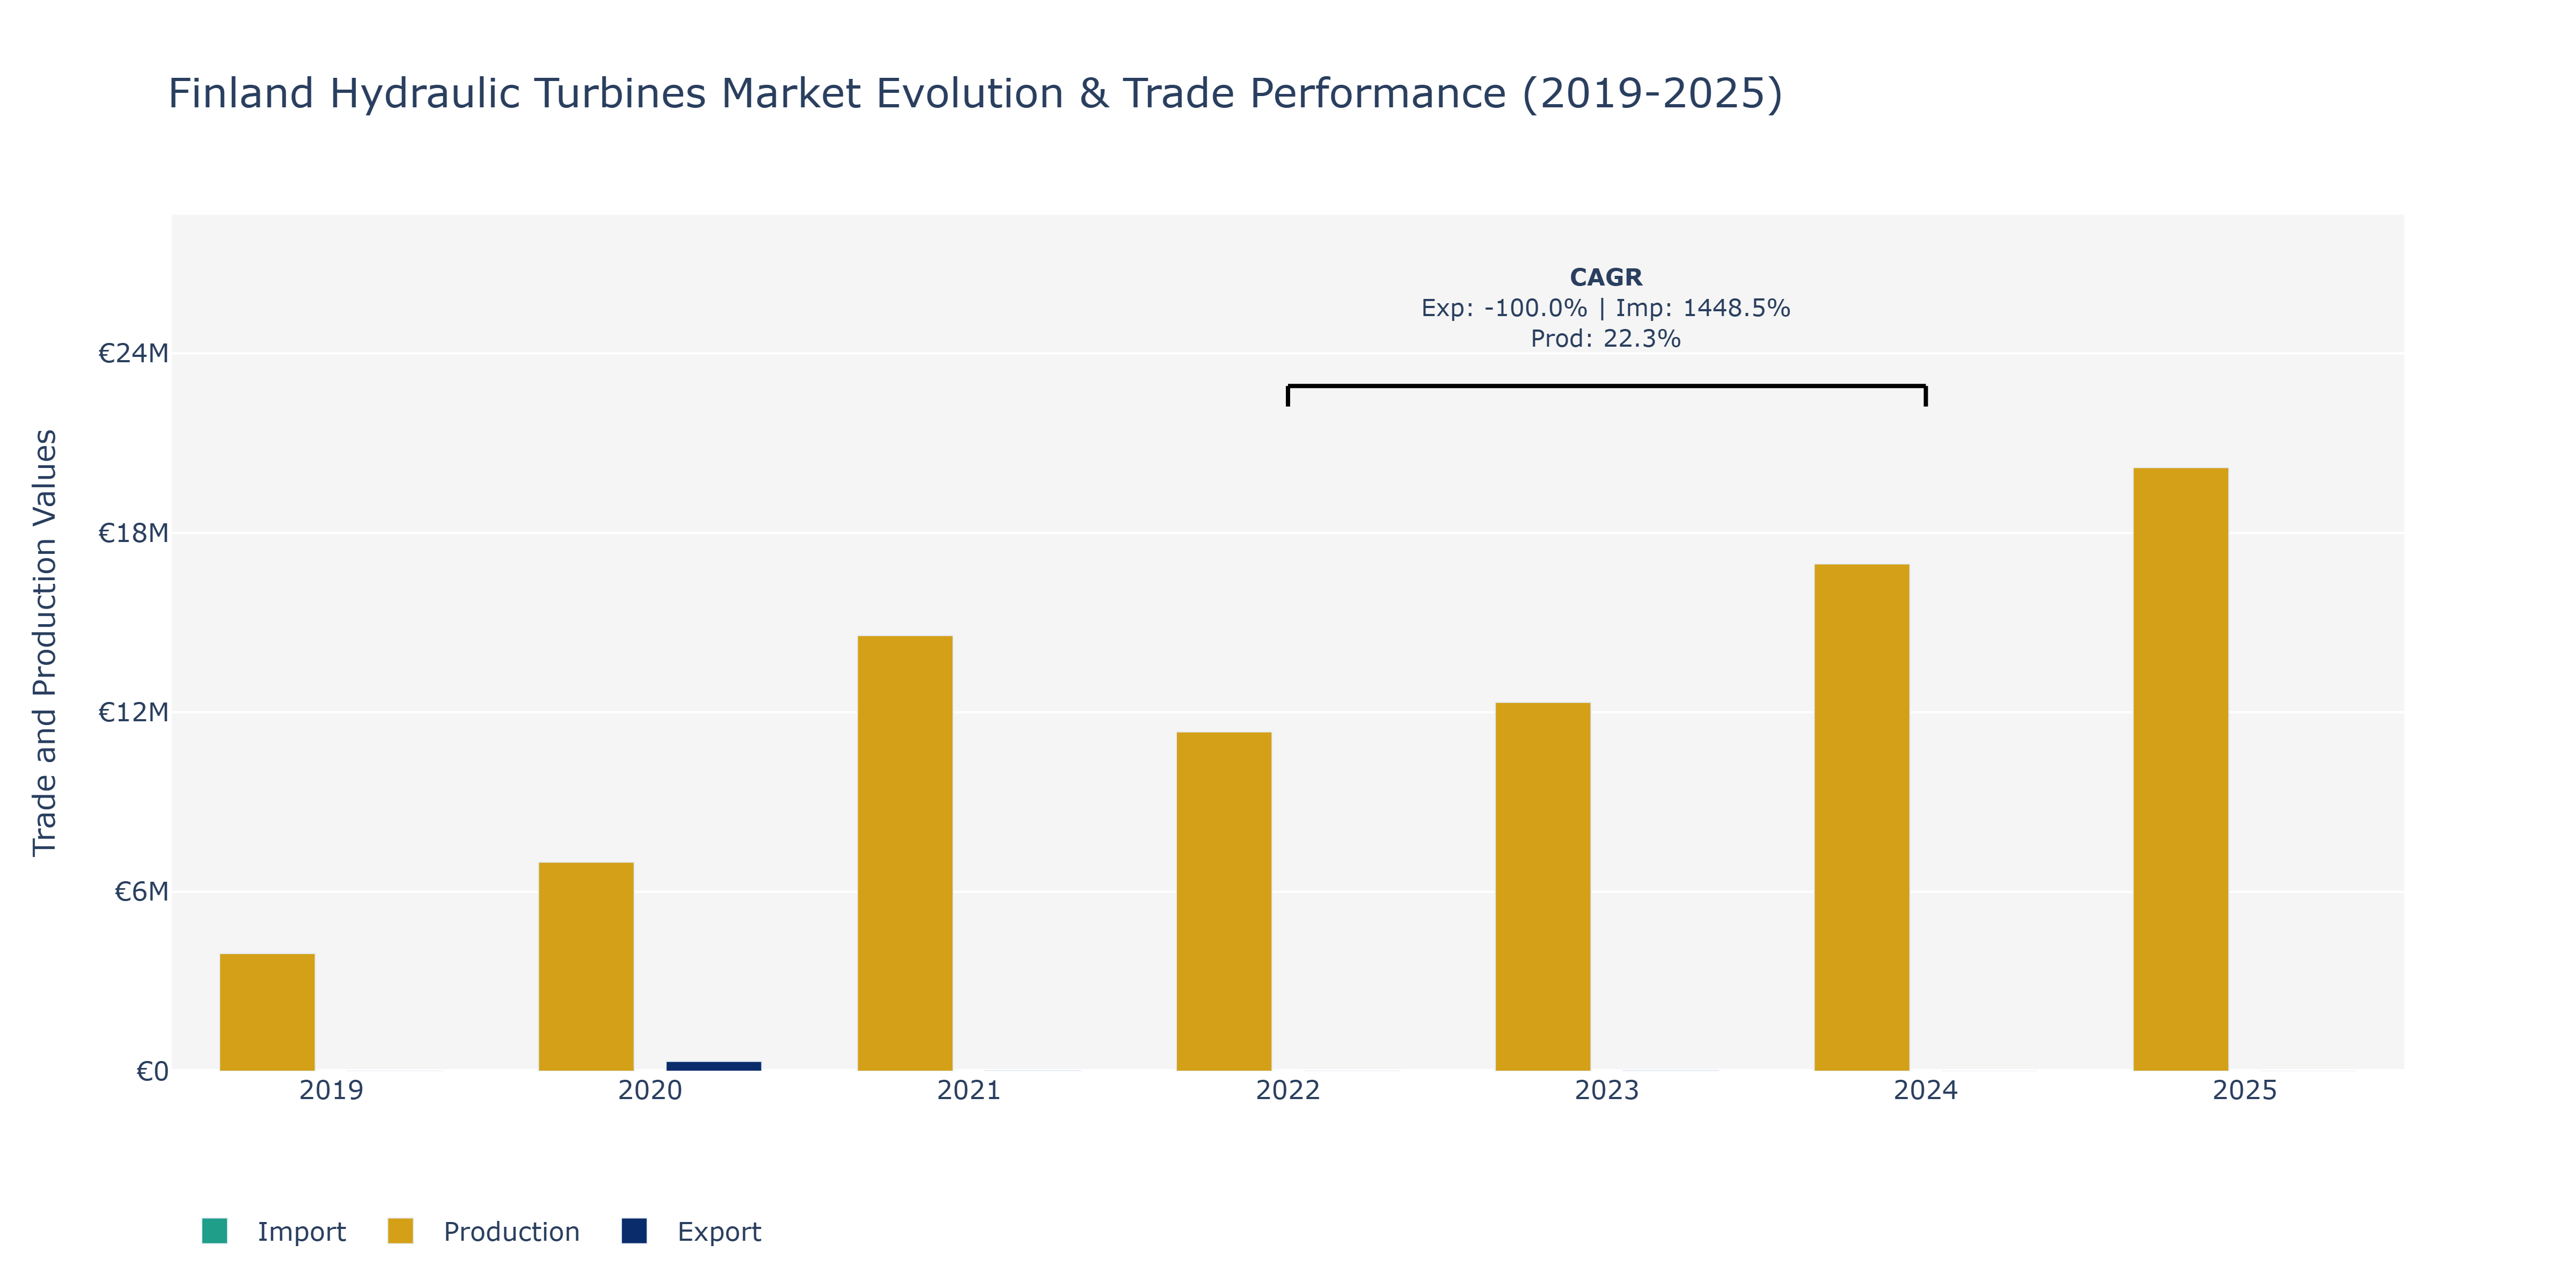
Between 2019 and 2025, Finland's Hydraulic Turbines Market demonstrated noteworthy shifts in the dynamics of exports, imports, and production. Exports saw a substantial spike from €6.72 thousand in 2019 to a peak of €327.01 thousand in 2020, before declining to €20.18 thousand in 2021 and gradually stabilizing around €25.44 thousand in 2023. Imports surged from €279.08 thousand in 2019 to €272.43 thousand in 2025, reaching a peak in 2020 at €767.83 thousand. Production showcased a continuous upward trend, rising to €20.18 billion in 2021, and hitting €20.18 billion in 2025. The fluctuations in exports and imports could be attributed to global market demand fluctuations, trade policies, and industry competitiveness. The consistent production growth may be a result of increased domestic consumption, technological advancements, and government support for renewable energy sources, aligning with the global push towards sustainable power generation methods.
Key Highlights of the Report:
- Finland Hydraulic Turbines Market Outlook
- Market Size of Finland Hydraulic Turbines Market, 2024
- Forecast of Finland Hydraulic Turbines Market, 2031
- Historical Data and Forecast of Finland Hydraulic Turbines Revenues & Volume for the Period 2021-2031
- Finland Hydraulic Turbines Market Trend Evolution
- Finland Hydraulic Turbines Market Drivers and Challenges
- Finland Hydraulic Turbines Price Trends
- Finland Hydraulic Turbines Porter`s Five Forces
- Finland Hydraulic Turbines Industry Life Cycle
- Historical Data and Forecast of Finland Hydraulic Turbines Market Revenues & Volume By Designs for the Period 2021-2031
- Historical Data and Forecast of Finland Hydraulic Turbines Market Revenues & Volume By Impulse Turbine for the Period 2021-2031
- Historical Data and Forecast of Finland Hydraulic Turbines Market Revenues & Volume By Reaction Turbine for the Period 2021-2031
- Historical Data and Forecast of Finland Hydraulic Turbines Market Revenues & Volume By Capacity for the Period 2021-2031
- Historical Data and Forecast of Finland Hydraulic Turbines Market Revenues & Volume By Less Than 1000 kW for the Period 2021-2031
- Historical Data and Forecast of Finland Hydraulic Turbines Market Revenues & Volume By Between 1000 - 10000 kW for the Period 2021-2031
- Historical Data and Forecast of Finland Hydraulic Turbines Market Revenues & Volume By More Than 10000 kW for the Period 2021-2031
- Historical Data and Forecast of Finland Hydraulic Turbines Market Revenues & Volume By Applications for the Period 2021-2031
- Historical Data and Forecast of Finland Hydraulic Turbines Market Revenues & Volume By Marine for the Period 2021-2031
- Historical Data and Forecast of Finland Hydraulic Turbines Market Revenues & Volume By Oil and Gas for the Period 2021-2031
- Historical Data and Forecast of Finland Hydraulic Turbines Market Revenues & Volume By Power Storage and Generation for the Period 2021-2031
- Historical Data and Forecast of Finland Hydraulic Turbines Market Revenues & Volume By Others for the Period 2021-2031
- Finland Hydraulic Turbines Import Export Trade Statistics
- Market Opportunity Assessment By Designs
- Market Opportunity Assessment By Capacity
- Market Opportunity Assessment By Applications
- Finland Hydraulic Turbines Top Companies Market Share
- Finland Hydraulic Turbines Competitive Benchmarking By Technical and Operational Parameters
- Finland Hydraulic Turbines Company Profiles
- Finland Hydraulic Turbines Key Strategic Recommendations
Frequently Asked Questions About the Market Study (FAQs):
6Wresearch actively monitors the Finland Hydraulic Turbines Market and publishes its comprehensive annual report, highlighting emerging trends, growth drivers, revenue analysis, and forecast outlook. Our insights help businesses to make data-backed strategic decisions with ongoing market dynamics. Our analysts track relevent industries related to the Finland Hydraulic Turbines Market, allowing our clients with actionable intelligence and reliable forecasts tailored to emerging regional needs.
Yes, we provide customisation as per your requirements. To learn more, feel free to contact us on sales@6wresearch.com
1 Executive Summary |
2 Introduction |
2.1 Key Highlights of the Report |
2.2 Report Description |
2.3 Market Scope & Segmentation |
2.4 Research Methodology |
2.5 Assumptions |
3 Finland Hydraulic Turbines Market Overview |
3.1 Finland Country Macro Economic Indicators |
3.2 Finland Hydraulic Turbines Market Revenues & Volume, 2021 & 2031F |
3.3 Finland Hydraulic Turbines Market - Industry Life Cycle |
3.4 Finland Hydraulic Turbines Market - Porter's Five Forces |
3.5 Finland Hydraulic Turbines Market Revenues & Volume Share, By Designs, 2021 & 2031F |
3.6 Finland Hydraulic Turbines Market Revenues & Volume Share, By Capacity, 2021 & 2031F |
3.7 Finland Hydraulic Turbines Market Revenues & Volume Share, By Applications, 2021 & 2031F |
4 Finland Hydraulic Turbines Market Dynamics |
4.1 Impact Analysis |
4.2 Market Drivers |
4.2.1 Increasing focus on renewable energy sources, leading to a higher demand for sustainable hydropower solutions. |
4.2.2 Government initiatives promoting the use of hydropower as a clean energy source. |
4.2.3 Technological advancements in hydraulic turbine design and efficiency, making them more attractive for energy generation. |
4.3 Market Restraints |
4.3.1 High initial investment costs associated with installing hydraulic turbines. |
4.3.2 Environmental concerns and regulations regarding the impact of hydropower projects on ecosystems. |
4.3.3 Competition from other renewable energy sources such as wind and solar power. |
5 Finland Hydraulic Turbines Market Trends |
6 Finland Hydraulic Turbines Market Segmentations |
6.1 Finland Hydraulic Turbines Market, By Designs |
6.1.1 Overview and Analysis |
6.1.2 Finland Hydraulic Turbines Market Revenues & Volume, By Impulse Turbine, 2021-2031F |
6.1.3 Finland Hydraulic Turbines Market Revenues & Volume, By Reaction Turbine, 2021-2031F |
6.2 Finland Hydraulic Turbines Market, By Capacity |
6.2.1 Overview and Analysis |
6.2.2 Finland Hydraulic Turbines Market Revenues & Volume, By Less Than 1000 kW, 2021-2031F |
6.2.3 Finland Hydraulic Turbines Market Revenues & Volume, By Between 1000 - 10000 kW, 2021-2031F |
6.2.4 Finland Hydraulic Turbines Market Revenues & Volume, By More Than 10000 kW, 2021-2031F |
6.3 Finland Hydraulic Turbines Market, By Applications |
6.3.1 Overview and Analysis |
6.3.2 Finland Hydraulic Turbines Market Revenues & Volume, By Marine, 2021-2031F |
6.3.3 Finland Hydraulic Turbines Market Revenues & Volume, By Oil and Gas, 2021-2031F |
6.3.4 Finland Hydraulic Turbines Market Revenues & Volume, By Power Storage and Generation, 2021-2031F |
6.3.5 Finland Hydraulic Turbines Market Revenues & Volume, By Others, 2021-2031F |
7 Finland Hydraulic Turbines Market Import-Export Trade Statistics |
7.1 Finland Hydraulic Turbines Market Export to Major Countries |
7.2 Finland Hydraulic Turbines Market Imports from Major Countries |
8 Finland Hydraulic Turbines Market Key Performance Indicators |
8.1 Average capacity utilization rate of hydraulic turbines in Finland. |
8.2 Number of new hydropower projects approved or initiated. |
8.3 Investment in research and development for improving hydraulic turbine efficiency. |
9 Finland Hydraulic Turbines Market - Opportunity Assessment |
9.1 Finland Hydraulic Turbines Market Opportunity Assessment, By Designs, 2021 & 2031F |
9.2 Finland Hydraulic Turbines Market Opportunity Assessment, By Capacity, 2021 & 2031F |
9.3 Finland Hydraulic Turbines Market Opportunity Assessment, By Applications, 2021 & 2031F |
10 Finland Hydraulic Turbines Market - Competitive Landscape |
10.1 Finland Hydraulic Turbines Market Revenue Share, By Companies, 2024 |
10.2 Finland Hydraulic Turbines Market Competitive Benchmarking, By Operating and Technical Parameters |
11 Company Profiles |
12 Recommendations | 13 Disclaimer |
Global Go To Market Strategy - 2030
Export potential enables firms to identify high-growth global markets with greater confidence by combining advanced trade intelligence with a structured quantitative methodology. The framework analyzes emerging demand trends and country-level import patterns while integrating macroeconomic and trade datasets such as GDP and population forecasts, bilateral import–export flows, tariff structures, elasticity differentials between developed and developing economies, geographic distance, and import demand projections. Using weighted trade values from 2020–2024 as the base period to project country-to-country export potential for 2030, these inputs are operationalized through calculated drivers such as gravity model parameters, tariff impact factors, and projected GDP per-capita growth. Through an analysis of hidden potentials, demand hotspots, and market conditions that are most favorable to success, this method enables firms to focus on target countries, maximize returns, and global expansion with data, backed by accuracy.
By factoring in the projected importer demand gap that is currently unmet and could be potential opportunity, it identifies the potential for the Exporter (Country) among 190 countries, against the general trade analysis, which identifies the biggest importer or exporter.
To discover high-growth global markets and optimize your business strategy:
Click Here
Pricing
- Single User License$ 1,995
- Department License$ 2,400
- Site License$ 3,120
- Global License$ 3,795

Leadership Perspectives from Industry Events
Search
Thought Leadership and Analyst Meet


Our Clients
6WResearch In News
- India Export Attractiveness Tracker 2026
- India Air Conditioner Market Set for Strong Rebound in 2026 After Weather-Led Correction and GST-Driven Recovery: 6Wresearch
- ADAS in India: How Automatic Emergency Braking, Blind Spot Detection & Driver Monitoring are Transforming Road Safety
- Doha a strategic location for EV manufacturing hub: IPA Qatar
- Demand for luxury TVs surging in the GCC, says Samsung
- Empowering Growth: The Thriving Journey of Bangladesh’s Cable Industry
Latest Reports
- Nicaragua RPG Gaming Market (2026-2032)
- New Zealand RPG Gaming Market (2026-2032)
- Netherlands RPG Gaming Market (2026-2032)
- Nauru RPG Gaming Market (2026-2032)
- Namibia RPG Gaming Market (2026-2032)
- Mozambique RPG Gaming Market (2026-2032)
- Montenegro RPG Gaming Market (2026-2032)
- Mongolia RPG Gaming Market (2026-2032)
- Monaco RPG Gaming Market (2026-2032)
- Micronesia RPG Gaming Market (2026-2032)
Industry Events and Analyst Meet

EV India Expo 2026

HIMTEX 2026

India Refining Summit 2026

India EV Show 2026

EV tech India Expo 2026
Whitepaper
- Middle East & Africa Commercial Security Market Click here to view more.
- Middle East & Africa Fire Safety Systems & Equipment Market Click here to view more.
- GCC Drone Market Click here to view more.
- Middle East Lighting Fixture Market Click here to view more.
- GCC Physical & Perimeter Security Market Click here to view more.