Finland Military Night Vision Device Market (2025-2031) | Growth, Segmentation, Revenue, Forecast, Industry, Size, Companies, Outlook, Trends, Analysis, Value & Share
Market Forecast By Type (Goggles, Cameras, Scopes/Tubes), By Technology (Image intensifier, Thermal imaging), By Application (Infantry Weapon Sights, Gunner Sights, Naval Trackers, Remotely Piloted Vehicles, Driving Sights) And Competitive Landscape
| Product Code: ETC4954019 | Publication Date: Nov 2023 | Updated Date: Apr 2026 | Product Type: Market Research Report | |
| Publisher: 6Wresearch | Author: Shubham Padhi | No. of Pages: 60 | No. of Figures: 30 | No. of Tables: 5 |
Finland Military Night Vision Device Market Size (2020-2030)
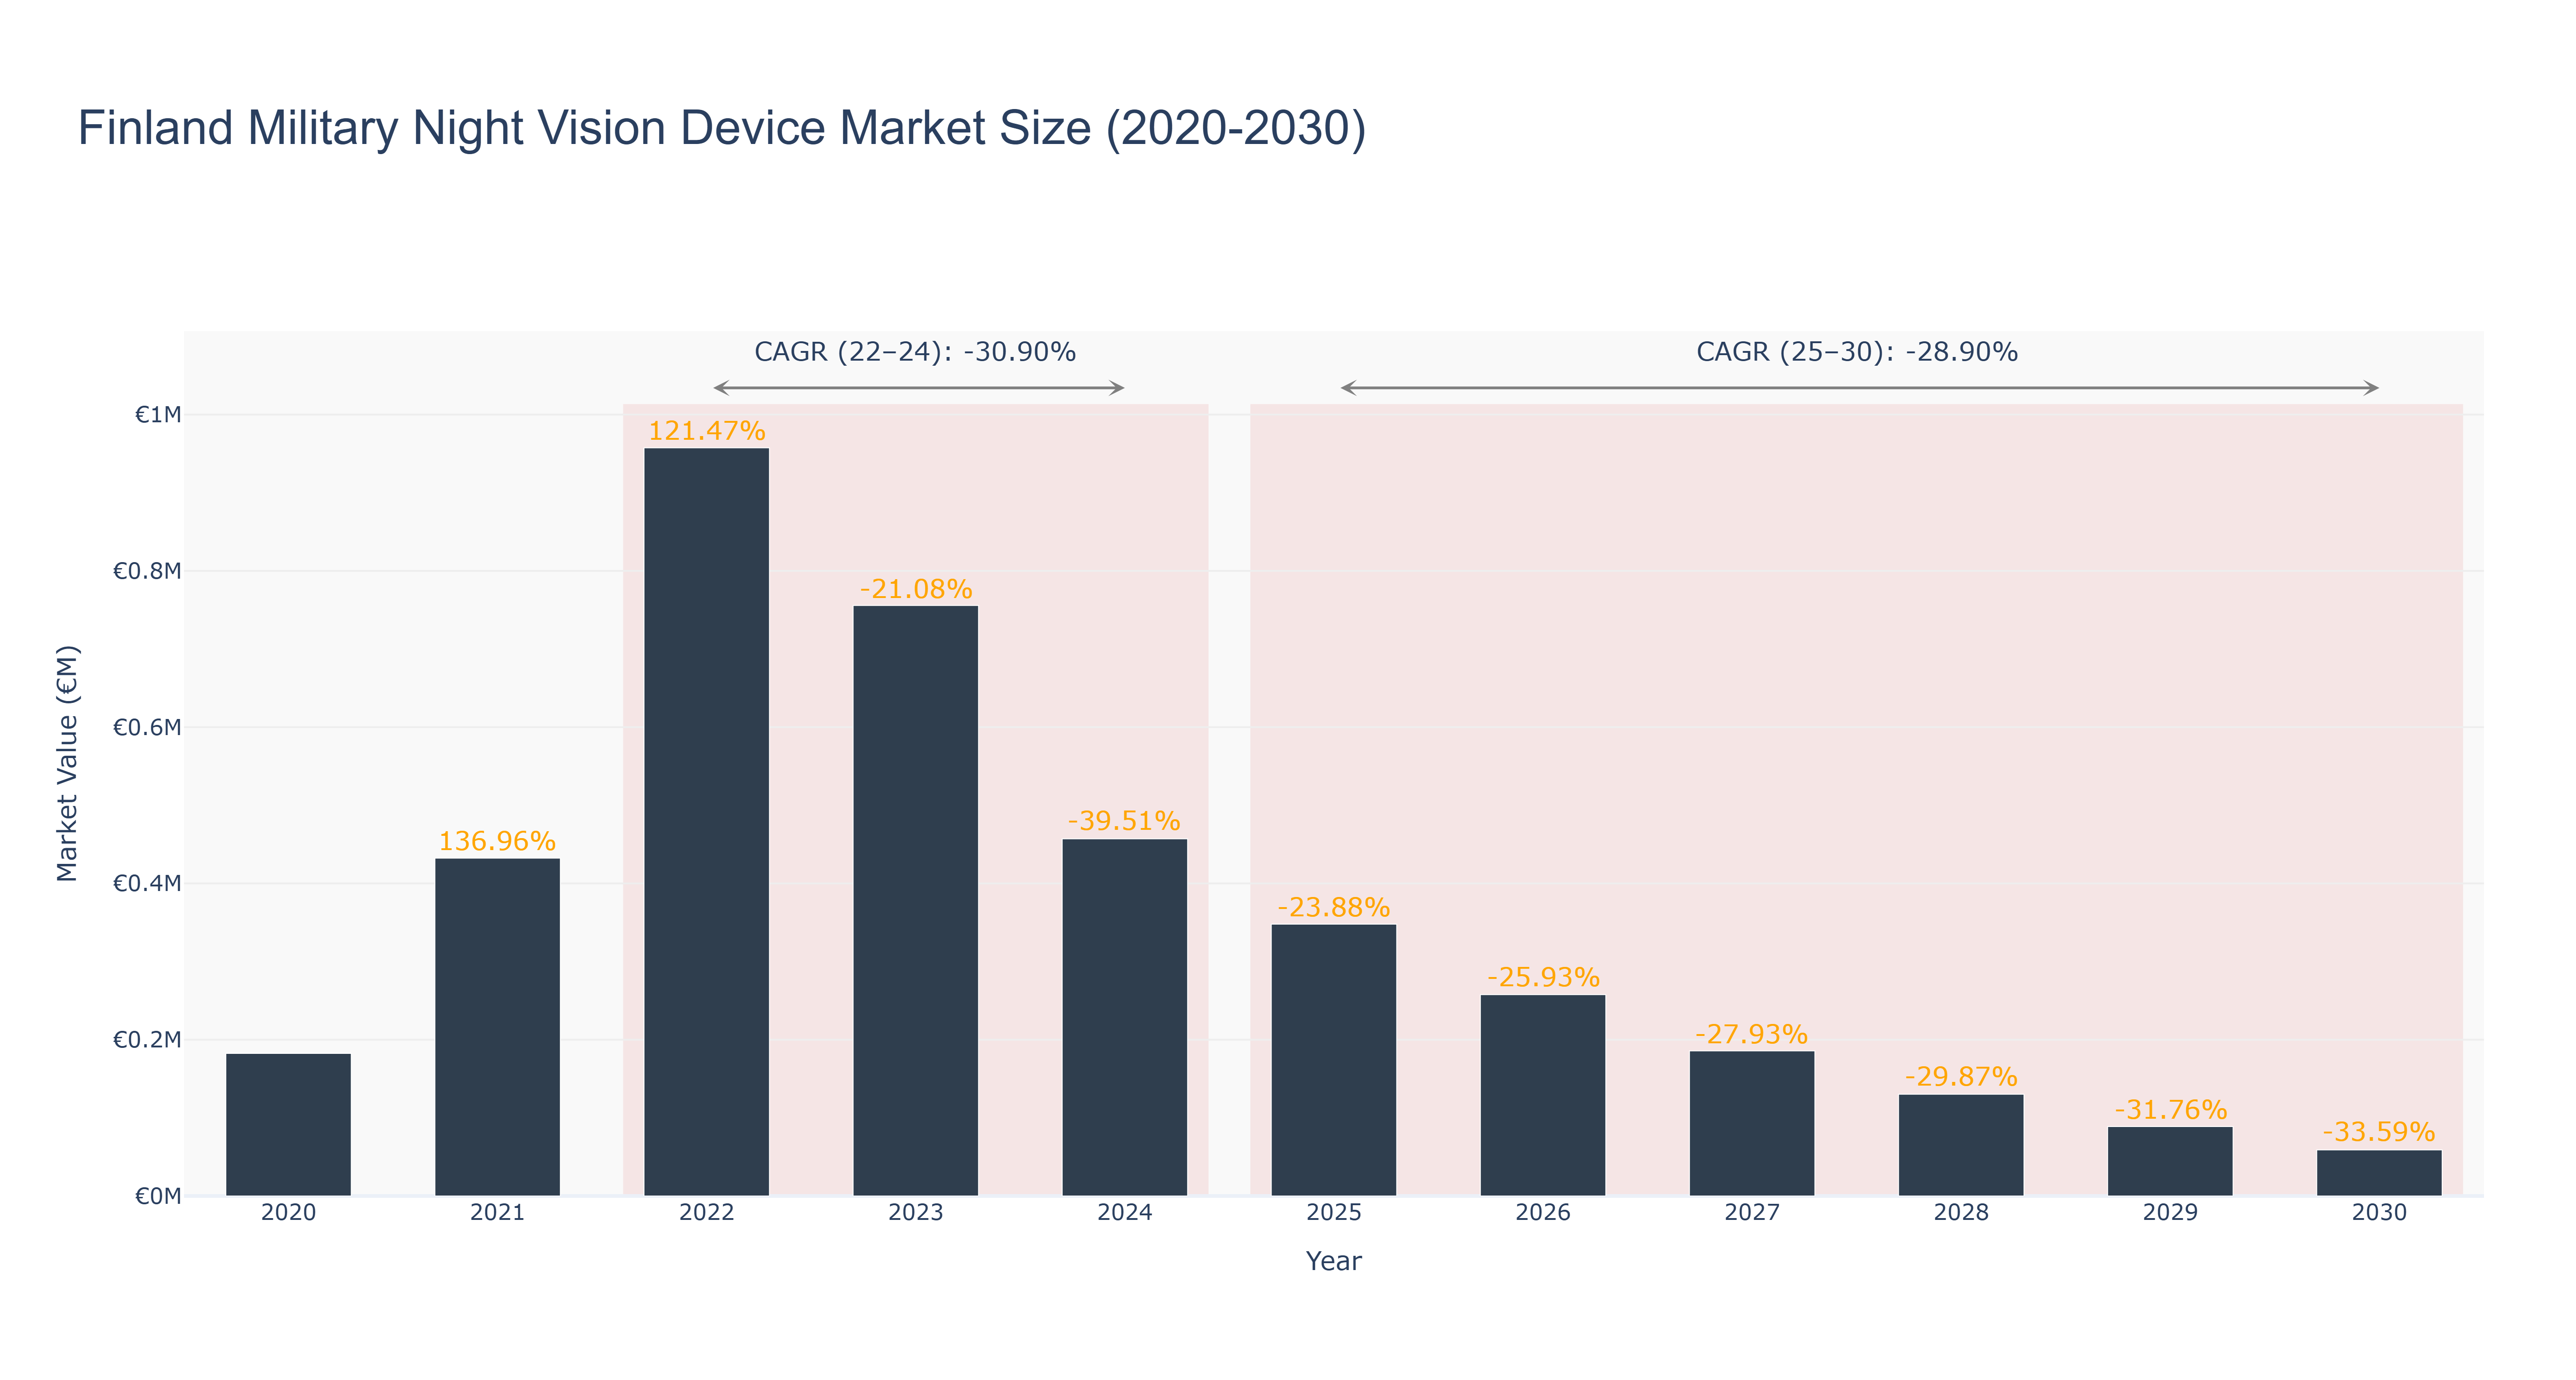
The Finland Military Night Vision Device Market experienced a peak market size of €0.96 million in 2022. However, the market has seen a steady decline since then, with the market size dropping to €0.26 million in 2026. The forecasted trend suggests a further decrease in market size to €0.06 million by 2030. The CAGR for the period 2022-24 is -30.90%, while for 2025-30, it stands at -28.90%. The decline can be attributed to factors such as technological advancements leading to cost reductions, saturation in the market, and shifting government priorities. Looking ahead, Finland is set to invest in upgrading its military equipment, including night vision devices, to enhance its defense capabilities, which could potentially stimulate market growth in the coming years. Industry drivers such as increasing defense budgets and the need for advanced surveillance technology are expected to play a significant role in shaping the market's future trajectory.
Finland Military Night Vision Device Market: Production & Trade Performance (2019-2025)
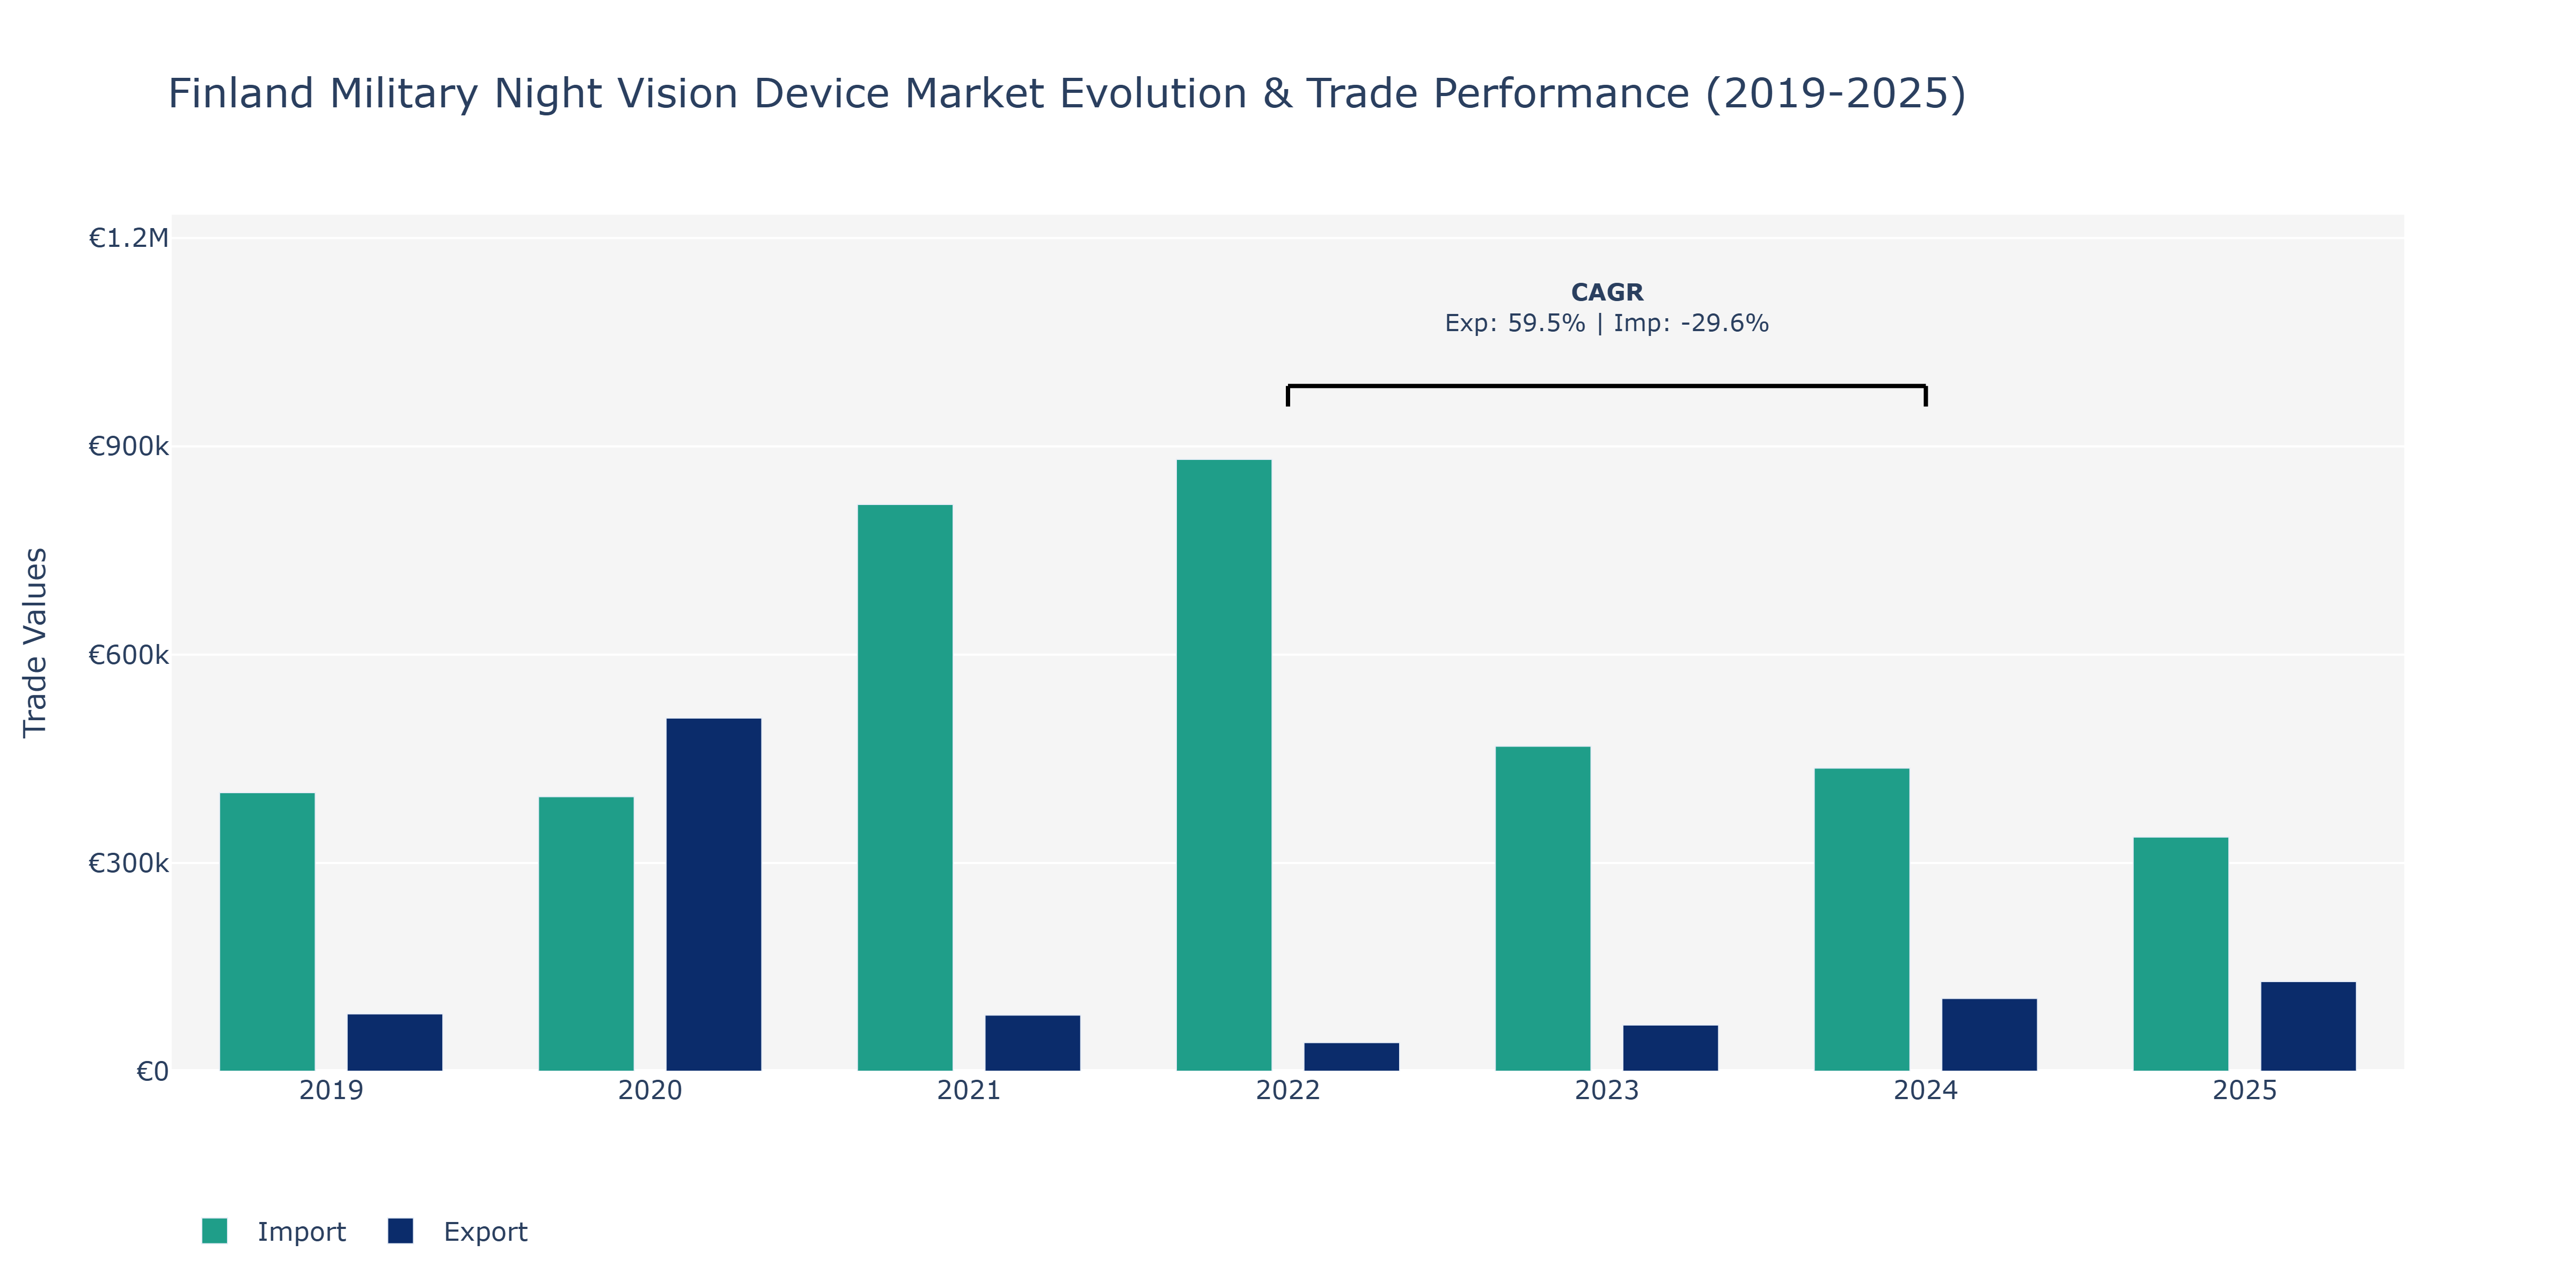
The Finland Military Night Vision Device Market witnessed fluctuations in both Exports and Imports over the years. In 2019, Exports stood at €82.6 thousand, showing a substantial increase to €508.57 thousand in 2020, attributed to enhanced demand. However, a notable decline was observed in 2021, with Exports dropping to €80.74 thousand, potentially impacted by market saturation or regulatory changes. Meanwhile, Imports surged from €401.28 thousand in 2019 to €881.2 thousand in 2022, indicating a growing reliance on foreign suppliers for Military Night Vision Devices. Despite a slight decrease in 2024 to €436.59 thousand, Imports remained high compared to the initial years. The market may have experienced shifts in geopolitical dynamics or advancements in domestic production capabilities, influencing trade patterns. The decreasing Imports CAGR of -29.61% from 2022 to 2024 suggests potential efforts to reduce dependence on foreign markets through local manufacturing or strategic alliances, aligning with global trends promoting self-sufficiency in defense technologies.
Key Highlights of the Report:
- Finland Military Night Vision Device Market Outlook
- Market Size of Finland Military Night Vision Device Market, 2024
- Forecast of Finland Military Night Vision Device Market, 2031
- Historical Data and Forecast of Finland Military Night Vision Device Revenues & Volume for the Period 2021-2031
- Finland Military Night Vision Device Market Trend Evolution
- Finland Military Night Vision Device Market Drivers and Challenges
- Finland Military Night Vision Device Price Trends
- Finland Military Night Vision Device Porter`s Five Forces
- Finland Military Night Vision Device Industry Life Cycle
- Historical Data and Forecast of Finland Military Night Vision Device Market Revenues & Volume By Type for the Period 2021-2031
- Historical Data and Forecast of Finland Military Night Vision Device Market Revenues & Volume By Goggles for the Period 2021-2031
- Historical Data and Forecast of Finland Military Night Vision Device Market Revenues & Volume By Cameras for the Period 2021-2031
- Historical Data and Forecast of Finland Military Night Vision Device Market Revenues & Volume By Scopes/Tubes for the Period 2021-2031
- Historical Data and Forecast of Finland Military Night Vision Device Market Revenues & Volume By Technology for the Period 2021-2031
- Historical Data and Forecast of Finland Military Night Vision Device Market Revenues & Volume By Image intensifier for the Period 2021-2031
- Historical Data and Forecast of Finland Military Night Vision Device Market Revenues & Volume By Thermal imaging for the Period 2021-2031
- Historical Data and Forecast of Finland Military Night Vision Device Market Revenues & Volume By Application for the Period 2021-2031
- Historical Data and Forecast of Finland Military Night Vision Device Market Revenues & Volume By Infantry Weapon Sights for the Period 2021-2031
- Historical Data and Forecast of Finland Military Night Vision Device Market Revenues & Volume By Gunner Sights for the Period 2021-2031
- Historical Data and Forecast of Finland Military Night Vision Device Market Revenues & Volume By Naval Trackers for the Period 2021-2031
- Historical Data and Forecast of Finland Military Night Vision Device Market Revenues & Volume By Remotely Piloted Vehicles for the Period 2021-2031
- Historical Data and Forecast of Finland Military Night Vision Device Market Revenues & Volume By Driving Sights for the Period 2021-2031
- Finland Military Night Vision Device Import Export Trade Statistics
- Market Opportunity Assessment By Type
- Market Opportunity Assessment By Technology
- Market Opportunity Assessment By Application
- Finland Military Night Vision Device Top Companies Market Share
- Finland Military Night Vision Device Competitive Benchmarking By Technical and Operational Parameters
- Finland Military Night Vision Device Company Profiles
- Finland Military Night Vision Device Key Strategic Recommendations
Frequently Asked Questions About the Market Study (FAQs):
6Wresearch actively monitors the Finland Military Night Vision Device Market and publishes its comprehensive annual report, highlighting emerging trends, growth drivers, revenue analysis, and forecast outlook. Our insights help businesses to make data-backed strategic decisions with ongoing market dynamics. Our analysts track relevent industries related to the Finland Military Night Vision Device Market, allowing our clients with actionable intelligence and reliable forecasts tailored to emerging regional needs.
Yes, we provide customisation as per your requirements. To learn more, feel free to contact us on sales@6wresearch.com
1 Executive Summary |
2 Introduction |
2.1 Key Highlights of the Report |
2.2 Report Description |
2.3 Market Scope & Segmentation |
2.4 Research Methodology |
2.5 Assumptions |
3 Finland Military Night Vision Device Market Overview |
3.1 Finland Country Macro Economic Indicators |
3.2 Finland Military Night Vision Device Market Revenues & Volume, 2021 & 2031F |
3.3 Finland Military Night Vision Device Market - Industry Life Cycle |
3.4 Finland Military Night Vision Device Market - Porter's Five Forces |
3.5 Finland Military Night Vision Device Market Revenues & Volume Share, By Type, 2021 & 2031F |
3.6 Finland Military Night Vision Device Market Revenues & Volume Share, By Technology, 2021 & 2031F |
3.7 Finland Military Night Vision Device Market Revenues & Volume Share, By Application, 2021 & 2031F |
4 Finland Military Night Vision Device Market Dynamics |
4.1 Impact Analysis |
4.2 Market Drivers |
4.2.1 Technological advancements in night vision devices |
4.2.2 Increasing defense budget of Finland |
4.2.3 Growing focus on enhancing military capabilities and modernization efforts |
4.3 Market Restraints |
4.3.1 High initial costs of night vision devices |
4.3.2 Limited availability of skilled personnel for operating and maintaining the devices |
5 Finland Military Night Vision Device Market Trends |
6 Finland Military Night Vision Device Market Segmentations |
6.1 Finland Military Night Vision Device Market, By Type |
6.1.1 Overview and Analysis |
6.1.2 Finland Military Night Vision Device Market Revenues & Volume, By Goggles, 2021-2031F |
6.1.3 Finland Military Night Vision Device Market Revenues & Volume, By Cameras, 2021-2031F |
6.1.4 Finland Military Night Vision Device Market Revenues & Volume, By Scopes/Tubes, 2021-2031F |
6.2 Finland Military Night Vision Device Market, By Technology |
6.2.1 Overview and Analysis |
6.2.2 Finland Military Night Vision Device Market Revenues & Volume, By Image intensifier, 2021-2031F |
6.2.3 Finland Military Night Vision Device Market Revenues & Volume, By Thermal imaging, 2021-2031F |
6.3 Finland Military Night Vision Device Market, By Application |
6.3.1 Overview and Analysis |
6.3.2 Finland Military Night Vision Device Market Revenues & Volume, By Infantry Weapon Sights, 2021-2031F |
6.3.3 Finland Military Night Vision Device Market Revenues & Volume, By Gunner Sights, 2021-2031F |
6.3.4 Finland Military Night Vision Device Market Revenues & Volume, By Naval Trackers, 2021-2031F |
6.3.5 Finland Military Night Vision Device Market Revenues & Volume, By Remotely Piloted Vehicles, 2021-2031F |
6.3.6 Finland Military Night Vision Device Market Revenues & Volume, By Driving Sights, 2021-2031F |
7 Finland Military Night Vision Device Market Import-Export Trade Statistics |
7.1 Finland Military Night Vision Device Market Export to Major Countries |
7.2 Finland Military Night Vision Device Market Imports from Major Countries |
8 Finland Military Night Vision Device Market Key Performance Indicators |
8.1 Percentage increase in the adoption of the latest night vision technologies by the Finnish military |
8.2 Number of defense contracts awarded for procurement of night vision devices |
8.3 Percentage growth in the training programs for military personnel on the usage of night vision devices |
9 Finland Military Night Vision Device Market - Opportunity Assessment |
9.1 Finland Military Night Vision Device Market Opportunity Assessment, By Type, 2021 & 2031F |
9.2 Finland Military Night Vision Device Market Opportunity Assessment, By Technology, 2021 & 2031F |
9.3 Finland Military Night Vision Device Market Opportunity Assessment, By Application, 2021 & 2031F |
10 Finland Military Night Vision Device Market - Competitive Landscape |
10.1 Finland Military Night Vision Device Market Revenue Share, By Companies, 2024 |
10.2 Finland Military Night Vision Device Market Competitive Benchmarking, By Operating and Technical Parameters |
11 Company Profiles |
12 Recommendations | 13 Disclaimer |
Global Go To Market Strategy - 2030
Export potential enables firms to identify high-growth global markets with greater confidence by combining advanced trade intelligence with a structured quantitative methodology. The framework analyzes emerging demand trends and country-level import patterns while integrating macroeconomic and trade datasets such as GDP and population forecasts, bilateral import–export flows, tariff structures, elasticity differentials between developed and developing economies, geographic distance, and import demand projections. Using weighted trade values from 2020–2024 as the base period to project country-to-country export potential for 2030, these inputs are operationalized through calculated drivers such as gravity model parameters, tariff impact factors, and projected GDP per-capita growth. Through an analysis of hidden potentials, demand hotspots, and market conditions that are most favorable to success, this method enables firms to focus on target countries, maximize returns, and global expansion with data, backed by accuracy.
By factoring in the projected importer demand gap that is currently unmet and could be potential opportunity, it identifies the potential for the Exporter (Country) among 190 countries, against the general trade analysis, which identifies the biggest importer or exporter.
To discover high-growth global markets and optimize your business strategy:
Click Here
Pricing
- Single User License$ 1,995
- Department License$ 2,400
- Site License$ 3,120
- Global License$ 3,795

Leadership Perspectives from Industry Events
Search
Thought Leadership and Analyst Meet


Our Clients
6WResearch In News
- India Export Attractiveness Tracker 2026
- India Air Conditioner Market Set for Strong Rebound in 2026 After Weather-Led Correction and GST-Driven Recovery: 6Wresearch
- ADAS in India: How Automatic Emergency Braking, Blind Spot Detection & Driver Monitoring are Transforming Road Safety
- Doha a strategic location for EV manufacturing hub: IPA Qatar
- Demand for luxury TVs surging in the GCC, says Samsung
- Empowering Growth: The Thriving Journey of Bangladesh’s Cable Industry
Latest Reports
- Nicaragua RPG Gaming Market (2026-2032)
- New Zealand RPG Gaming Market (2026-2032)
- Netherlands RPG Gaming Market (2026-2032)
- Nauru RPG Gaming Market (2026-2032)
- Namibia RPG Gaming Market (2026-2032)
- Mozambique RPG Gaming Market (2026-2032)
- Montenegro RPG Gaming Market (2026-2032)
- Mongolia RPG Gaming Market (2026-2032)
- Monaco RPG Gaming Market (2026-2032)
- Micronesia RPG Gaming Market (2026-2032)
Industry Events and Analyst Meet

EV India Expo 2026

HIMTEX 2026

India Refining Summit 2026

India EV Show 2026

EV tech India Expo 2026
Whitepaper
- Middle East & Africa Commercial Security Market Click here to view more.
- Middle East & Africa Fire Safety Systems & Equipment Market Click here to view more.
- GCC Drone Market Click here to view more.
- Middle East Lighting Fixture Market Click here to view more.
- GCC Physical & Perimeter Security Market Click here to view more.