Finland Orange Juice Market (2025-2031) | Value, Growth, Analysis, Size, Forecast, Share, Segmentation, Trends, Companies, Outlook, Industry & Revenue
Market Forecast By Product Type (Frozen Concentrated Orange Juice, Not From Concentrate, Canned Orange Juice, Fresh-Squeezed Orange juice, Dehydrated Orange Juice, Others), By Packaging (Tetra Pak, PP Material Bottle, Metal Can, Others), By Distribution Channel (Offline Channel, Online Channel) And Competitive Landscape
| Product Code: ETC5018657 | Publication Date: Nov 2023 | Updated Date: Apr 2026 | Product Type: Market Research Report | |
| Publisher: 6Wresearch | Author: Shubham Padhi | No. of Pages: 60 | No. of Figures: 30 | No. of Tables: 5 |
Finland Orange Juice Market Size (2020-2030)
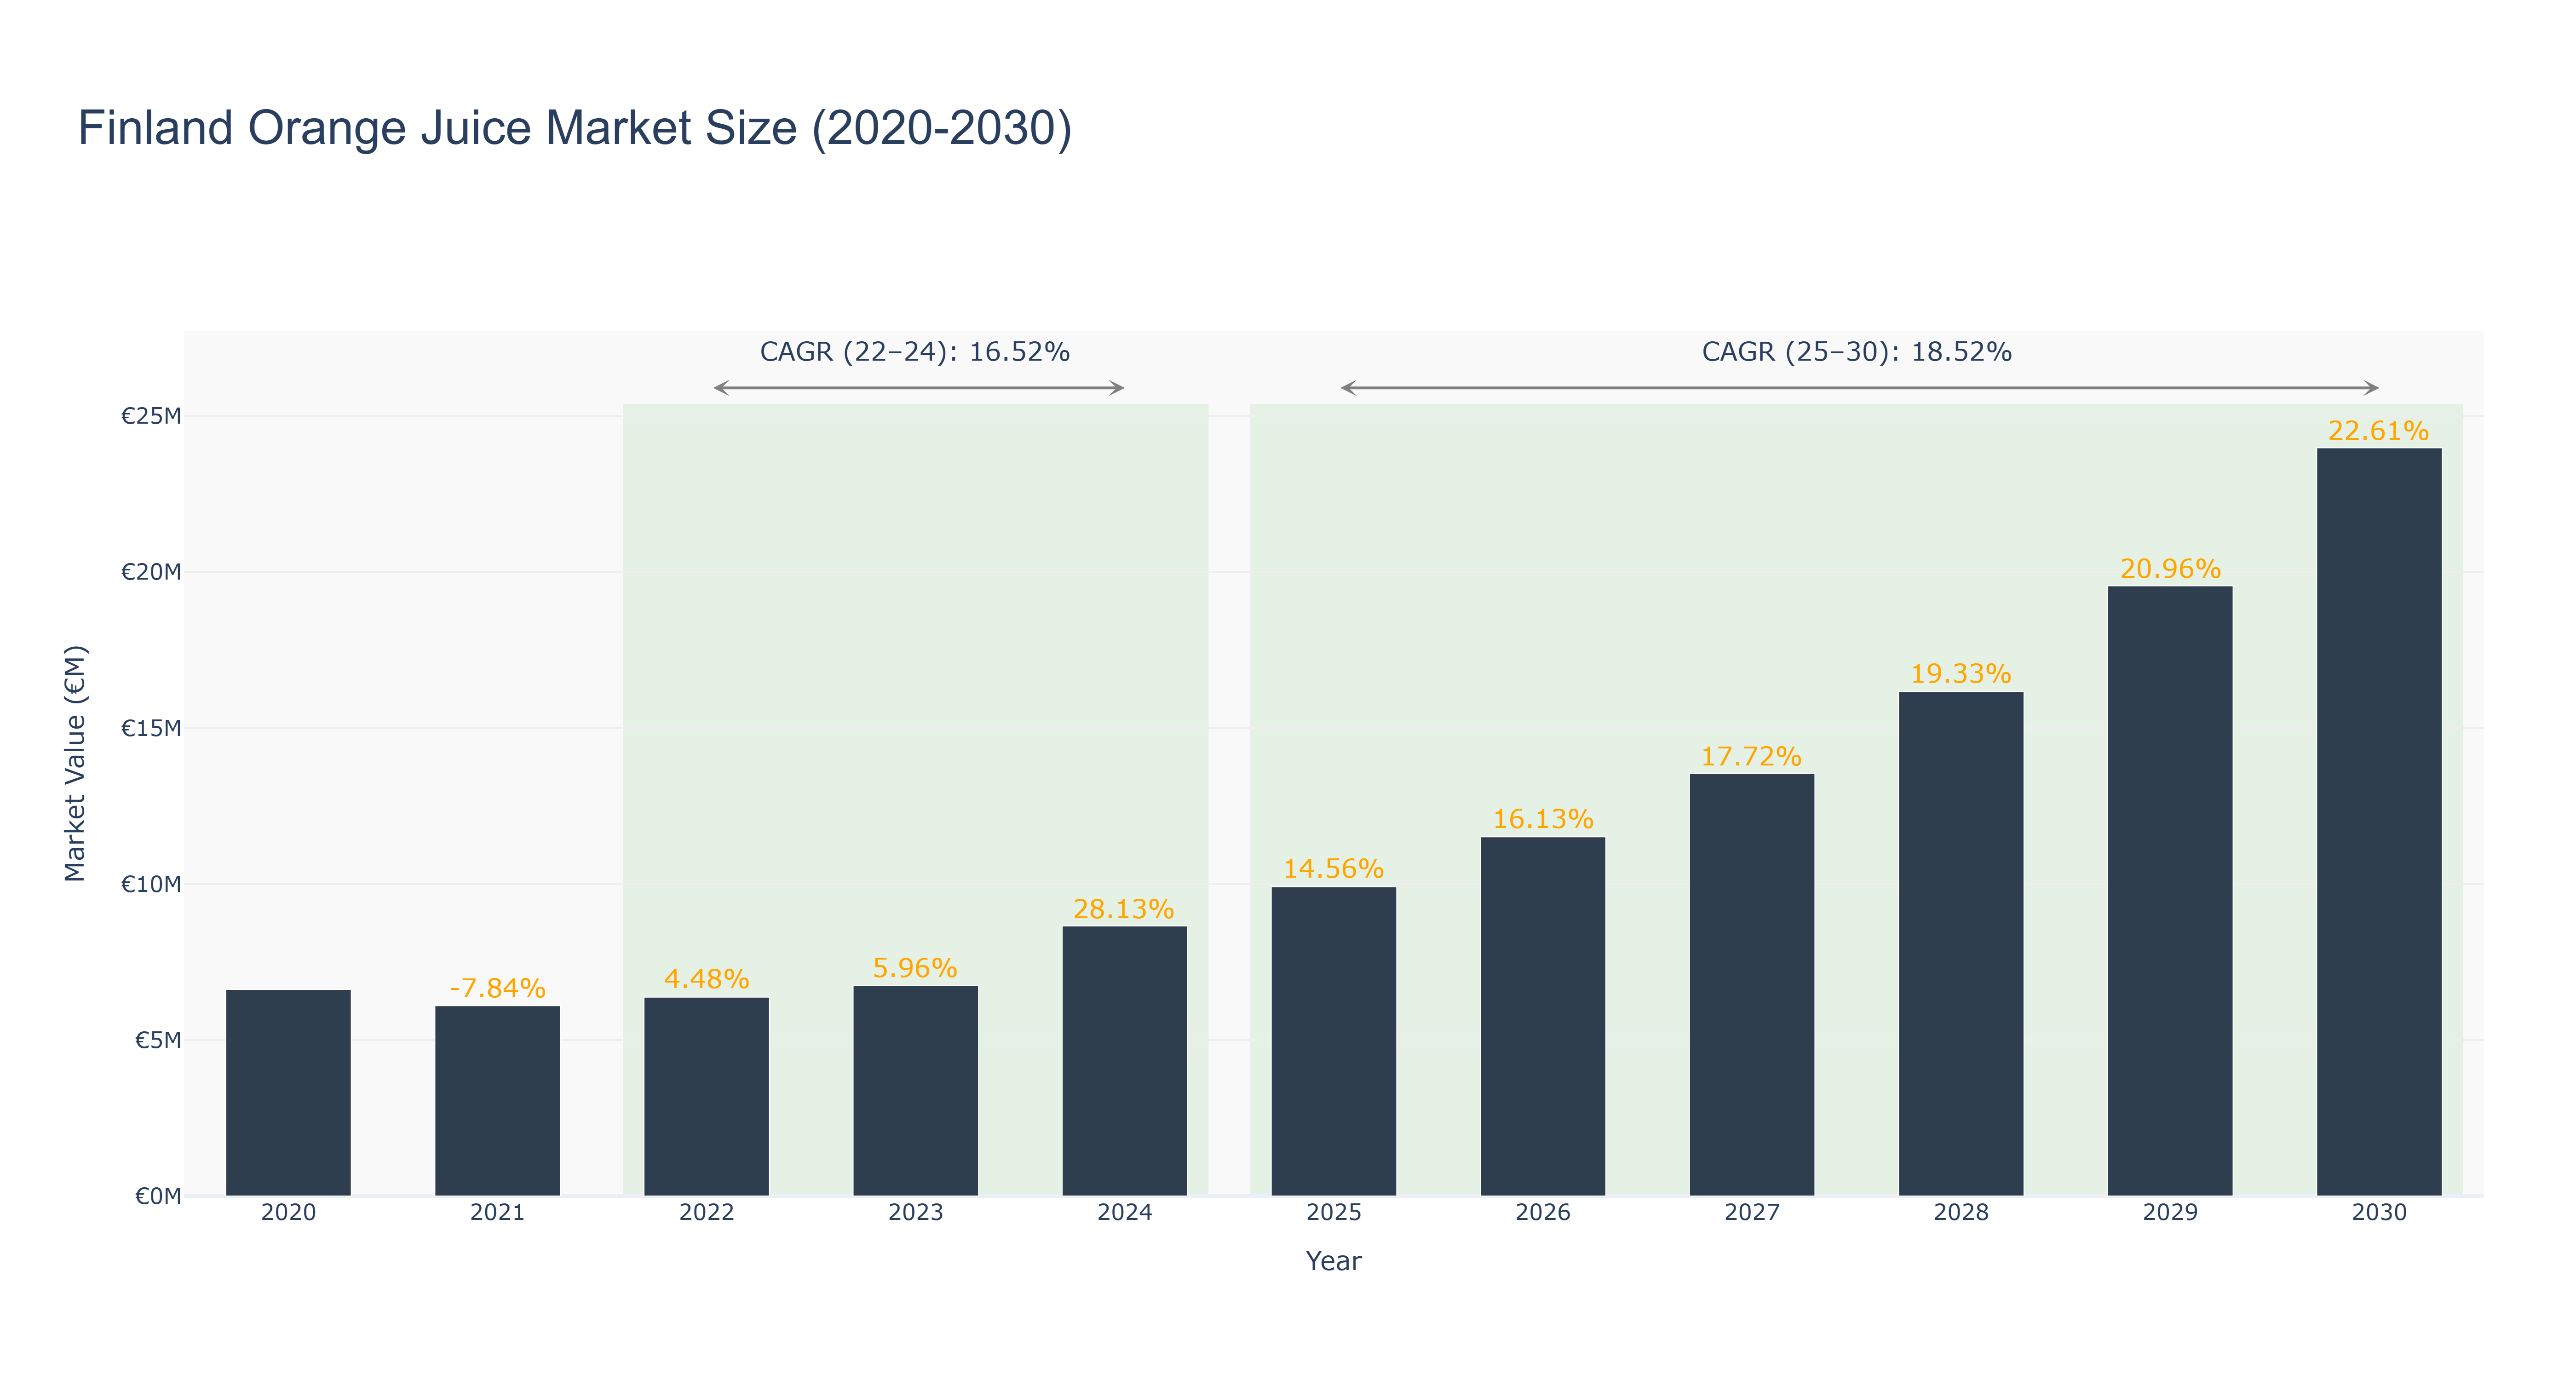
Finland Orange Juice Market has shown a steady growth trajectory over the years. The peak market size was €23.98 million in 2030, with a notable increase in market size from €6.62 million in 2020 to €23.98 million in 2030. The CAGR between 2022-24 was 16.52%, while the CAGR between 2025-30 is projected at 18.52%. The market experienced significant growth due to increasing health consciousness among consumers, leading to a higher demand for natural and healthy beverages. Moving forward, the Finland Orange Juice Market is expected to witness continued growth, with upcoming investments in sustainable packaging solutions and innovative product variations to cater to evolving consumer preferences. These developments are aimed at further solidifying Finland's position as a key player in the orange juice market.
Finland Orange Juice Market: Production & Trade Performance (2019-2025)
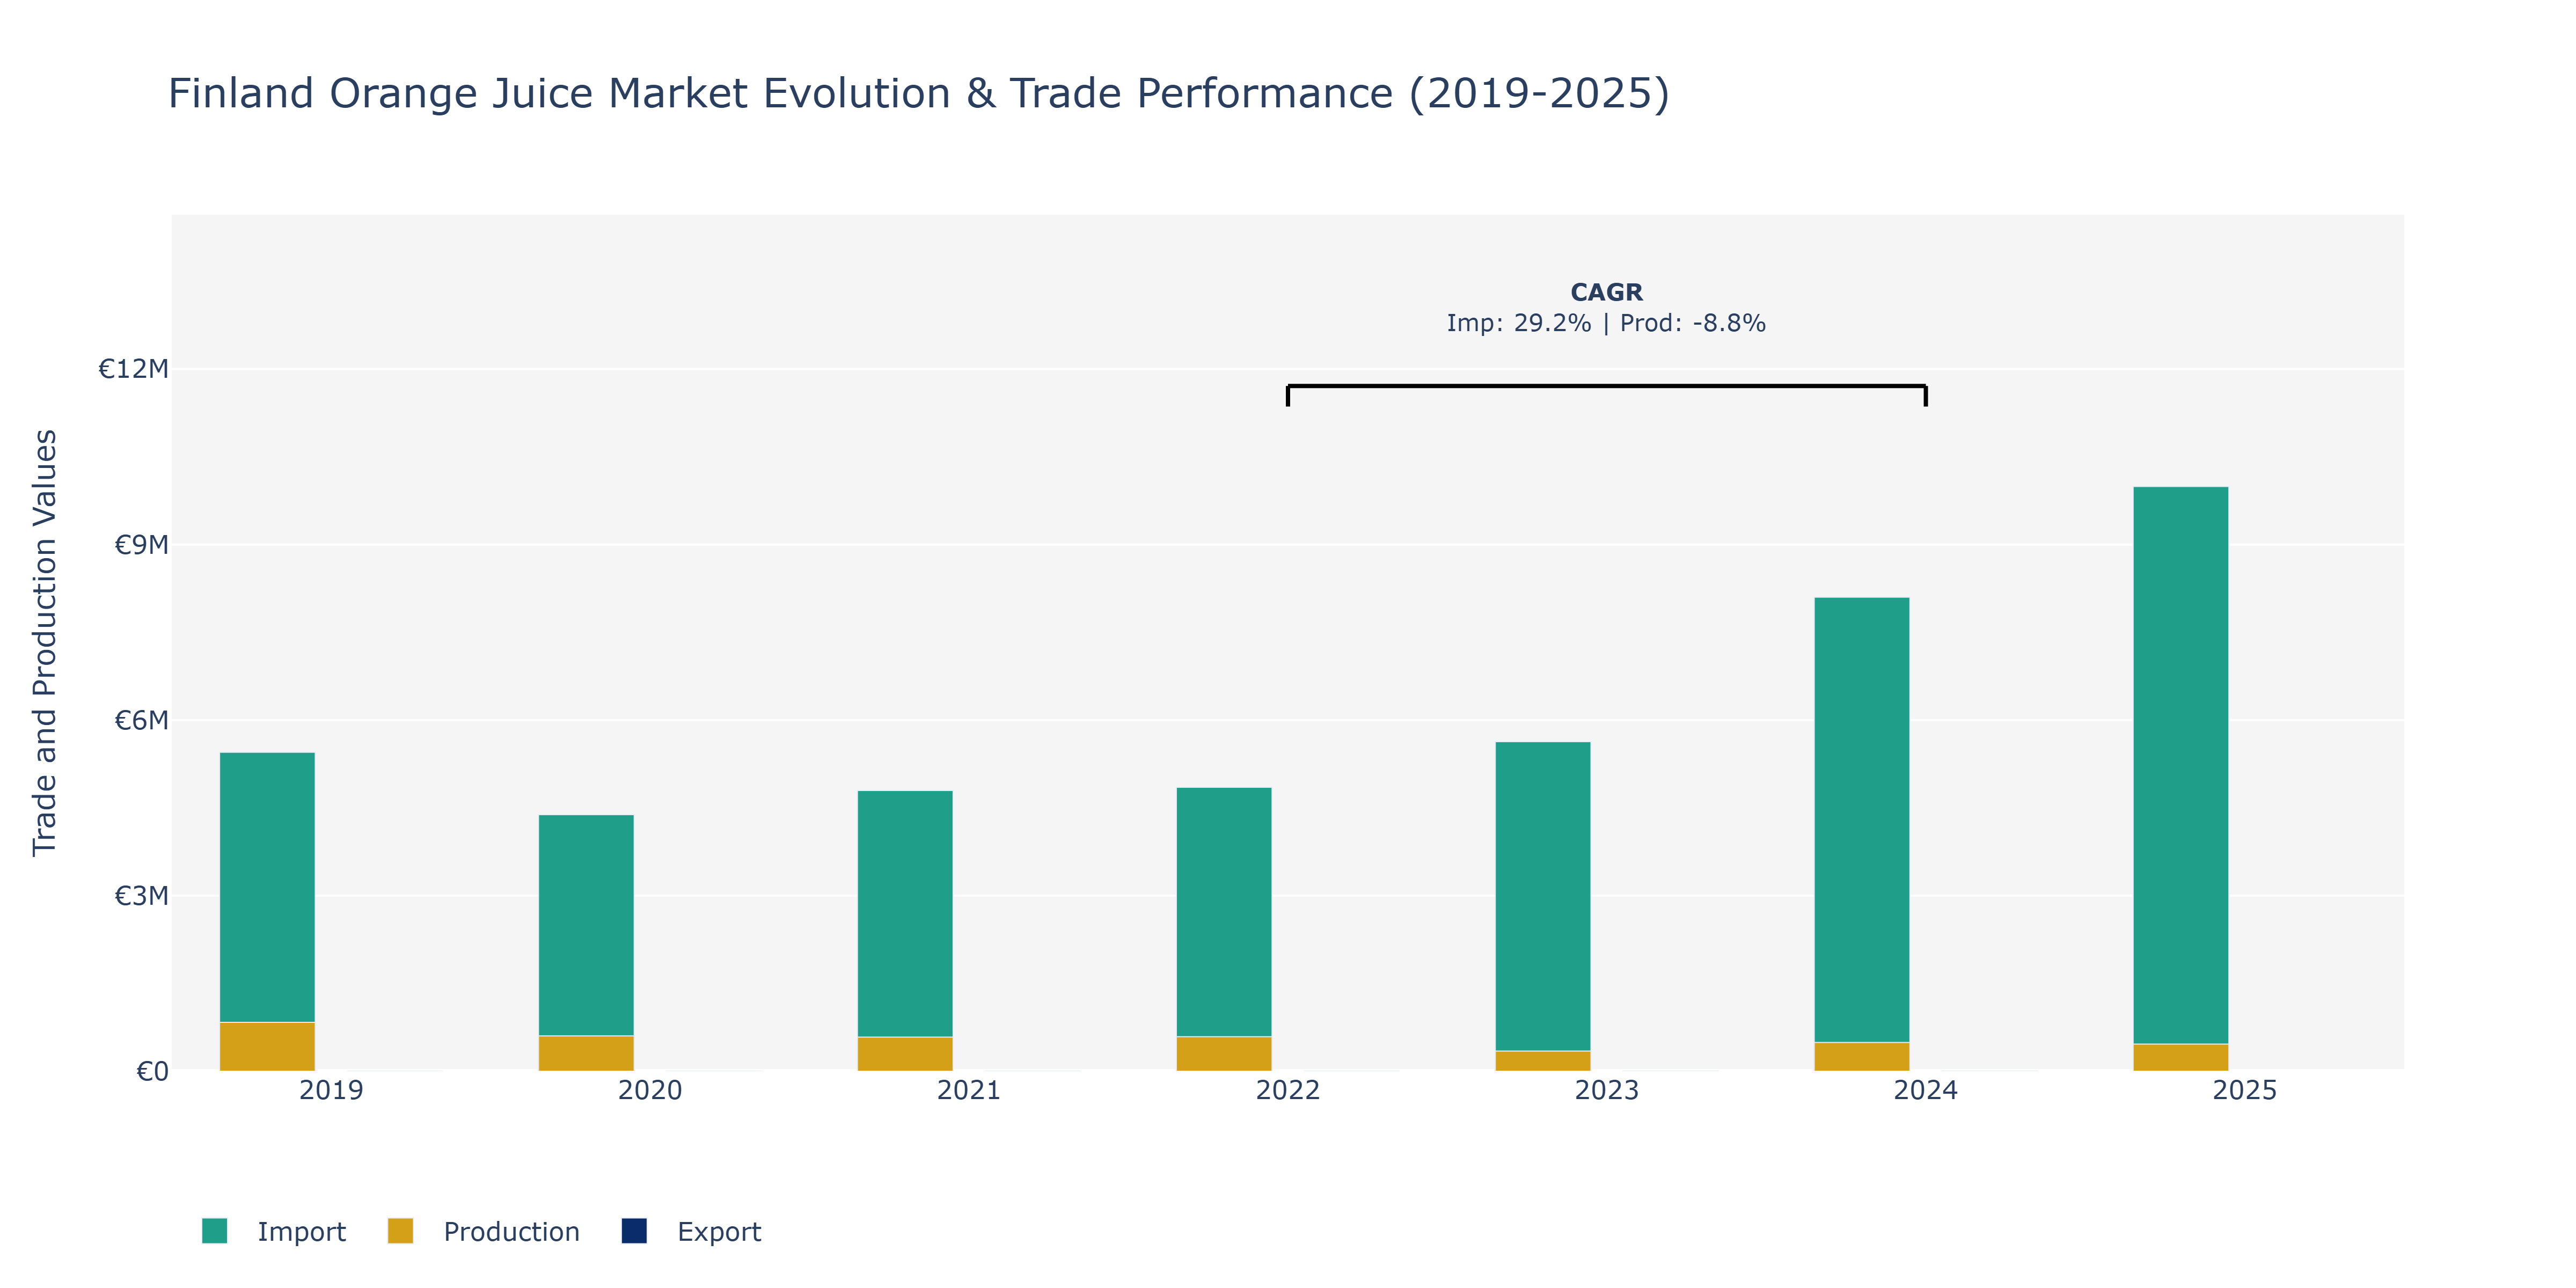
In the Finland Orange Juice Market, exports showed fluctuations over the years, with a peak in 2023 at €2.32 thousand, followed by a slight decline in 2024 to €1.56 thousand. Imports exhibited a consistent upward trend, reaching €9.99 million in 2025, showing steady growth year over year. Production witnessed a significant decrease from €835.70 million in 2019 to €344.00 million in 2023, with a slight recovery to €463.20 million in 2025. These trends can be attributed to changing consumer preferences towards healthier beverage options, impacting domestic production levels, while increased imports reflect a rising demand for orange juice in the Finnish market. The surge in imports could also be influenced by international trade agreements and global supply chain dynamics. To sustain growth, local producers may need to innovate and adapt to evolving consumer demands for quality and sustainability in orange juice products.
Key Highlights of the Report:
- Finland Orange Juice Market Outlook
- Market Size of Finland Orange Juice Market, 2024
- Forecast of Finland Orange Juice Market, 2031
- Historical Data and Forecast of Finland Orange Juice Revenues & Volume for the Period 2021-2031
- Finland Orange Juice Market Trend Evolution
- Finland Orange Juice Market Drivers and Challenges
- Finland Orange Juice Price Trends
- Finland Orange Juice Porter`s Five Forces
- Finland Orange Juice Industry Life Cycle
- Historical Data and Forecast of Finland Orange Juice Market Revenues & Volume By Product Type for the Period 2021-2031
- Historical Data and Forecast of Finland Orange Juice Market Revenues & Volume By Frozen Concentrated Orange Juice for the Period 2021-2031
- Historical Data and Forecast of Finland Orange Juice Market Revenues & Volume By Not From Concentrate for the Period 2021-2031
- Historical Data and Forecast of Finland Orange Juice Market Revenues & Volume By Canned Orange Juice for the Period 2021-2031
- Historical Data and Forecast of Finland Orange Juice Market Revenues & Volume By Fresh-Squeezed Orange juice, for the Period 2021-2031
- Historical Data and Forecast of Finland Orange Juice Market Revenues & Volume By Dehydrated Orange Juice for the Period 2021-2031
- Historical Data and Forecast of Finland Orange Juice Market Revenues & Volume By Others for the Period 2021-2031
- Historical Data and Forecast of Finland Orange Juice Market Revenues & Volume By Packaging for the Period 2021-2031
- Historical Data and Forecast of Finland Orange Juice Market Revenues & Volume By Tetra Pak for the Period 2021-2031
- Historical Data and Forecast of Finland Orange Juice Market Revenues & Volume By PP Material Bottle for the Period 2021-2031
- Historical Data and Forecast of Finland Orange Juice Market Revenues & Volume By Metal Can for the Period 2021-2031
- Historical Data and Forecast of Finland Orange Juice Market Revenues & Volume By Others for the Period 2021-2031
- Historical Data and Forecast of Finland Orange Juice Market Revenues & Volume By Distribution Channel for the Period 2021-2031
- Historical Data and Forecast of Finland Orange Juice Market Revenues & Volume By Offline Channel for the Period 2021-2031
- Historical Data and Forecast of Finland Orange Juice Market Revenues & Volume By Online Channel for the Period 2021-2031
- Finland Orange Juice Import Export Trade Statistics
- Market Opportunity Assessment By Product Type
- Market Opportunity Assessment By Packaging
- Market Opportunity Assessment By Distribution Channel
- Finland Orange Juice Top Companies Market Share
- Finland Orange Juice Competitive Benchmarking By Technical and Operational Parameters
- Finland Orange Juice Company Profiles
- Finland Orange Juice Key Strategic Recommendations
Frequently Asked Questions About the Market Study (FAQs):
6Wresearch actively monitors the Finland Orange Juice Market and publishes its comprehensive annual report, highlighting emerging trends, growth drivers, revenue analysis, and forecast outlook. Our insights help businesses to make data-backed strategic decisions with ongoing market dynamics. Our analysts track relevent industries related to the Finland Orange Juice Market, allowing our clients with actionable intelligence and reliable forecasts tailored to emerging regional needs.
Yes, we provide customisation as per your requirements. To learn more, feel free to contact us on sales@6wresearch.com
1 Executive Summary |
2 Introduction |
2.1 Key Highlights of the Report |
2.2 Report Description |
2.3 Market Scope & Segmentation |
2.4 Research Methodology |
2.5 Assumptions |
3 Finland Orange Juice Market Overview |
3.1 Finland Country Macro Economic Indicators |
3.2 Finland Orange Juice Market Revenues & Volume, 2021 & 2031F |
3.3 Finland Orange Juice Market - Industry Life Cycle |
3.4 Finland Orange Juice Market - Porter's Five Forces |
3.5 Finland Orange Juice Market Revenues & Volume Share, By Product Type, 2021 & 2031F |
3.6 Finland Orange Juice Market Revenues & Volume Share, By Packaging, 2021 & 2031F |
3.7 Finland Orange Juice Market Revenues & Volume Share, By Distribution Channel, 2021 & 2031F |
4 Finland Orange Juice Market Dynamics |
4.1 Impact Analysis |
4.2 Market Drivers |
4.2.1 Increasing consumer awareness about the health benefits of orange juice |
4.2.2 Growing demand for natural and healthy beverages |
4.2.3 Rising focus on sustainable and organic products |
4.3 Market Restraints |
4.3.1 Seasonal availability of oranges affecting production and supply |
4.3.2 Competition from other fruit juices and beverages in the market |
4.3.3 Fluctuating prices of raw materials impacting production costs |
5 Finland Orange Juice Market Trends |
6 Finland Orange Juice Market Segmentations |
6.1 Finland Orange Juice Market, By Product Type |
6.1.1 Overview and Analysis |
6.1.2 Finland Orange Juice Market Revenues & Volume, By Frozen Concentrated Orange Juice, 2021-2031F |
6.1.3 Finland Orange Juice Market Revenues & Volume, By Not From Concentrate, 2021-2031F |
6.1.4 Finland Orange Juice Market Revenues & Volume, By Canned Orange Juice, 2021-2031F |
6.1.5 Finland Orange Juice Market Revenues & Volume, By Fresh-Squeezed Orange juice,, 2021-2031F |
6.1.6 Finland Orange Juice Market Revenues & Volume, By Dehydrated Orange Juice, 2021-2031F |
6.1.7 Finland Orange Juice Market Revenues & Volume, By Others, 2021-2031F |
6.2 Finland Orange Juice Market, By Packaging |
6.2.1 Overview and Analysis |
6.2.2 Finland Orange Juice Market Revenues & Volume, By Tetra Pak, 2021-2031F |
6.2.3 Finland Orange Juice Market Revenues & Volume, By PP Material Bottle, 2021-2031F |
6.2.4 Finland Orange Juice Market Revenues & Volume, By Metal Can, 2021-2031F |
6.2.5 Finland Orange Juice Market Revenues & Volume, By Others, 2021-2031F |
6.3 Finland Orange Juice Market, By Distribution Channel |
6.3.1 Overview and Analysis |
6.3.2 Finland Orange Juice Market Revenues & Volume, By Offline Channel, 2021-2031F |
6.3.3 Finland Orange Juice Market Revenues & Volume, By Online Channel, 2021-2031F |
7 Finland Orange Juice Market Import-Export Trade Statistics |
7.1 Finland Orange Juice Market Export to Major Countries |
7.2 Finland Orange Juice Market Imports from Major Countries |
8 Finland Orange Juice Market Key Performance Indicators |
8.1 Number of new product launches in the orange juice segment |
8.2 Consumer perception and preference for organic and sustainable orange juice products |
8.3 Growth in the number of orange juice consumption occasions |
8.4 Percentage of repeat purchases for orange juice brands |
8.5 Adoption rate of innovative packaging solutions for orange juice |
9 Finland Orange Juice Market - Opportunity Assessment |
9.1 Finland Orange Juice Market Opportunity Assessment, By Product Type, 2021 & 2031F |
9.2 Finland Orange Juice Market Opportunity Assessment, By Packaging, 2021 & 2031F |
9.3 Finland Orange Juice Market Opportunity Assessment, By Distribution Channel, 2021 & 2031F |
10 Finland Orange Juice Market - Competitive Landscape |
10.1 Finland Orange Juice Market Revenue Share, By Companies, 2024 |
10.2 Finland Orange Juice Market Competitive Benchmarking, By Operating and Technical Parameters |
11 Company Profiles |
12 Recommendations | 13 Disclaimer |
Global Go To Market Strategy - 2030
Export potential enables firms to identify high-growth global markets with greater confidence by combining advanced trade intelligence with a structured quantitative methodology. The framework analyzes emerging demand trends and country-level import patterns while integrating macroeconomic and trade datasets such as GDP and population forecasts, bilateral import–export flows, tariff structures, elasticity differentials between developed and developing economies, geographic distance, and import demand projections. Using weighted trade values from 2020–2024 as the base period to project country-to-country export potential for 2030, these inputs are operationalized through calculated drivers such as gravity model parameters, tariff impact factors, and projected GDP per-capita growth. Through an analysis of hidden potentials, demand hotspots, and market conditions that are most favorable to success, this method enables firms to focus on target countries, maximize returns, and global expansion with data, backed by accuracy.
By factoring in the projected importer demand gap that is currently unmet and could be potential opportunity, it identifies the potential for the Exporter (Country) among 190 countries, against the general trade analysis, which identifies the biggest importer or exporter.
To discover high-growth global markets and optimize your business strategy:
Click Here
Pricing
- Single User License$ 1,995
- Department License$ 2,400
- Site License$ 3,120
- Global License$ 3,795

Leadership Perspectives from Industry Events
Search
Thought Leadership and Analyst Meet


Our Clients
6WResearch In News
- India Export Attractiveness Tracker 2026
- India Air Conditioner Market Set for Strong Rebound in 2026 After Weather-Led Correction and GST-Driven Recovery: 6Wresearch
- ADAS in India: How Automatic Emergency Braking, Blind Spot Detection & Driver Monitoring are Transforming Road Safety
- Doha a strategic location for EV manufacturing hub: IPA Qatar
- Demand for luxury TVs surging in the GCC, says Samsung
- Empowering Growth: The Thriving Journey of Bangladesh’s Cable Industry
Latest Reports
- Nicaragua RPG Gaming Market (2026-2032)
- New Zealand RPG Gaming Market (2026-2032)
- Netherlands RPG Gaming Market (2026-2032)
- Nauru RPG Gaming Market (2026-2032)
- Namibia RPG Gaming Market (2026-2032)
- Mozambique RPG Gaming Market (2026-2032)
- Montenegro RPG Gaming Market (2026-2032)
- Mongolia RPG Gaming Market (2026-2032)
- Monaco RPG Gaming Market (2026-2032)
- Micronesia RPG Gaming Market (2026-2032)
Industry Events and Analyst Meet

EV India Expo 2026

HIMTEX 2026

India Refining Summit 2026

India EV Show 2026

EV tech India Expo 2026
Whitepaper
- Middle East & Africa Commercial Security Market Click here to view more.
- Middle East & Africa Fire Safety Systems & Equipment Market Click here to view more.
- GCC Drone Market Click here to view more.
- Middle East Lighting Fixture Market Click here to view more.
- GCC Physical & Perimeter Security Market Click here to view more.