Finland Sodium Thiosulfate Market (2026-2032) | Demand, Growth, Strategy, Consumer Insights, Drivers, Segments, Opportunities, Challenges, Supply, Strategic Insights, Size, Revenue, Pricing Analysis, Value, Analysis, Share, Investment Trends, Companies, Competition, Competitive, Restraints, Trends, Forecast, Outlook, Segmentation, Industry
Market Forecast By Form (Powder, Granular, Liquid, Crystalline), By Application (Medical Detoxification, Water Dechlorination, Photography, Gold Extraction), By Manufacturing Process (Sulfur Reduction, Electrolytic Process, Chemical Synthesis, Sulfite Process), By End User (Pharmaceuticals, Water Treatment, Photography Industry, Mining Industry), By Packaging Type (Bags, Drums, Containers, Bulk Storage) And Competitive Landscape
| Product Code: ETC10860642 | Publication Date: Apr 2025 | Updated Date: Apr 2026 | Product Type: Market Research Report | |
| Publisher: 6Wresearch | No. of Pages: 65 | No. of Figures: 34 | No. of Tables: 19 | |
Finland Sodium Thiosulfate Market Size (2020-2030)
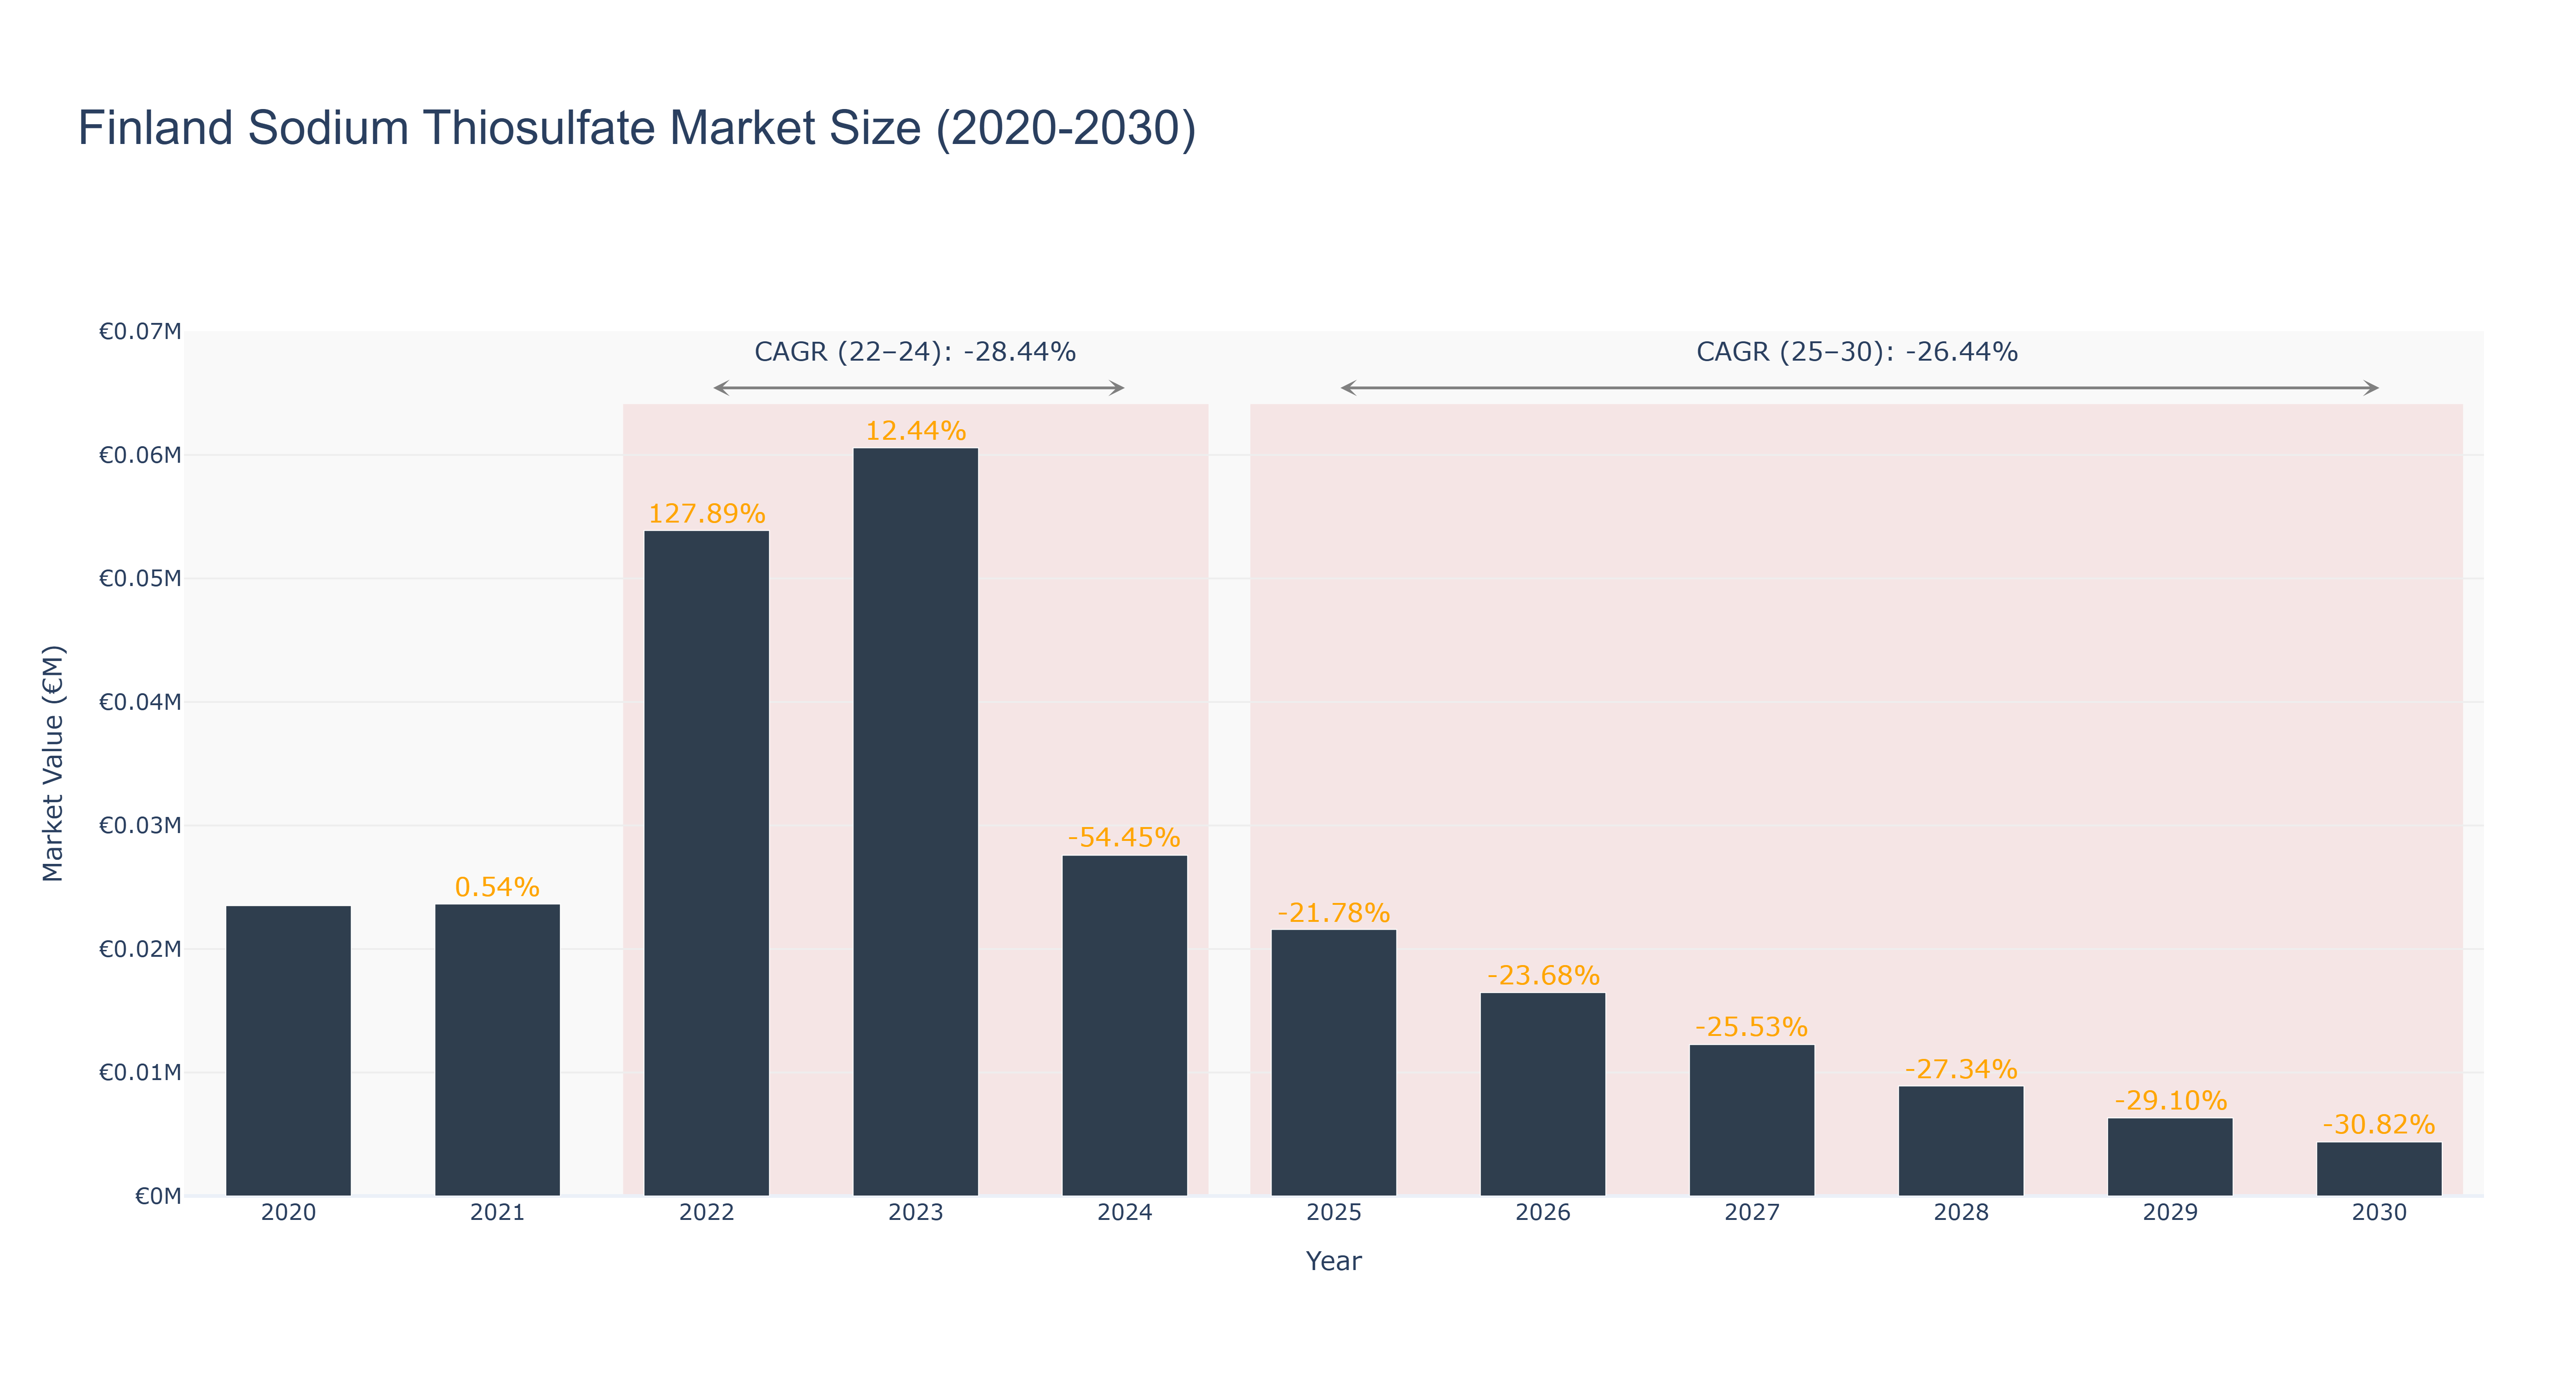
The Finland Sodium Thiosulfate Market has exhibited a volatile trajectory, peaking in 2022 with a market size of €53.87 thousand, following a remarkable growth of 127.89%. The actual market size increased modestly from €23.51 thousand in 2020 to €60.57 thousand in 2023, before experiencing a sharp decline to €27.59 thousand in 2024, resulting in a CAGR of -28.44% from 2022 to 2024. The forecasted period from 2025 to 2030 anticipates a continued downturn, with projected market sizes decreasing from €21.58 thousand in 2025 to €4.37 thousand by 2030, reflecting a CAGR of -26.44%. This decline can be attributed to reduced demand in key applications, coupled with potential regulatory changes impacting production. As the market contracts, stakeholders should closely monitor macroeconomic drivers and explore innovations or efficiency improvements to navigate this challenging landscape.
Finland Sodium Thiosulfate Market: Production & Trade Performance (2019-2025)
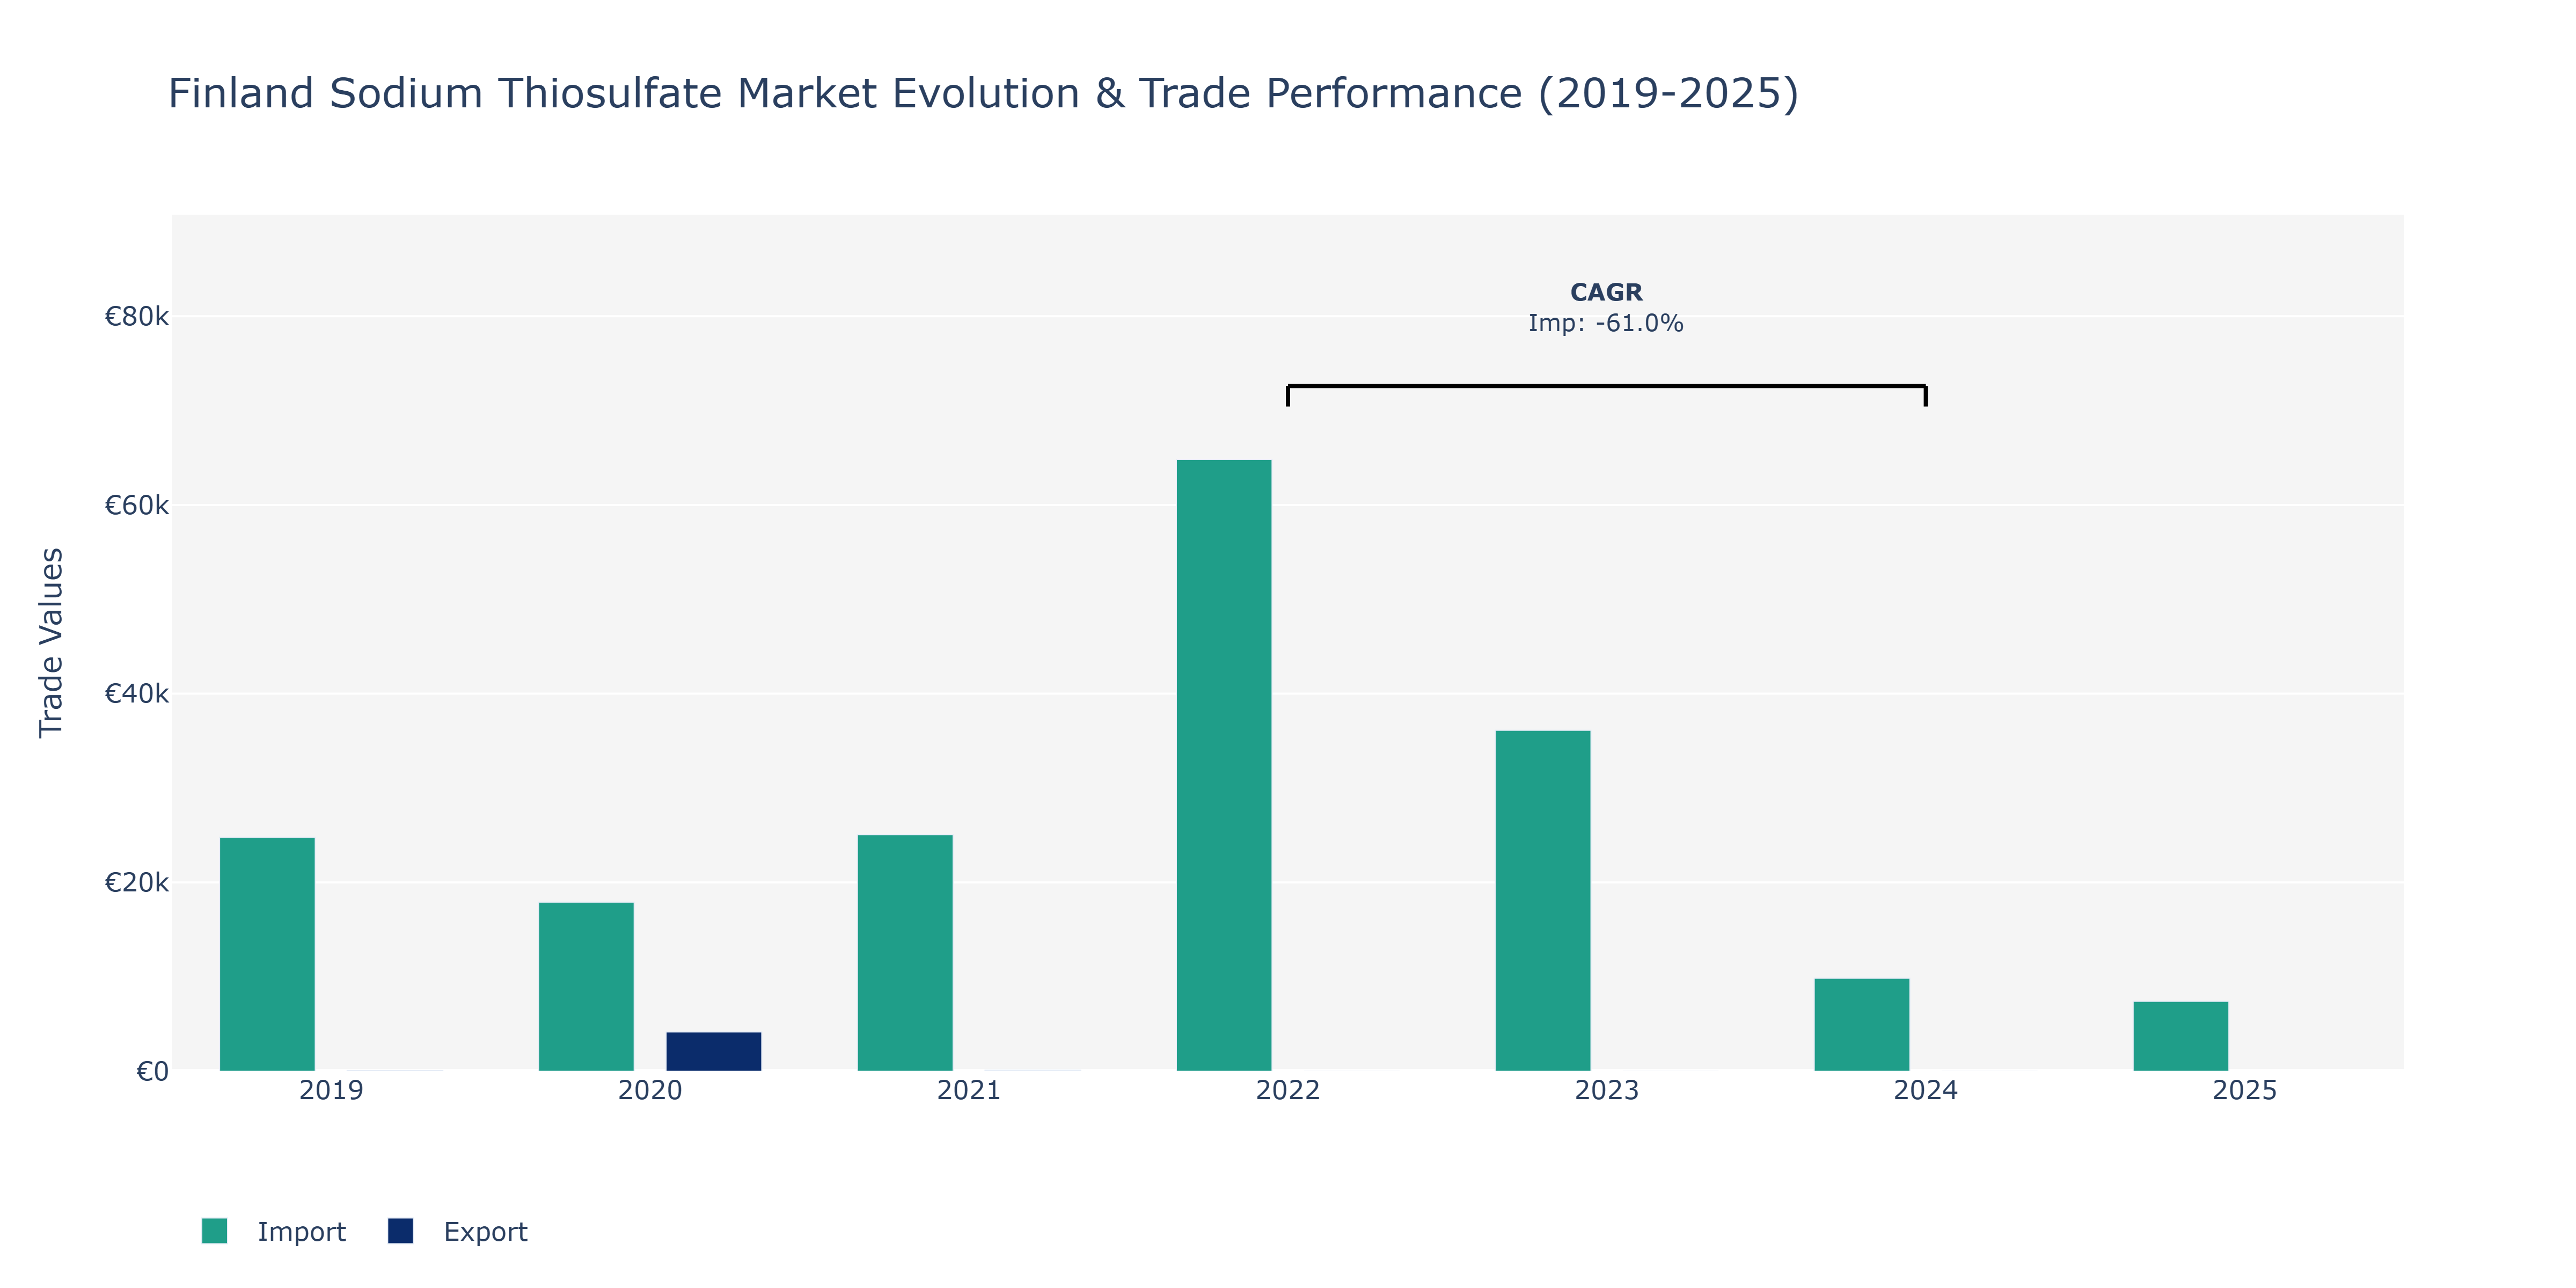
In the Finland Sodium Thiosulfate Market, imports dominated the landscape significantly over the years. In 2019, imports were at €24.8 thousand, showcasing a stark contrast to the €60 in exports for the same year. The market saw a notable shift in 2020 as exports surged to €4.17 thousand, while imports decreased to €17.91 thousand. However, this trend was short-lived as exports dropped to €115 in 2021, while imports rose to €25.06 thousand. The peak in imports was observed in 2022 at €64.83 thousand, followed by a substantial decline to €9.85 thousand in 2024. The subsequent years witnessed a further decrease in imports to €7.41 thousand in 2025. The market dynamics could be attributed to shifts in demand patterns, changes in global supply chains, and evolving industry regulations impacting trade volumes in the sodium thiosulfate market.
Key Highlights of the Report:
- Finland Sodium Thiosulfate Market Outlook
- Market Size of Finland Sodium Thiosulfate Market, 2025
- Forecast of Finland Sodium Thiosulfate Market, 2032
- Historical Data and Forecast of Finland Sodium Thiosulfate Revenues & Volume for the Period 2022 - 2032F
- Finland Sodium Thiosulfate Market Trend Evolution
- Finland Sodium Thiosulfate Market Drivers and Challenges
- Finland Sodium Thiosulfate Price Trends
- Finland Sodium Thiosulfate Porter's Five Forces
- Finland Sodium Thiosulfate Industry Life Cycle
- Historical Data and Forecast of Finland Sodium Thiosulfate Market Revenues & Volume By Form for the Period 2022 - 2032F
- Historical Data and Forecast of Finland Sodium Thiosulfate Market Revenues & Volume By Powder for the Period 2022 - 2032F
- Historical Data and Forecast of Finland Sodium Thiosulfate Market Revenues & Volume By Granular for the Period 2022 - 2032F
- Historical Data and Forecast of Finland Sodium Thiosulfate Market Revenues & Volume By Liquid for the Period 2022 - 2032F
- Historical Data and Forecast of Finland Sodium Thiosulfate Market Revenues & Volume By Crystalline for the Period 2022 - 2032F
- Historical Data and Forecast of Finland Sodium Thiosulfate Market Revenues & Volume By Application for the Period 2022 - 2032F
- Historical Data and Forecast of Finland Sodium Thiosulfate Market Revenues & Volume By Medical Detoxification for the Period 2022 - 2032F
- Historical Data and Forecast of Finland Sodium Thiosulfate Market Revenues & Volume By Water Dechlorination for the Period 2022 - 2032F
- Historical Data and Forecast of Finland Sodium Thiosulfate Market Revenues & Volume By Photography for the Period 2022 - 2032F
- Historical Data and Forecast of Finland Sodium Thiosulfate Market Revenues & Volume By Gold Extraction for the Period 2022 - 2032F
- Historical Data and Forecast of Finland Sodium Thiosulfate Market Revenues & Volume By Manufacturing Process for the Period 2022 - 2032F
- Historical Data and Forecast of Finland Sodium Thiosulfate Market Revenues & Volume By Sulfur Reduction for the Period 2022 - 2032F
- Historical Data and Forecast of Finland Sodium Thiosulfate Market Revenues & Volume By Electrolytic Process for the Period 2022 - 2032F
- Historical Data and Forecast of Finland Sodium Thiosulfate Market Revenues & Volume By Chemical Synthesis for the Period 2022 - 2032F
- Historical Data and Forecast of Finland Sodium Thiosulfate Market Revenues & Volume By Sulfite Process for the Period 2022 - 2032F
- Historical Data and Forecast of Finland Sodium Thiosulfate Market Revenues & Volume By End User for the Period 2022 - 2032F
- Historical Data and Forecast of Finland Sodium Thiosulfate Market Revenues & Volume By Pharmaceuticals for the Period 2022 - 2032F
- Historical Data and Forecast of Finland Sodium Thiosulfate Market Revenues & Volume By Water Treatment for the Period 2022 - 2032F
- Historical Data and Forecast of Finland Sodium Thiosulfate Market Revenues & Volume By Photography Industry for the Period 2022 - 2032F
- Historical Data and Forecast of Finland Sodium Thiosulfate Market Revenues & Volume By Mining Industry for the Period 2022 - 2032F
- Historical Data and Forecast of Finland Sodium Thiosulfate Market Revenues & Volume By Packaging Type for the Period 2022 - 2032F
- Historical Data and Forecast of Finland Sodium Thiosulfate Market Revenues & Volume By Bags for the Period 2022 - 2032F
- Historical Data and Forecast of Finland Sodium Thiosulfate Market Revenues & Volume By Drums for the Period 2022 - 2032F
- Historical Data and Forecast of Finland Sodium Thiosulfate Market Revenues & Volume By Containers for the Period 2022 - 2032F
- Historical Data and Forecast of Finland Sodium Thiosulfate Market Revenues & Volume By Bulk Storage for the Period 2022 - 2032F
- Finland Sodium Thiosulfate Import Export Trade Statistics
- Market Opportunity Assessment By Form
- Market Opportunity Assessment By Application
- Market Opportunity Assessment By Manufacturing Process
- Market Opportunity Assessment By End User
- Market Opportunity Assessment By Packaging Type
- Finland Sodium Thiosulfate Top Companies Market Share
- Finland Sodium Thiosulfate Competitive Benchmarking By Technical and Operational Parameters
- Finland Sodium Thiosulfate Company Profiles
- Finland Sodium Thiosulfate Key Strategic Recommendations
Frequently Asked Questions About the Market Study (FAQs):
6Wresearch actively monitors the Finland Sodium Thiosulfate Market and publishes its comprehensive annual report, highlighting emerging trends, growth drivers, revenue analysis, and forecast outlook. Our insights help businesses to make data-backed strategic decisions with ongoing market dynamics. Our analysts track relevent industries related to the Finland Sodium Thiosulfate Market, allowing our clients with actionable intelligence and reliable forecasts tailored to emerging regional needs.
Yes, we provide customisation as per your requirements. To learn more, feel free to contact us on sales@6wresearch.com
1 Executive Summary |
2 Introduction |
2.1 Key Highlights of the Report |
2.2 Report Description |
2.3 Market Scope & Segmentation |
2.4 Research Methodology |
2.5 Assumptions |
3 Finland Sodium Thiosulfate Market Overview |
3.1 Finland Country Macro Economic Indicators |
3.2 Finland Sodium Thiosulfate Market Revenues & Volume, 2022 & 2032F |
3.3 Finland Sodium Thiosulfate Market - Industry Life Cycle |
3.4 Finland Sodium Thiosulfate Market - Porter's Five Forces |
3.5 Finland Sodium Thiosulfate Market Revenues & Volume Share, By Form, 2022 & 2032F |
3.6 Finland Sodium Thiosulfate Market Revenues & Volume Share, By Application, 2022 & 2032F |
3.7 Finland Sodium Thiosulfate Market Revenues & Volume Share, By Manufacturing Process, 2022 & 2032F |
3.8 Finland Sodium Thiosulfate Market Revenues & Volume Share, By End User, 2022 & 2032F |
3.9 Finland Sodium Thiosulfate Market Revenues & Volume Share, By Packaging Type, 2022 & 2032F |
4 Finland Sodium Thiosulfate Market Dynamics |
4.1 Impact Analysis |
4.2 Market Drivers |
4.2.1 Increasing demand for sodium thiosulfate in the photography industry |
4.2.2 Growing adoption of sodium thiosulfate in medical applications, such as treatment for cyanide poisoning |
4.2.3 Rising use of sodium thiosulfate in water treatment processes |
4.3 Market Restraints |
4.3.1 Fluctuating prices of raw materials used in the production of sodium thiosulfate |
4.3.2 Stringent regulations related to the handling and disposal of sodium thiosulfate waste |
4.3.3 Competition from alternative chemicals or treatment methods in various industries |
5 Finland Sodium Thiosulfate Market Trends |
6 Finland Sodium Thiosulfate Market, By Types |
6.1 Finland Sodium Thiosulfate Market, By Form |
6.1.1 Overview and Analysis |
6.1.2 Finland Sodium Thiosulfate Market Revenues & Volume, By Form, 2022 - 2032F |
6.1.3 Finland Sodium Thiosulfate Market Revenues & Volume, By Powder, 2022 - 2032F |
6.1.4 Finland Sodium Thiosulfate Market Revenues & Volume, By Granular, 2022 - 2032F |
6.1.5 Finland Sodium Thiosulfate Market Revenues & Volume, By Liquid, 2022 - 2032F |
6.1.6 Finland Sodium Thiosulfate Market Revenues & Volume, By Crystalline, 2022 - 2032F |
6.2 Finland Sodium Thiosulfate Market, By Application |
6.2.1 Overview and Analysis |
6.2.2 Finland Sodium Thiosulfate Market Revenues & Volume, By Medical Detoxification, 2022 - 2032F |
6.2.3 Finland Sodium Thiosulfate Market Revenues & Volume, By Water Dechlorination, 2022 - 2032F |
6.2.4 Finland Sodium Thiosulfate Market Revenues & Volume, By Photography, 2022 - 2032F |
6.2.5 Finland Sodium Thiosulfate Market Revenues & Volume, By Gold Extraction, 2022 - 2032F |
6.3 Finland Sodium Thiosulfate Market, By Manufacturing Process |
6.3.1 Overview and Analysis |
6.3.2 Finland Sodium Thiosulfate Market Revenues & Volume, By Sulfur Reduction, 2022 - 2032F |
6.3.3 Finland Sodium Thiosulfate Market Revenues & Volume, By Electrolytic Process, 2022 - 2032F |
6.3.4 Finland Sodium Thiosulfate Market Revenues & Volume, By Chemical Synthesis, 2022 - 2032F |
6.3.5 Finland Sodium Thiosulfate Market Revenues & Volume, By Sulfite Process, 2022 - 2032F |
6.4 Finland Sodium Thiosulfate Market, By End User |
6.4.1 Overview and Analysis |
6.4.2 Finland Sodium Thiosulfate Market Revenues & Volume, By Pharmaceuticals, 2022 - 2032F |
6.4.3 Finland Sodium Thiosulfate Market Revenues & Volume, By Water Treatment, 2022 - 2032F |
6.4.4 Finland Sodium Thiosulfate Market Revenues & Volume, By Photography Industry, 2022 - 2032F |
6.4.5 Finland Sodium Thiosulfate Market Revenues & Volume, By Mining Industry, 2022 - 2032F |
6.5 Finland Sodium Thiosulfate Market, By Packaging Type |
6.5.1 Overview and Analysis |
6.5.2 Finland Sodium Thiosulfate Market Revenues & Volume, By Bags, 2022 - 2032F |
6.5.3 Finland Sodium Thiosulfate Market Revenues & Volume, By Drums, 2022 - 2032F |
6.5.4 Finland Sodium Thiosulfate Market Revenues & Volume, By Containers, 2022 - 2032F |
6.5.5 Finland Sodium Thiosulfate Market Revenues & Volume, By Bulk Storage, 2022 - 2032F |
7 Finland Sodium Thiosulfate Market Import-Export Trade Statistics |
7.1 Finland Sodium Thiosulfate Market Export to Major Countries |
7.2 Finland Sodium Thiosulfate Market Imports from Major Countries |
8 Finland Sodium Thiosulfate Market Key Performance Indicators |
8.1 Number of new applications or industries adopting sodium thiosulfate |
8.2 Percentage of revenue generated from new product developments or applications |
8.3 Environmental impact indicators related to the use and disposal of sodium thiosulfate |
9 Finland Sodium Thiosulfate Market - Opportunity Assessment |
9.1 Finland Sodium Thiosulfate Market Opportunity Assessment, By Form, 2022 & 2032F |
9.2 Finland Sodium Thiosulfate Market Opportunity Assessment, By Application, 2022 & 2032F |
9.3 Finland Sodium Thiosulfate Market Opportunity Assessment, By Manufacturing Process, 2022 & 2032F |
9.4 Finland Sodium Thiosulfate Market Opportunity Assessment, By End User, 2022 & 2032F |
9.5 Finland Sodium Thiosulfate Market Opportunity Assessment, By Packaging Type, 2022 & 2032F |
10 Finland Sodium Thiosulfate Market - Competitive Landscape |
10.1 Finland Sodium Thiosulfate Market Revenue Share, By Companies, 2025 |
10.2 Finland Sodium Thiosulfate Market Competitive Benchmarking, By Operating and Technical Parameters |
11 Company Profiles |
12 Recommendations |
13 Disclaimer |
Global Go To Market Strategy - 2030
Export potential enables firms to identify high-growth global markets with greater confidence by combining advanced trade intelligence with a structured quantitative methodology. The framework analyzes emerging demand trends and country-level import patterns while integrating macroeconomic and trade datasets such as GDP and population forecasts, bilateral import–export flows, tariff structures, elasticity differentials between developed and developing economies, geographic distance, and import demand projections. Using weighted trade values from 2020–2024 as the base period to project country-to-country export potential for 2030, these inputs are operationalized through calculated drivers such as gravity model parameters, tariff impact factors, and projected GDP per-capita growth. Through an analysis of hidden potentials, demand hotspots, and market conditions that are most favorable to success, this method enables firms to focus on target countries, maximize returns, and global expansion with data, backed by accuracy.
By factoring in the projected importer demand gap that is currently unmet and could be potential opportunity, it identifies the potential for the Exporter (Country) among 190 countries, against the general trade analysis, which identifies the biggest importer or exporter.
To discover high-growth global markets and optimize your business strategy:
Click Here
Pricing
- Single User License$ 1,995
- Department License$ 2,400
- Site License$ 3,120
- Global License$ 3,795

Leadership Perspectives from Industry Events
Search
Thought Leadership and Analyst Meet


Our Clients
6WResearch In News
- India Export Attractiveness Tracker 2026
- India Air Conditioner Market Set for Strong Rebound in 2026 After Weather-Led Correction and GST-Driven Recovery: 6Wresearch
- ADAS in India: How Automatic Emergency Braking, Blind Spot Detection & Driver Monitoring are Transforming Road Safety
- Doha a strategic location for EV manufacturing hub: IPA Qatar
- Demand for luxury TVs surging in the GCC, says Samsung
- Empowering Growth: The Thriving Journey of Bangladesh’s Cable Industry
Latest Reports
- Nicaragua RPG Gaming Market (2026-2032)
- New Zealand RPG Gaming Market (2026-2032)
- Netherlands RPG Gaming Market (2026-2032)
- Nauru RPG Gaming Market (2026-2032)
- Namibia RPG Gaming Market (2026-2032)
- Mozambique RPG Gaming Market (2026-2032)
- Montenegro RPG Gaming Market (2026-2032)
- Mongolia RPG Gaming Market (2026-2032)
- Monaco RPG Gaming Market (2026-2032)
- Micronesia RPG Gaming Market (2026-2032)
Industry Events and Analyst Meet

EV India Expo 2026

HIMTEX 2026

India Refining Summit 2026

India EV Show 2026

EV tech India Expo 2026
Whitepaper
- Middle East & Africa Commercial Security Market Click here to view more.
- Middle East & Africa Fire Safety Systems & Equipment Market Click here to view more.
- GCC Drone Market Click here to view more.
- Middle East Lighting Fixture Market Click here to view more.
- GCC Physical & Perimeter Security Market Click here to view more.