Georgia Aniline Derivatives Market (2026-2032) Outlook | Forecast, Revenue, Share, Size, Trends, Analysis, Value, Companies, Growth & Industry
Market Forecast By Derivative (N-Methyl Aniline (NMA), N,N-Dimethyl Aniline (DMA), N-Ethyl Aniline (NEA), N,N-Diethyl Aniline (DEA)), By Application (Drug Production, Polyurethane, Agrochemicals, Dyes & Pigments, Rubber Processing, Varnishes, Explosives, Others), By End Use (Pharmaceutical, Plastic, Agriculture, Textile, Rubber, Paints & Inks, Others) And Competitive Landscape
| Product Code: ETC312360 | Publication Date: Aug 2022 | Updated Date: Jul 2026 | Product Type: Market Research Report | |
| Publisher: 6Wresearch | Author: Vasudha | No. of Pages: 75 | No. of Figures: 35 | No. of Tables: 20 |
Georgia Aniline Derivatives Market Size, Share & Growth Rate
The Georgia Aniline Derivatives Market was estimated at USD 171 Million in 2025 and is projected to reach USD 239 Million by 2032, growing at a CAGR of 4.9% from 2026 to 2032. This growth trajectory is fueled by increasing applications of aniline derivatives in the textiles, automotive, and construction sectors, as well as the burgeoning demand for sustainable and eco-friendly products. The strategic positioning of Georgia, coupled with a robust manufacturing infrastructure, is also set to enhance market opportunities over the forecast period.
Georgia Aniline Derivatives Market Year-wise Growth Rate and Key Drivers
This graph highlights how the Georgia Aniline Derivatives Market has steadily grown over the years, supported by major growth factors.
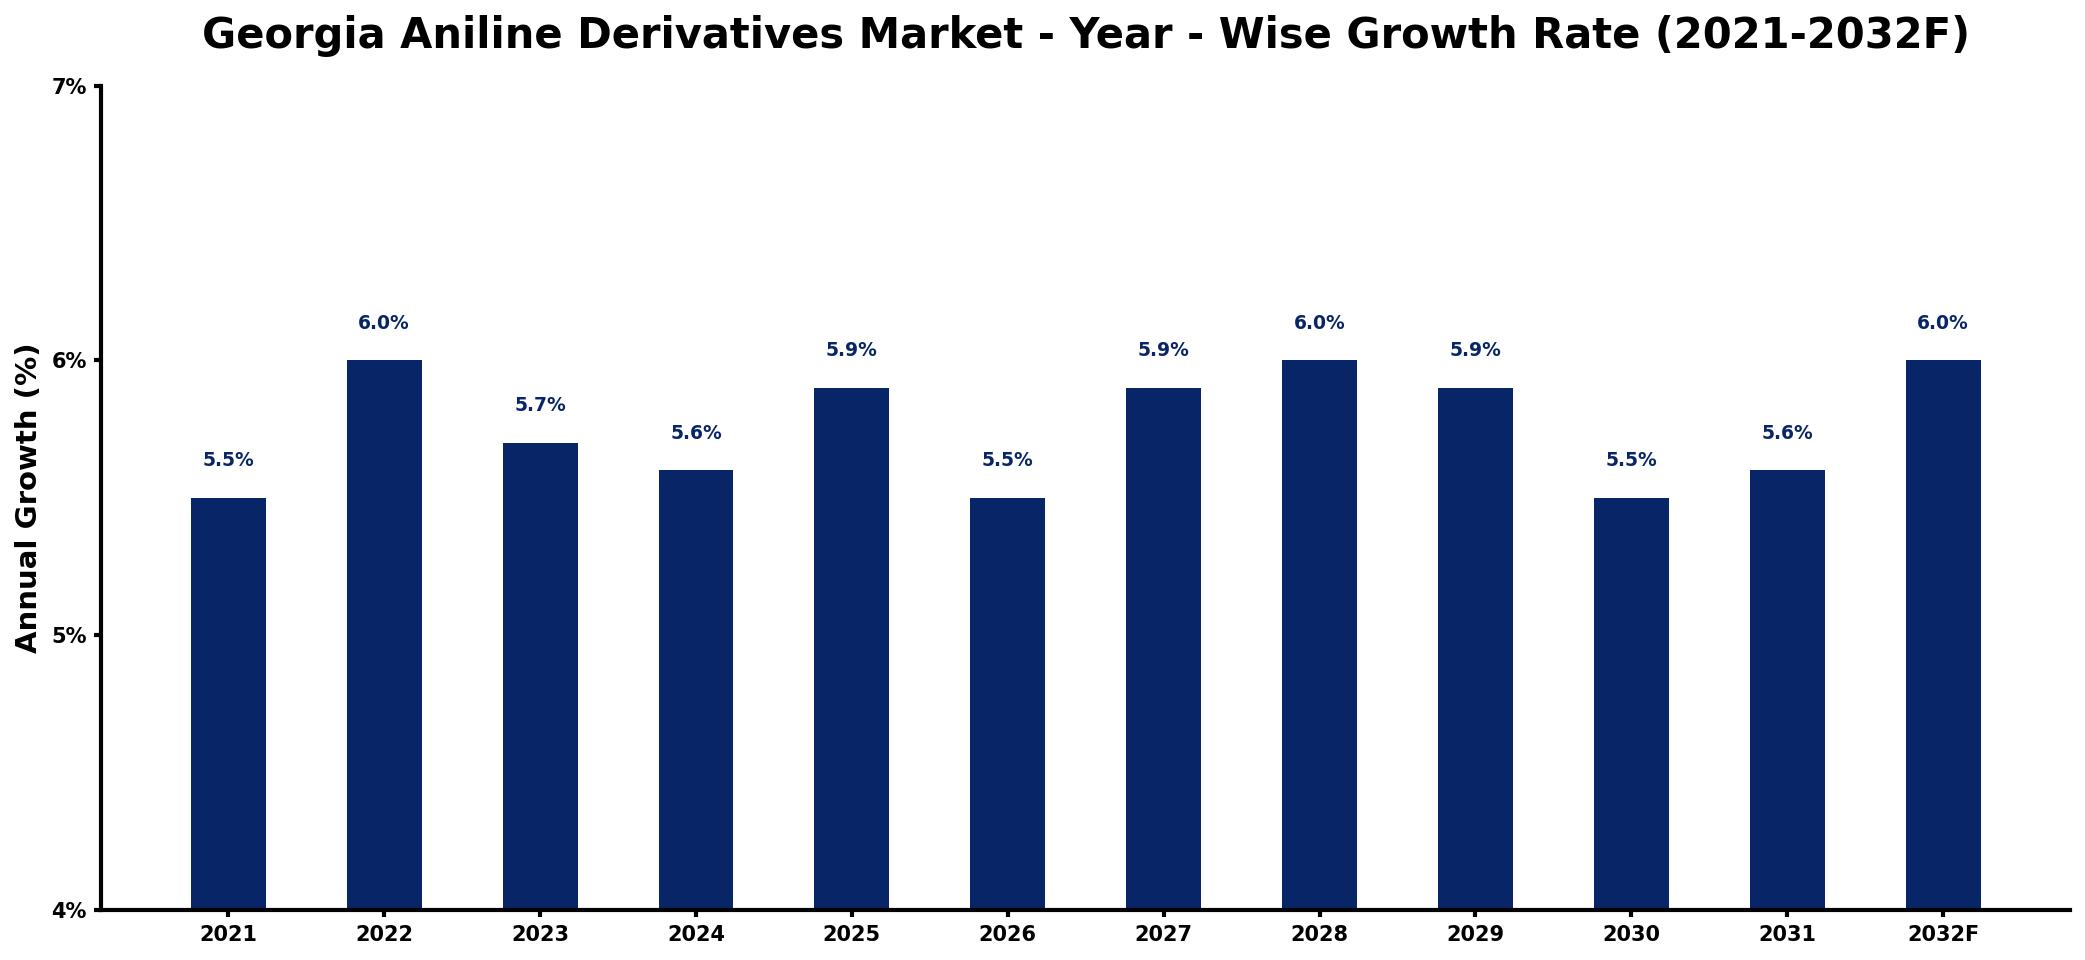
The table below presents the year‑wise growth rates along with the key drivers influencing the market
| Year | Growth Rate | Major Drivers |
| 2021 | 5.5% | Rising demand from textile industry |
| 2022 | 6.0% | Increased investment in R&D |
| 2023 | 5.7% | Expansion of chemical manufacturing sector |
| 2024 | 5.6% | Growing automotive production rates |
| 2025 | 5.9% | Higher usage in agricultural chemicals |
| 2026 | 5.5% | Demand growth from pharmaceutical applications |
| 2027 | 5.9% | Increasing focus on sustainability initiatives |
| 2028 | 6.0% | Emerging markets driving consumption |
| 2029 | 5.9% | Technological advancements in production |
| 2030 | 5.5% | Strengthening global supply chains |
| 2031 | 5.6% | Regulatory support for innovation efforts |
| 2032 | 6.0% | Rising consumer preference for quality |
Note: Market size estimations and growth projections presented in this report are based on 6Wresearch's proprietary forecasting methodology, utilizing the latest available industry data, government publications, and primary research inputs.
Georgia Aniline Derivatives Market Synopsis
Currently, the Georgia aniline derivatives market serves as a vibrant hub for a variety of chemical products, from dyes and pigments to specialized chemicals for rubber processing and pharmaceuticals. This market not only plays a crucial role in local manufacturing but also significantly contributes to the broader chemical landscape in Georgia.
The dynamic nature of this market reflects the increasing demand for innovative solutions in multiple sectors, highlighting the importance of technological advancements and sustainable practices. Key players are responding to consumer preferences by emphasizing eco-friendly production methods, thereby positioning themselves favorably in a competitive landscape.
Georgia Aniline Derivatives Market Key Takeaways
- The market is projected to grow substantially, driven by diverse end-user industries.
- Growing emphasis on sustainability is reshaping product development strategies.
- Georgia's strategic location facilitates access to key international markets.
- Investment in research and development is pivotal for maintaining competitive advantage.
- The market landscape is characterized by a blend of innovation and regulatory compliance.
Evaluation of Restraints in Georgia Aniline Derivatives Market
The Georgia Aniline Derivatives Market is not without its challenges. Increasing competition from international players places pressure on local manufacturers to innovate continually and manage costs effectively. Fluctuating raw material prices also pose a significant threat, necessitating strategic procurement and management practices. Moreover, the stringent regulations pertaining to environmental safety and the handling of chemicals require companies to invest heavily in compliance measures, which can strain financial resources. Coupled with a limited skilled labor pool, these factors may hinder the overall growth potential of the market.
Georgia Aniline Derivatives Market Trends
A prominent trend in the Georgia aniline derivatives market is the increasing shift toward environmentally sustainable products. With consumers becoming more aware of ecological impacts, there is a rising demand for bio-based aniline derivatives. This trend is pushing companies to adopt innovative manufacturing processes that reduce environmental footprints. Additionally, technological advancements in production efficiency are transforming operational capabilities, allowing manufacturers to meet evolving market demands effectively.
Georgia Aniline Derivatives Market Opportunities
The Georgia aniline derivatives market presents substantial investment opportunities across several sectors. Dyes and pigments, pharmaceuticals, and rubber processing chemicals stand out as areas ripe for growth, driven by increasing demands for high-quality products. Furthermore, the emphasis on sustainability opens avenues for innovative solutions that cater to eco-conscious consumers. With access to key logistics networks for export purposes, businesses can leverage Georgia's location to expand their reach into European and Asian markets effectively.
Government Initiatives in the Georgia Aniline Derivatives Market
Government policies regarding the Georgia aniline derivatives market primarily focus on enhancing safety and environmental standards. This includes implementing regulations for waste management, emissions control, and safety protocols for workers. By promoting responsible manufacturing practices, these policies aim to ensure that the industry evolves in a manner that safeguards public health and the environment. Moreover, support for research initiatives and development programs is also evident, fostering innovation within the sector.
Future Insights of the Georgia Aniline Derivatives Market
Looking ahead, the Georgia aniline derivatives market is poised for steady growth from 2026 to 2032, thanks to its strong industrial foundation and the evolving needs of various end-user industries. Sustainability will continue to be a focal point as businesses innovate to meet regulatory requirements and consumer expectations. While challenges such as raw material pricing fluctuations remain, strategic planning and a commitment to technological advancement are likely to drive the market forward, opening new avenues for growth and profitability.
Georgia Aniline Derivatives Market Latest Developments (2025 - 2026)
In recent months, the Georgia aniline derivatives market has seen a noticeable increase in investments aimed at developing sustainable production processes. Companies are actively engaging in partnerships with research institutions to accelerate innovation in eco-friendly product offerings. Moreover, there has been a significant push towards leveraging advanced technologies to optimize supply chain efficiencies. As businesses align with emerging market trends, the competitive landscape is expected to evolve rapidly, with a focus on sustainability at the forefront.
Georgia Aniline Derivatives Market - Key Attractiveness of the Report
- 10 Years of Market Numbers
- Historical Data Starting from 2022 to 2025
- Base Year: 2025
- Forecast Data until 2032
- Key Performance Indicators Impacting the Market
- Major Upcoming Developments and Projects
Key Highlights of the Report:
- Georgia Aniline Derivatives Market Outlook
- Market Size of Georgia Aniline Derivatives Market, 2025
- Forecast of Georgia Aniline Derivatives Market, 2032
- Historical Data and Forecast of Georgia Aniline Derivatives Revenues & Volume for the Period 2022-2032F
- Georgia Aniline Derivatives Market Trend Evolution
- Georgia Aniline Derivatives Market Drivers and Challenges
- Georgia Aniline Derivatives Price Trends
- Georgia Aniline Derivatives Porter's Five Forces
- Georgia Aniline Derivatives Industry Life Cycle
- Historical Data and Forecast of Georgia Aniline Derivatives Market Revenues & Volume By Derivative for the Period 2022-2032F
- Historical Data and Forecast of Georgia Aniline Derivatives Market Revenues & Volume By N-Methyl Aniline (NMA) for the Period 2022-2032F
- Historical Data and Forecast of Georgia Aniline Derivatives Market Revenues & Volume By N,N-Dimethyl Aniline (DMA) for the Period 2022-2032F
- Historical Data and Forecast of Georgia Aniline Derivatives Market Revenues & Volume By N-Ethyl Aniline (NEA) for the Period 2022-2032F
- Historical Data and Forecast of Georgia Aniline Derivatives Market Revenues & Volume By N,N-Diethyl Aniline (DEA) for the Period 2022-2032F
- Historical Data and Forecast of Georgia Aniline Derivatives Market Revenues & Volume By Application for the Period 2022-2032F
- Historical Data and Forecast of Georgia Aniline Derivatives Market Revenues & Volume By Drug Production for the Period 2022-2032F
- Historical Data and Forecast of Georgia Aniline Derivatives Market Revenues & Volume By Polyurethane for the Period 2022-2032F
- Historical Data and Forecast of Georgia Aniline Derivatives Market Revenues & Volume By Agrochemicals for the Period 2022-2032F
- Historical Data and Forecast of Georgia Aniline Derivatives Market Revenues & Volume By Dyes & Pigments for the Period 2022-2032F
- Historical Data and Forecast of Georgia Aniline Derivatives Market Revenues & Volume By Rubber Processing for the Period 2022-2032F
- Historical Data and Forecast of Georgia Aniline Derivatives Market Revenues & Volume By Varnishes for the Period 2022-2032F
- Historical Data and Forecast of Georgia Aniline Derivatives Market Revenues & Volume By Explosives for the Period 2022-2032F
- Historical Data and Forecast of Georgia Aniline Derivatives Market Revenues & Volume By Others for the Period 2022-2032F
- Historical Data and Forecast of Georgia Aniline Derivatives Market Revenues & Volume By End Use for the Period 2022-2032F
- Historical Data and Forecast of Georgia Aniline Derivatives Market Revenues & Volume By Pharmaceutical for the Period 2022-2032F
- Historical Data and Forecast of Georgia Aniline Derivatives Market Revenues & Volume By Plastic for the Period 2022-2032F
- Historical Data and Forecast of Georgia Aniline Derivatives Market Revenues & Volume By Agriculture for the Period 2022-2032F
- Historical Data and Forecast of Georgia Aniline Derivatives Market Revenues & Volume By Textile for the Period 2022-2032F
- Historical Data and Forecast of Georgia Aniline Derivatives Market Revenues & Volume By Rubber for the Period 2022-2032F
- Historical Data and Forecast of Georgia Aniline Derivatives Market Revenues & Volume By Paints & Inks for the Period 2022-2032F
- Historical Data and Forecast of Georgia Aniline Derivatives Market Revenues & Volume By Others for the Period 2022-2032F
- Georgia Aniline Derivatives Import Export Trade Statistics
- Market Opportunity Assessment By Derivative
- Market Opportunity Assessment By Application
- Market Opportunity Assessment By End Use
- Georgia Aniline Derivatives Top Companies Market Share
- Georgia Aniline Derivatives Competitive Benchmarking By Technical and Operational Parameters
- Georgia Aniline Derivatives Company Profiles
- Georgia Aniline Derivatives Key Strategic Recommendations
Frequently Asked Questions About the Market Study (FAQs):
The Georgia Aniline Derivatives Market was estimated at USD 171 Million in 2025 and is projected to reach USD 239 Million by 2032, growing at a CAGR of 4.9% from 2026 to 2032.
Key sectors such as textiles, automotive, and pharmaceuticals are significantly driving demand, with the construction industry also playing a vital role.
The market is increasingly influenced by trends towards sustainability and the development of eco-friendly products, alongside technological advancements in manufacturing processes.
The government implements regulations aimed at environmental safety and supports innovation through policies that promote research and development within the sector.
Companies must navigate increasing competition, regulatory compliance, and fluctuating raw material prices, which can impact profitability and operational efficiency.
6Wresearch actively monitors the Georgia Aniline Derivatives Market and publishes its comprehensive annual report, highlighting emerging trends, growth drivers, revenue analysis, and forecast outlook. Our insights help businesses to make data-backed strategic decisions with ongoing market dynamics. Our analysts track relevent industries related to the Georgia Aniline Derivatives Market, allowing our clients with actionable intelligence and reliable forecasts tailored to emerging regional needs.
Yes, we provide customisation as per your requirements. To learn more, feel free to contact us on sales@6wresearch.com
1 Executive Summary |
2 Introduction |
2.1 Key Highlights of the Report |
2.2 Report Description |
2.3 Market Scope & Segmentation |
2.4 Research Methodology |
2.5 Assumptions |
3 Georgia Aniline Derivatives Market Overview |
3.1 Georgia Country Macro Economic Indicators |
3.2 Georgia Aniline Derivatives Market Revenues & Volume, 2022 & 2032F |
3.3 Georgia Aniline Derivatives Market - Industry Life Cycle |
3.4 Georgia Aniline Derivatives Market - Porter's Five Forces |
3.5 Georgia Aniline Derivatives Market Revenues & Volume Share, By Derivative, 2022 & 2032F |
3.6 Georgia Aniline Derivatives Market Revenues & Volume Share, By Application, 2022 & 2032F |
3.7 Georgia Aniline Derivatives Market Revenues & Volume Share, By End Use, 2022 & 2032F |
4 Georgia Aniline Derivatives Market Dynamics |
4.1 Impact Analysis |
4.2 Market Drivers |
4.2.1 Increasing demand for aniline derivatives in the textile industry for dyeing and printing applications |
4.2.2 Growing usage of aniline derivatives in the rubber industry for manufacturing rubber accelerators and antioxidants |
4.2.3 Rising adoption of aniline derivatives in the pharmaceutical sector for the production of medicines and drugs |
4.3 Market Restraints |
4.3.1 Fluctuating prices of raw materials such as benzene and nitrobenzene impacting the production cost of aniline derivatives |
4.3.2 Stringent environmental regulations regarding the disposal of waste products generated during the manufacturing process |
5 Georgia Aniline Derivatives Market Trends |
6 Georgia Aniline Derivatives Market, By Types |
6.1 Georgia Aniline Derivatives Market, By Derivative |
6.1.1 Overview and Analysis |
6.1.2 Georgia Aniline Derivatives Market Revenues & Volume, By Derivative, 2022-2032F |
6.1.3 Georgia Aniline Derivatives Market Revenues & Volume, By N-Methyl Aniline (NMA), 2022-2032F |
6.1.4 Georgia Aniline Derivatives Market Revenues & Volume, By N,N-Dimethyl Aniline (DMA), 2022-2032F |
6.1.5 Georgia Aniline Derivatives Market Revenues & Volume, By N-Ethyl Aniline (NEA), 2022-2032F |
6.1.6 Georgia Aniline Derivatives Market Revenues & Volume, By N,N-Diethyl Aniline (DEA), 2022-2032F |
6.2 Georgia Aniline Derivatives Market, By Application |
6.2.1 Overview and Analysis |
6.2.2 Georgia Aniline Derivatives Market Revenues & Volume, By Drug Production, 2022-2032F |
6.2.3 Georgia Aniline Derivatives Market Revenues & Volume, By Polyurethane, 2022-2032F |
6.2.4 Georgia Aniline Derivatives Market Revenues & Volume, By Agrochemicals, 2022-2032F |
6.2.5 Georgia Aniline Derivatives Market Revenues & Volume, By Dyes & Pigments, 2022-2032F |
6.2.6 Georgia Aniline Derivatives Market Revenues & Volume, By Rubber Processing, 2022-2032F |
6.2.7 Georgia Aniline Derivatives Market Revenues & Volume, By Varnishes, 2022-2032F |
6.2.8 Georgia Aniline Derivatives Market Revenues & Volume, By Others, 2022-2032F |
6.2.9 Georgia Aniline Derivatives Market Revenues & Volume, By Others, 2022-2032F |
6.3 Georgia Aniline Derivatives Market, By End Use |
6.3.1 Overview and Analysis |
6.3.2 Georgia Aniline Derivatives Market Revenues & Volume, By Pharmaceutical, 2022-2032F |
6.3.3 Georgia Aniline Derivatives Market Revenues & Volume, By Plastic, 2022-2032F |
6.3.4 Georgia Aniline Derivatives Market Revenues & Volume, By Agriculture, 2022-2032F |
6.3.5 Georgia Aniline Derivatives Market Revenues & Volume, By Textile, 2022-2032F |
6.3.6 Georgia Aniline Derivatives Market Revenues & Volume, By Rubber, 2022-2032F |
6.3.7 Georgia Aniline Derivatives Market Revenues & Volume, By Paints & Inks, 2022-2032F |
7 Georgia Aniline Derivatives Market Import-Export Trade Statistics |
7.1 Georgia Aniline Derivatives Market Export to Major Countries |
7.2 Georgia Aniline Derivatives Market Imports from Major Countries |
8 Georgia Aniline Derivatives Market Key Performance Indicators |
8.1 Research and development investment in new aniline derivative products |
8.2 Number of patents filed for innovative aniline derivative manufacturing processes |
8.3 Percentage of market share held by sustainable and eco-friendly aniline derivative products |
9 Georgia Aniline Derivatives Market - Opportunity Assessment |
9.1 Georgia Aniline Derivatives Market Opportunity Assessment, By Derivative, 2022 & 2032F |
9.2 Georgia Aniline Derivatives Market Opportunity Assessment, By Application, 2022 & 2032F |
9.3 Georgia Aniline Derivatives Market Opportunity Assessment, By End Use, 2022 & 2032F |
10 Georgia Aniline Derivatives Market - Competitive Landscape |
10.1 Georgia Aniline Derivatives Market Revenue Share, By Companies, 2025 |
10.2 Georgia Aniline Derivatives Market Competitive Benchmarking, By Operating and Technical Parameters |
11 Company Profiles |
12 Recommendations |
13 Disclaimer |
Global Go To Market Strategy - 2030
Export potential enables firms to identify high-growth global markets with greater confidence by combining advanced trade intelligence with a structured quantitative methodology. The framework analyzes emerging demand trends and country-level import patterns while integrating macroeconomic and trade datasets such as GDP and population forecasts, bilateral import–export flows, tariff structures, elasticity differentials between developed and developing economies, geographic distance, and import demand projections. Using weighted trade values from 2020–2024 as the base period to project country-to-country export potential for 2030, these inputs are operationalized through calculated drivers such as gravity model parameters, tariff impact factors, and projected GDP per-capita growth. Through an analysis of hidden potentials, demand hotspots, and market conditions that are most favorable to success, this method enables firms to focus on target countries, maximize returns, and global expansion with data, backed by accuracy.
By factoring in the projected importer demand gap that is currently unmet and could be potential opportunity, it identifies the potential for the Exporter (Country) among 190 countries, against the general trade analysis, which identifies the biggest importer or exporter.
To discover high-growth global markets and optimize your business strategy:
Click Here
Pricing
- Single User License$ 1,995
- Department License$ 2,400
- Site License$ 3,120
- Global License$ 3,795

Leadership Perspectives from Industry Events
Search
Thought Leadership and Analyst Meet


Our Clients
6WResearch In News
- India Air Conditioner Market Set for Strong Rebound in 2026 After Weather-Led Correction and GST-Driven Recovery: 6Wresearch
- ADAS in India: How Automatic Emergency Braking, Blind Spot Detection & Driver Monitoring are Transforming Road Safety
- Doha a strategic location for EV manufacturing hub: IPA Qatar
- Demand for luxury TVs surging in the GCC, says Samsung
- Empowering Growth: The Thriving Journey of Bangladesh’s Cable Industry
- Demand for luxury TVs surging in the GCC, says Samsung
Latest Reports
- Nicaragua RPG Gaming Market (2026-2032)
- New Zealand RPG Gaming Market (2026-2032)
- Netherlands RPG Gaming Market (2026-2032)
- Nauru RPG Gaming Market (2026-2032)
- Namibia RPG Gaming Market (2026-2032)
- Mozambique RPG Gaming Market (2026-2032)
- Montenegro RPG Gaming Market (2026-2032)
- Mongolia RPG Gaming Market (2026-2032)
- Monaco RPG Gaming Market (2026-2032)
- Micronesia RPG Gaming Market (2026-2032)
Industry Events and Analyst Meet

EV India Expo 2026

HIMTEX 2026

India Refining Summit 2026

India EV Show 2026

EV tech India Expo 2026
Whitepaper
- Middle East & Africa Commercial Security Market Click here to view more.
- Middle East & Africa Fire Safety Systems & Equipment Market Click here to view more.
- GCC Drone Market Click here to view more.
- Middle East Lighting Fixture Market Click here to view more.
- GCC Physical & Perimeter Security Market Click here to view more.