Global Active Space Debris Removal Market Highlights
| Market Size (2025) | USD 0.58 Billion |
| Forecast Size (2032) | USD 1.2 Billion |
| CAGR | 10.60% |
| Base Year | 2025 |
| Forecast Period | 2026-2032 |
| Largest Region | North America |
| Fastest Growing Region | Europe |
| Largest Segment | More than 10 cm |
| Fastest Growing Segment | Between 1 cm to 10 cm |
| Leading Companies | ClearSpace SA, Astroscale Holdings, Northrop Grumman, Mission Innovation, European Space Agency |
Global Active Space Debris Removal Market Size & Growth Rate (2026-2032)
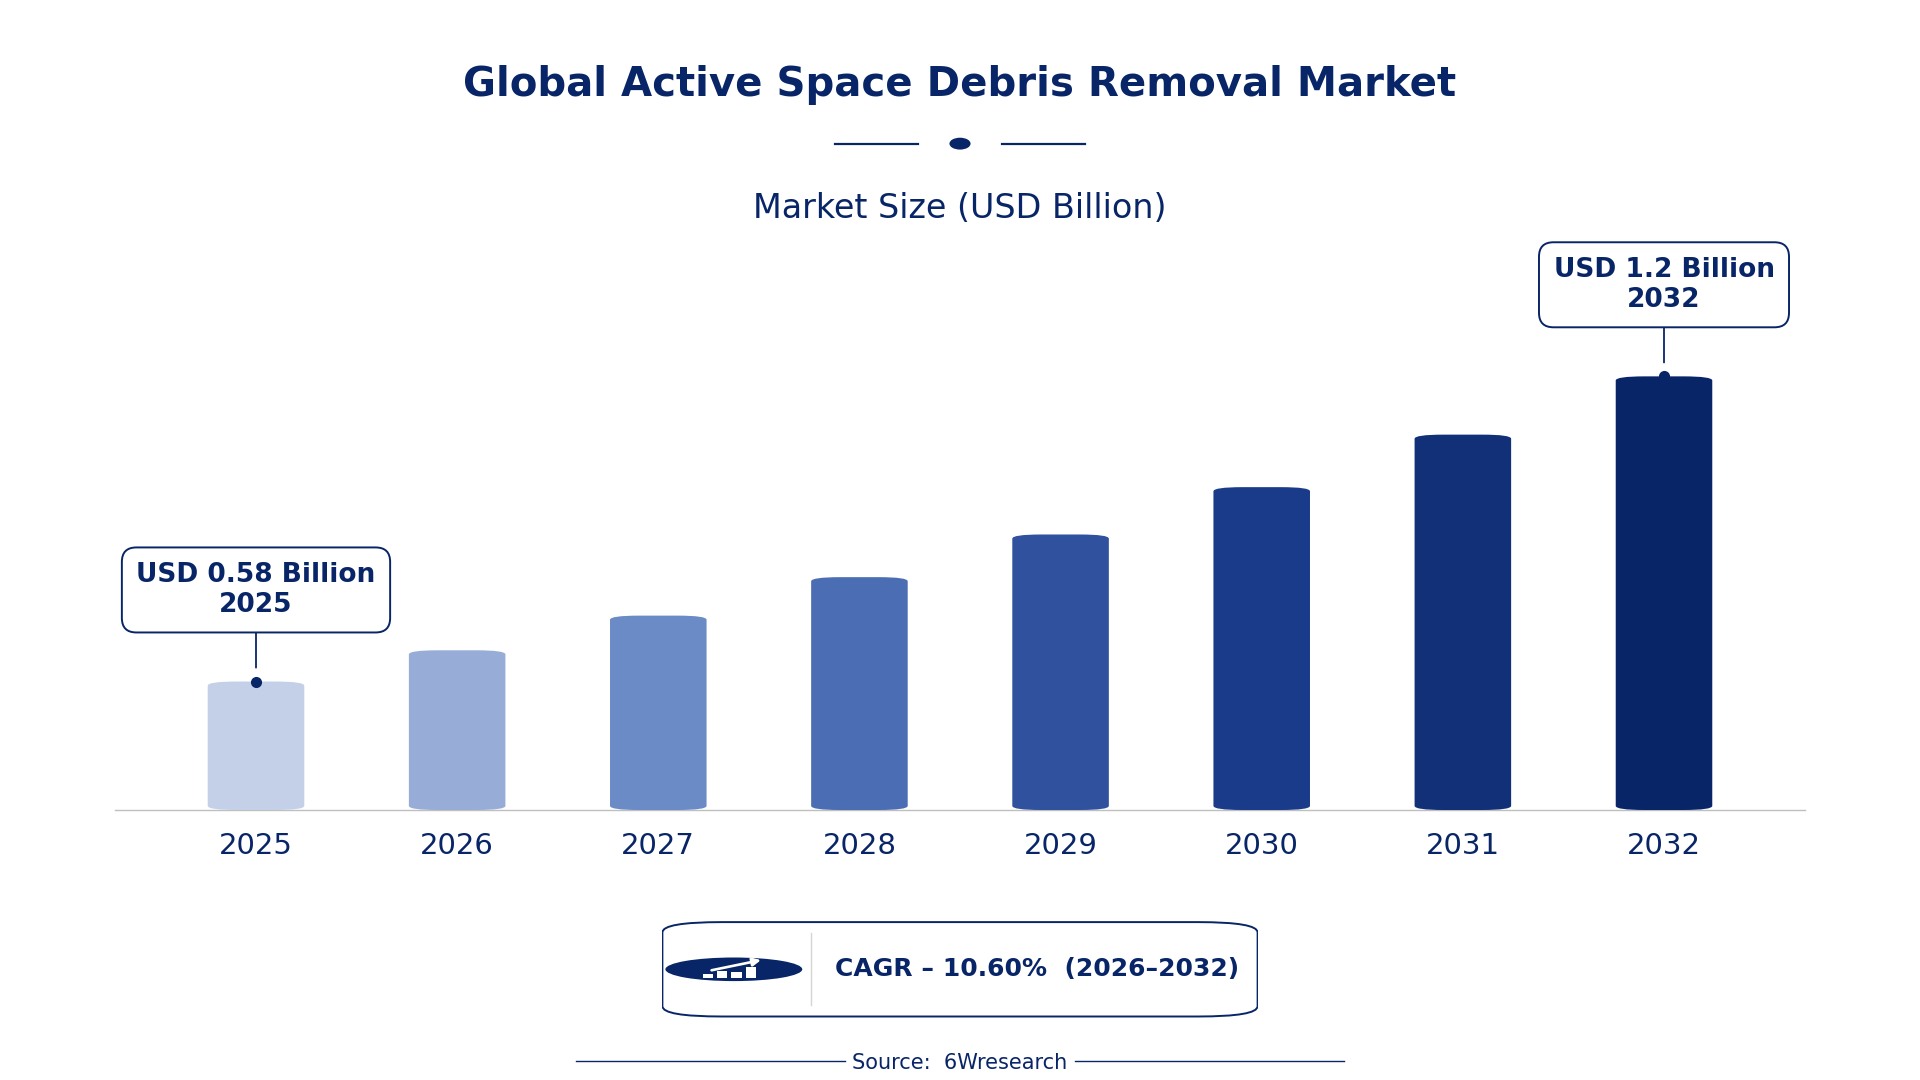
The Global Active Space Debris Removal Market was estimated at USD 0.58 Billion in 2025 and is projected to reach USD 1.2 Billion by 2032, growing at a CAGR of 10.60% from 2026 to 2032.
Global Active Space Debris Removal Market Synopsis
The increasing number of active space missions correlates directly with the rising concern over space debris, emphasizing the need for effective debris removal strategies. Industry players are now focusing on developing advanced technologies aimed at mitigating orbital collisions while ensuring the safety of existing satellites and spacecraft. Investing in active debris removal (ADR) technologies has become paramount for both private firms and government agencies.
As nations ramp up their space activities, debris remains a critical concern due to its potential to disrupt both commercial and defense satellite operations. This urgency has prompted collaborations between international entities and private firms, resulting in the acceleration of innovative solutions tailored to address the unique challenges posed by space debris. The market is evolving into a sophisticated ecosystem that stands apart from traditional aerospace sectors.
Global Active Space Debris Removal Market Year-wise Growth Rate and Key Drivers
This graph illustrates the annual growth rates of the Global Active Space Debris Removal Market from 2022 to 2032, highlighting a steady upward trajectory and projected expansion over the forecast period.
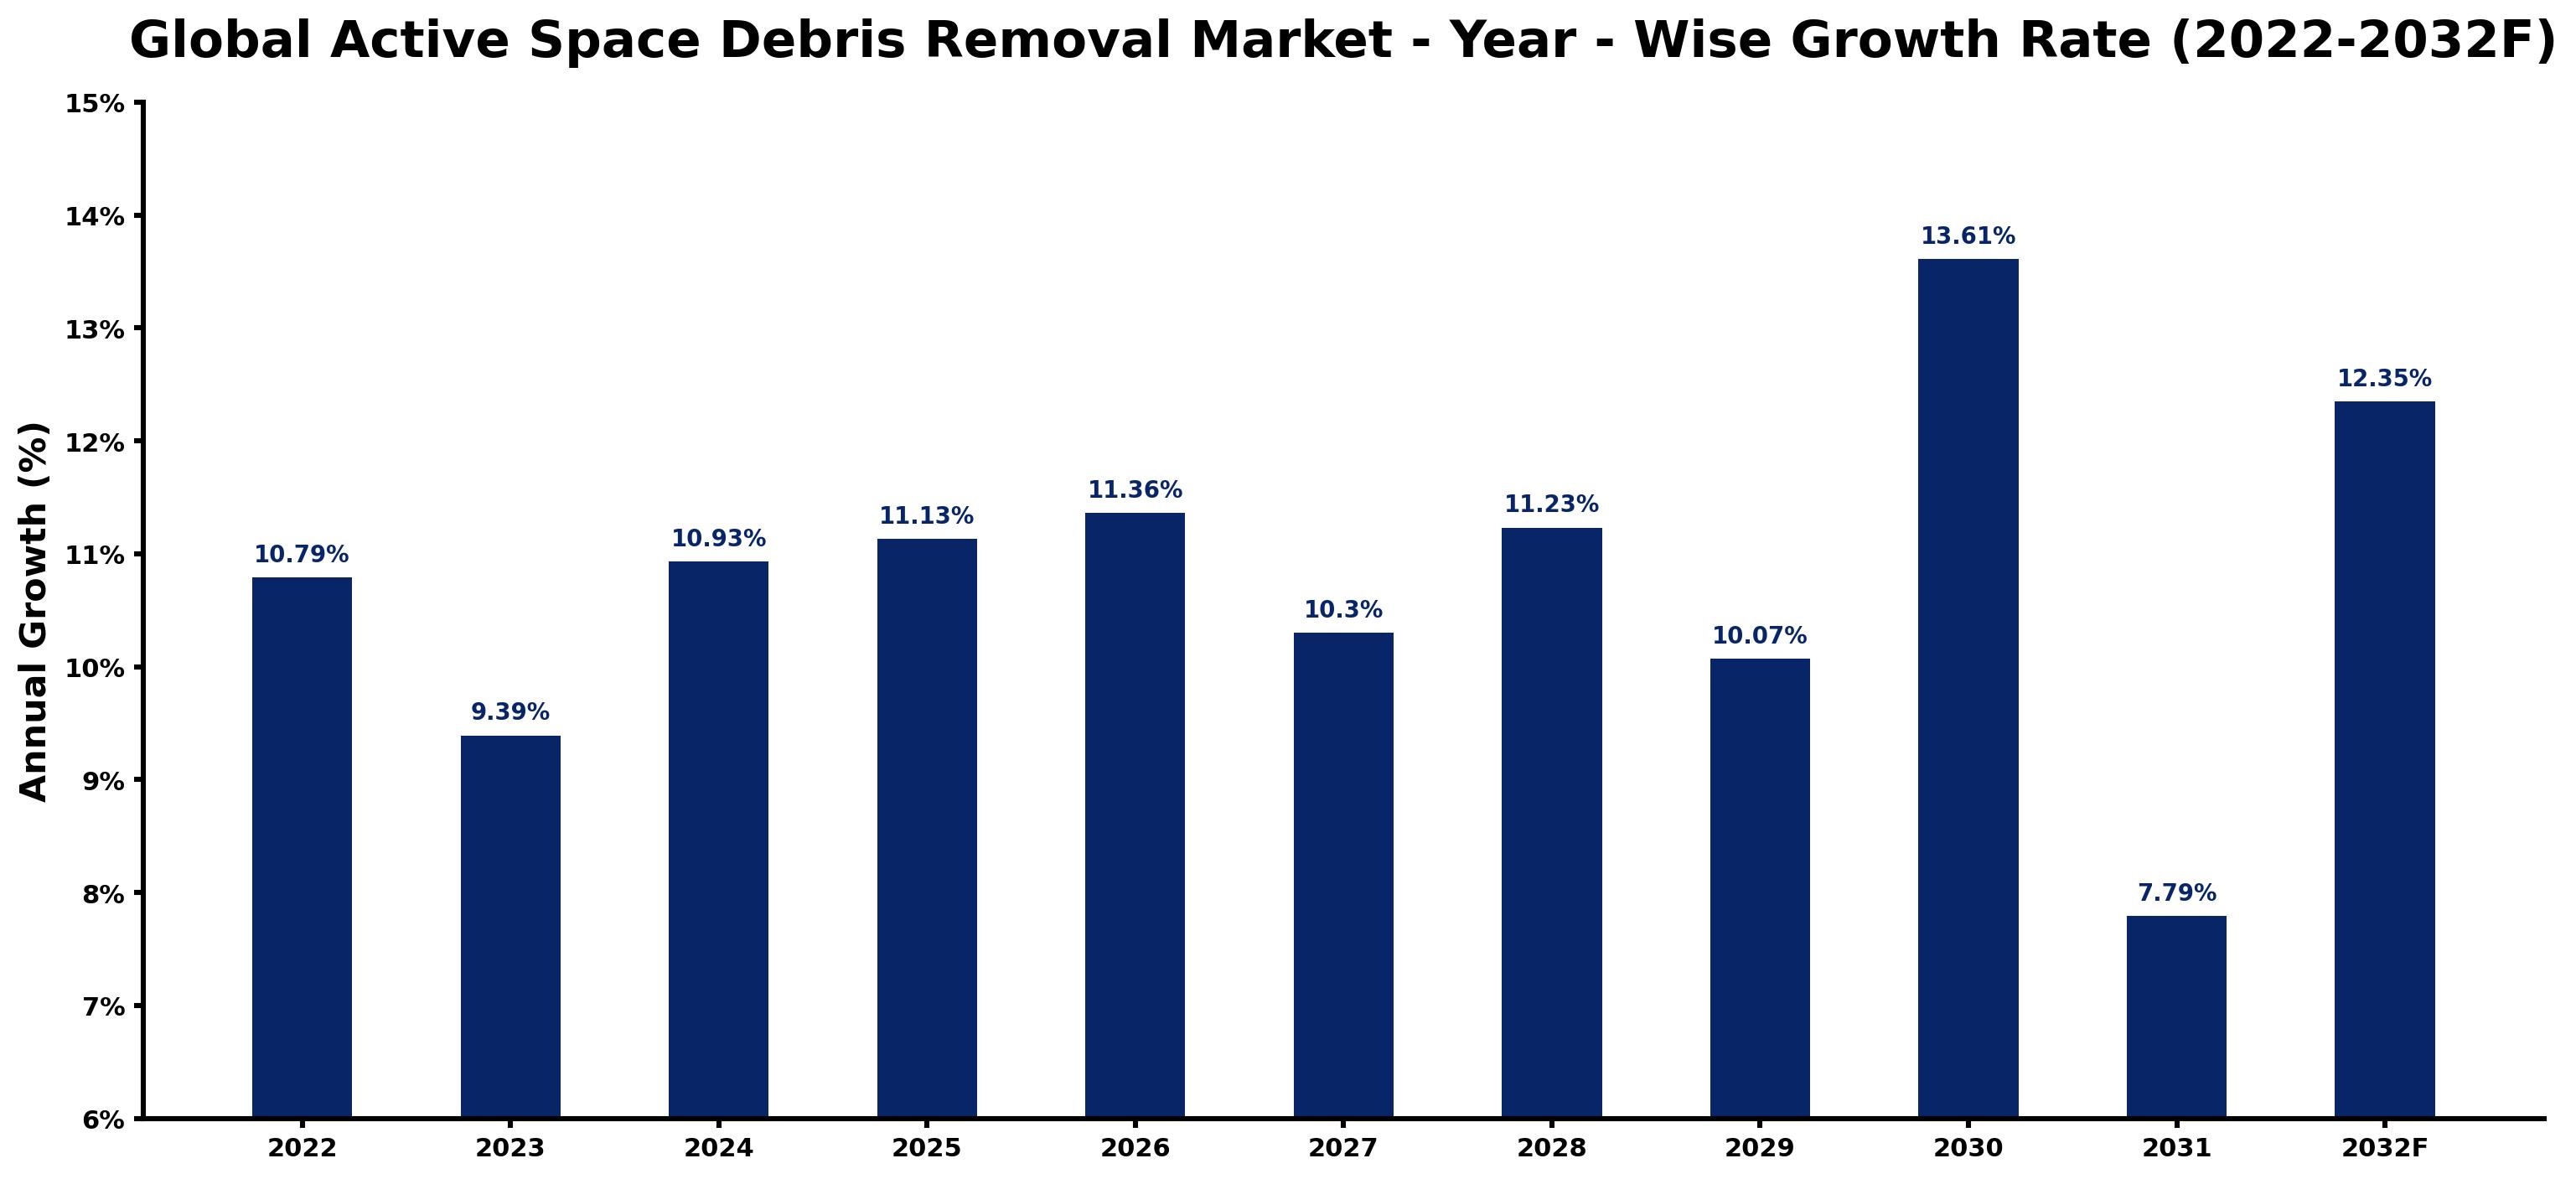
The table below presents the year‑wise growth rates along with the key drivers influencing the market
| Year | Growth Rate (%) | Major Drivers |
| 2022 | 10.79 | In North America, supply chain dynamics influence active space debris removal initiatives significantly. |
| 2023 | 9.39 | A growing emphasis on skilled labor enhances capabilities in space debris removal technologies. |
| 2024 | 10.93 | Satellite constellations drive customer demand for improved active space debris removal solutions. |
| 2025 | 11.13 | While sustainability initiatives increase, active space debris removal becomes essential for ecological responsibility. |
| 2026 | 11.36 | Advancements in propulsion systems enhance the efficiency of active space debris removal missions. |
| 2027 | 10.3 | Increased reliance on UAV systems accelerates demand for effective space debris removal strategies. |
| 2028 | 11.23 | Strengthening environmental consciousness among consumers drives interest in active space debris removal. |
| 2029 | 10.07 | A shift toward international collaborations changes the approach to active space debris removal efforts. |
| 2030 | 13.61 | Major aerospace firms are investing heavily in active space debris removal projects to capture market share. |
| 2031 | 7.79 | Regulators are increasingly scrutinizing active space debris removal practices amid market consolidation. |
| 2032 | 12.35 | Composite materials in satellites reduce costs, enhancing the viability of active space debris removal. |
Note - Market size estimations and growth projections presented in this report are based on 6Wresearch's proprietary research methodology, combining internal industry data, secondary research, and primary validation, updated periodically to reflect current market conditions. As markets evolve rapidly, figures for certain industries may vary slightly and are intended as informed estimates rather than absolute figures. For the most current market sizing, we recommend validating figures with a 6Wresearch analyst.
Global Active Space Debris Removal Market Key Takeaways
Below are some of the specific key takeaways from the market, including:
- North America is anticipated to command the largest share of approximately 48% in 2025, driven by significant investments in space defense initiatives.
- The segment for debris larger than 10 cm is expected to contribute the most to market revenue, reflecting a growing concern over larger threats in orbit.
- Germany is investing €290 million in ADR technologies as part of its national strategy to address space debris challenges, marking a significant development in policy.
- The European Space Agency plans to conduct a new debris removal demonstration mission by 2027, highlighting ongoing efforts in this sector.
- Companies like Astroscale are leading the way with their active debris removal mission planned for launch in 2026.
Evaluation of Restraints in Global Active Space Debris Removal Market
One of the primary restraints in the Global Active Space Debris Removal Market is the high cost associated with implementing effective debris removal technologies, which can exceed $500 million per mission. This significant financial barrier often deters smaller companies from entering the market. For example, proven systems like the European Space Agency's ClearSpace-1 mission, projected to cost around €120 million, underline the substantial investment required. Additionally, regulatory uncertainties and a lack of cohesive international policy on space debris create additional complexities for potential stakeholders, hindering the ability to deploy effective solutions at scale.
Global Active Space Debris Removal Market Trends
A notable trend in the Global Active Space Debris Removal Market is the increasing integration of AI technology into debris tracking and removal operations. This shift is exemplified by ClearSpace SA, which has developed AI algorithms to optimize debris capture paths. Another trend centers on enhanced governmental collaboration; for instance, the U.S. Department of Defense is actively promoting partnerships with private-sector companies for debris monitoring initiatives that can mitigate threats. Moreover, advancements in propulsion technology are making debunking more feasible, with propulsion systems like those being developed by Astroscale showing promise for effective debris navigation. These operational shifts signal a transformative period for the sector, as various stakeholders push towards establishing a sustainable orbital environment.
Global Active Space Debris Removal Market Opportunities
The Global Active Space Debris Removal Market presents several lucrative opportunities, particularly in emerging technologies. Notably, firms such as Northrop Grumman are exploring satellite servicing as a revenue stream, enabling concurrent debris removal missions while servicing operational satellites. The rise in satellite constellations, particularly for applications like broadband connectivity, generates serious demand for effective ADR solutions. For example, the Starlink project has launched thousands of satellites, increasing potential debris by several orders of magnitude, thus creating opportunities for targeted retrieval models. Additionally, the market for debris removal services for mega constellations is expected to reach several billion dollars by 2030, further highlighting revenue potential.
Global Active Space Debris Removal Market by Debris Size
In the Global Active Space Debris Removal Market, debris larger than 10 cm commands the largest segment share, estimated at approximately 40% in 2025, due to the heightened risk it poses to operational spacecraft and satellites. Conversely, the fastest-growing segment is projected to be debris between 1 cm to 10 cm, which is expected to achieve a CAGR of 12.5% from 2026 to 2032, driven by increasing concerns regarding mid-sized debris impacting satellite constellations. The manufacturing complexities, alongside the need for specialized retrieval techniques, contribute to this segment's accelerated growth in response to industry demands for innovative solutions.
Global Active Space Debris Removal Market by End-users
In the context of end-users in the Global Active Space Debris Removal Market, the defense segment holds the largest share, commanding approximately 55% in 2025 as governments ramp up efforts to safeguard sensitive space assets. However, the commercial segment emerges as the fastest-growing area, projected to see a CAGR of 15% from 2026 to 2032, largely due to increasing investments from private satellite operators keen on protecting their orbiting assets and operations. The heightened emphasis on maintaining the security of communication satellites fuels the demand in this sector.
Global Active Space Debris Removal Market by Region
Regionally, North America is expected to dominate the Global Active Space Debris Removal Market with a share of approximately 48% in 2025, bolstered by its established defense spending and technological capabilities in space exploration. Europe stands out as the fastest-growing region, projected to achieve a CAGR of 14% from 2026 to 2032, propelled by robust government initiatives and regulations addressing space debris. The strategic location of established space agencies, alongside collaborative projects like the European Space Agency’s initiatives, underpins the region’s increasing significance in the global market.
Government Initiatives in the Global Active Space Debris Removal Market
The regulatory landscape for the Global Active Space Debris Removal Market is evolving significantly as governments recognize the need to address the growing problem of space debris. Various initiatives are being launched that not only promote technological innovation but also encourage collaboration between governmental agencies and private industry.
- European Space Agency (ESA) - Space Debris Mitigation Guidelines, 2021 - This initiative outlines practices to minimize space debris generation, directly influencing the operational standards for European space missions.
- U.S. National Aeronautics and Space Administration (NASA) - Orbital Debris Research Program, Annually funded - By continuously funding research efforts, NASA aims to enhance debris tracking technologies and support remediation projects.
- UK Space Agency - National Orbital Debris Removal Strategy, Announced 2022 - This strategy, intended to be fully operational by 2025, embodies the UK’s commitment to removing large objects from space.
- Japanese Aerospace Exploration Agency (JAXA) - Active Debris Removal Mission, 2025 - JAXA will lead a mission to capture and remove a significant piece of debris using a robotic system, showcasing advancements in ADR technology.
Future Insights of the Global Active Space Debris Removal Market
The Global Active Space Debris Removal Market is anticipated to undergo significant evolution, shaped by technological advancements and increasing regulatory scrutiny. As organizations like the European Space Agency enhance investment in debris removal missions, expected collaborations among private firms and governmental bodies will likely become more effective. For instance, with Germany’s €290 million allocation to ADR technologies, the emerging landscape of partnerships is projected to streamline operations and promote innovative debris mitigation strategies through 2032.
Global Active Space Debris Removal Market Latest Developments
Recent strategic initiatives by key players are redefining operational capabilities in the Global Active Space Debris Removal Market. The following highlights illustrate the latest advancements:
- Astroscale is actively pursuing its mission to launch an active debris removal satellite, with a scheduled deployment in 2026, positioning itself at the forefront of the market.
- ClearSpace SA recently partnered with private sector firms to enhance its capture technology, a collaboration expected to culminate in a prototype by mid-2025.
- The European Space Agency has announced an upcoming debris removal demonstration mission set for 2027, showcasing ongoing advancements in practical applications for ADR.
- In 2023, Northrop Grumman secured government contracts for experimental debris tracking systems, enhancing its technological edge in the market.
Global Active Space Debris Removal Market Key Players and Industry Positioning
The competitive landscape of the Global Active Space Debris Removal Market is characterized by a mix of established companies and emerging players. While major corporations dominate with resources and expertise, smaller firms are increasingly entering with niche technologies, fostering a fragmented yet dynamic environment.
| Leading Company | Core Strength | Strategic Focus |
|---|---|---|
| ClearSpace SA | Advanced debris capture technology | Prototype development and partnerships |
| Astroscale Holdings | Innovative mission planning | Launching active debris removal missions |
| Northrop Grumman | Robust defense contracting experience | Developing tracking and monitoring systems |
| Mission Innovation | Unique technological insights | Promoting sustainable space practices |
| European Space Agency | Strong governmental support | Leading critical debris removal missions |
Such strategic differentiation among players indicates the market's potential for collaborative innovations and intensified competition, laying the foundation for pioneering solutions in debris remediation.
Key Attractiveness of the Report
- 10 Years of Market Numbers
- Historical Data Starting from 2022 to 2025
- Base Year: 2025
- Forecast Data until 2032
- Key Performance Indicators Impacting the Market
- Major Upcoming Developments and Projects
Key Highlights of the Report:
- Active Space Debris Removal Market Overview
- Active Space Debris Removal Market Outlook
- Active Space Debris Removal Market Forecast
- Historical Data of Active Space Debris Removal Market Revenues & Volume for the Period 2022-2032
- Active Space Debris Removal Market Size and Active Space Debris Removal Market Forecast of Revenues & Volume, Until 2032
- Historical Data of Active Space Debris Removal Market Revenues & Volume, by Product, for the Period 2022-2032
- Market Size & Forecast of Active Space Debris Removal Market Revenues & Volume, by Product, Until 2032
- Historical Data of Active Space Debris Removal Market Revenues, by Regions, for the Period 2022-2032
- Market Size & Forecast of Active Space Debris Removal Market Revenues, by Regions, Until 2032
- Historical Data of Asia Pacific Active Space Debris Removal Market Revenues, for the Period 2022-2032
- Market Size & Forecast of Asia Pacific Active Space Debris Removal Market Revenues, Until 2032
- Historical Data of Latin America Active Space Debris Removal Market Revenues, for the Period 2022-2032
- Market Size & Forecast of Latin America Active Space Debris Removal Market Revenues, Until 2032
- Historical Data of Europe Active Space Debris Removal Market Revenues, for the Period 2022-2032
- Market Size & Forecast of Europe Active Space Debris Removal Market Revenues, Until 2032
- Historical Data of Middle East Active Space Debris Removal Market Revenues, for the Period 2022-2032
- Market Size & Forecast of Middle East Active Space Debris Removal Market Revenues, Until 2032
- Historical Data of North America Active Space Debris Removal Market Revenues, for the Period 2022-2032
- Market Size & Forecast of North America Active Space Debris Removal Market Revenues, Until 2032
- Historical Data of Africa Active Space Debris Removal Market Revenues, for the Period 2022-2032
- Market Size & Forecast of Africa Active Space Debris Removal Market Revenues, Until 2032
- Market Drivers and Restraints
- Active Space Debris Removal Market Trends and Industry Life Cycle
- Porter’s Five Force Analysis
- Market Opportunity Assessment
- Active Space Debris Removal Market Share, By Players
- Active Space Debris Removal Market Share, By Regions
- Active Space Debris Removal Market Overview on Competitive Benchmarking
- Company Profiles
- Key Strategic Recommendations
Markets Covered
The Global Active Space Debris Removal Market report provides a detailed analysis of the following market segments:
By Regions and Countries:
- North America
- Europe
- LATAM
- Middle East
- Asia
- Africa
By Debris Size:
- Between 1 mm
- 1 cm
- Between 1 cm to 10 cm
- More than 10 cm
By End-users:
- Commercial
- Defense






































