Greece Aluminum Caps and Closures Market (2026-2032) | Value, Segmentation, Competitive Landscape, Analysis, Forecast, Trends, Size & Revenue, Share, Growth, Companies, Industry, Outlook
Market Forecast By Type (Screw Caps, Crown Cork, Lugs (Press Twist), East Open End, Other), By Product Type (Roll-On Pilfer-Proof (ROPP) Caps, Easy-Open Can Ends, Non-Refillable Closures, Others), By Application (Oral Solid, Oral Liquid, Parenteral, Lotion, Ophthalmic Drugs, Others), By End-Use Sector (Beverage, Food, Pharmaceutical, Home and Personal Care, Others) And Competitive Landscape
| Product Code: ETC7341952 | Publication Date: Sep 2024 | Updated Date: Apr 2026 | Product Type: Market Research Report | |
| Publisher: 6Wresearch | Author: Sumit Sagar | No. of Pages: 75 | No. of Figures: 35 | No. of Tables: 20 |
Greece Aluminum Caps And Closures Market Size (2020-2030)
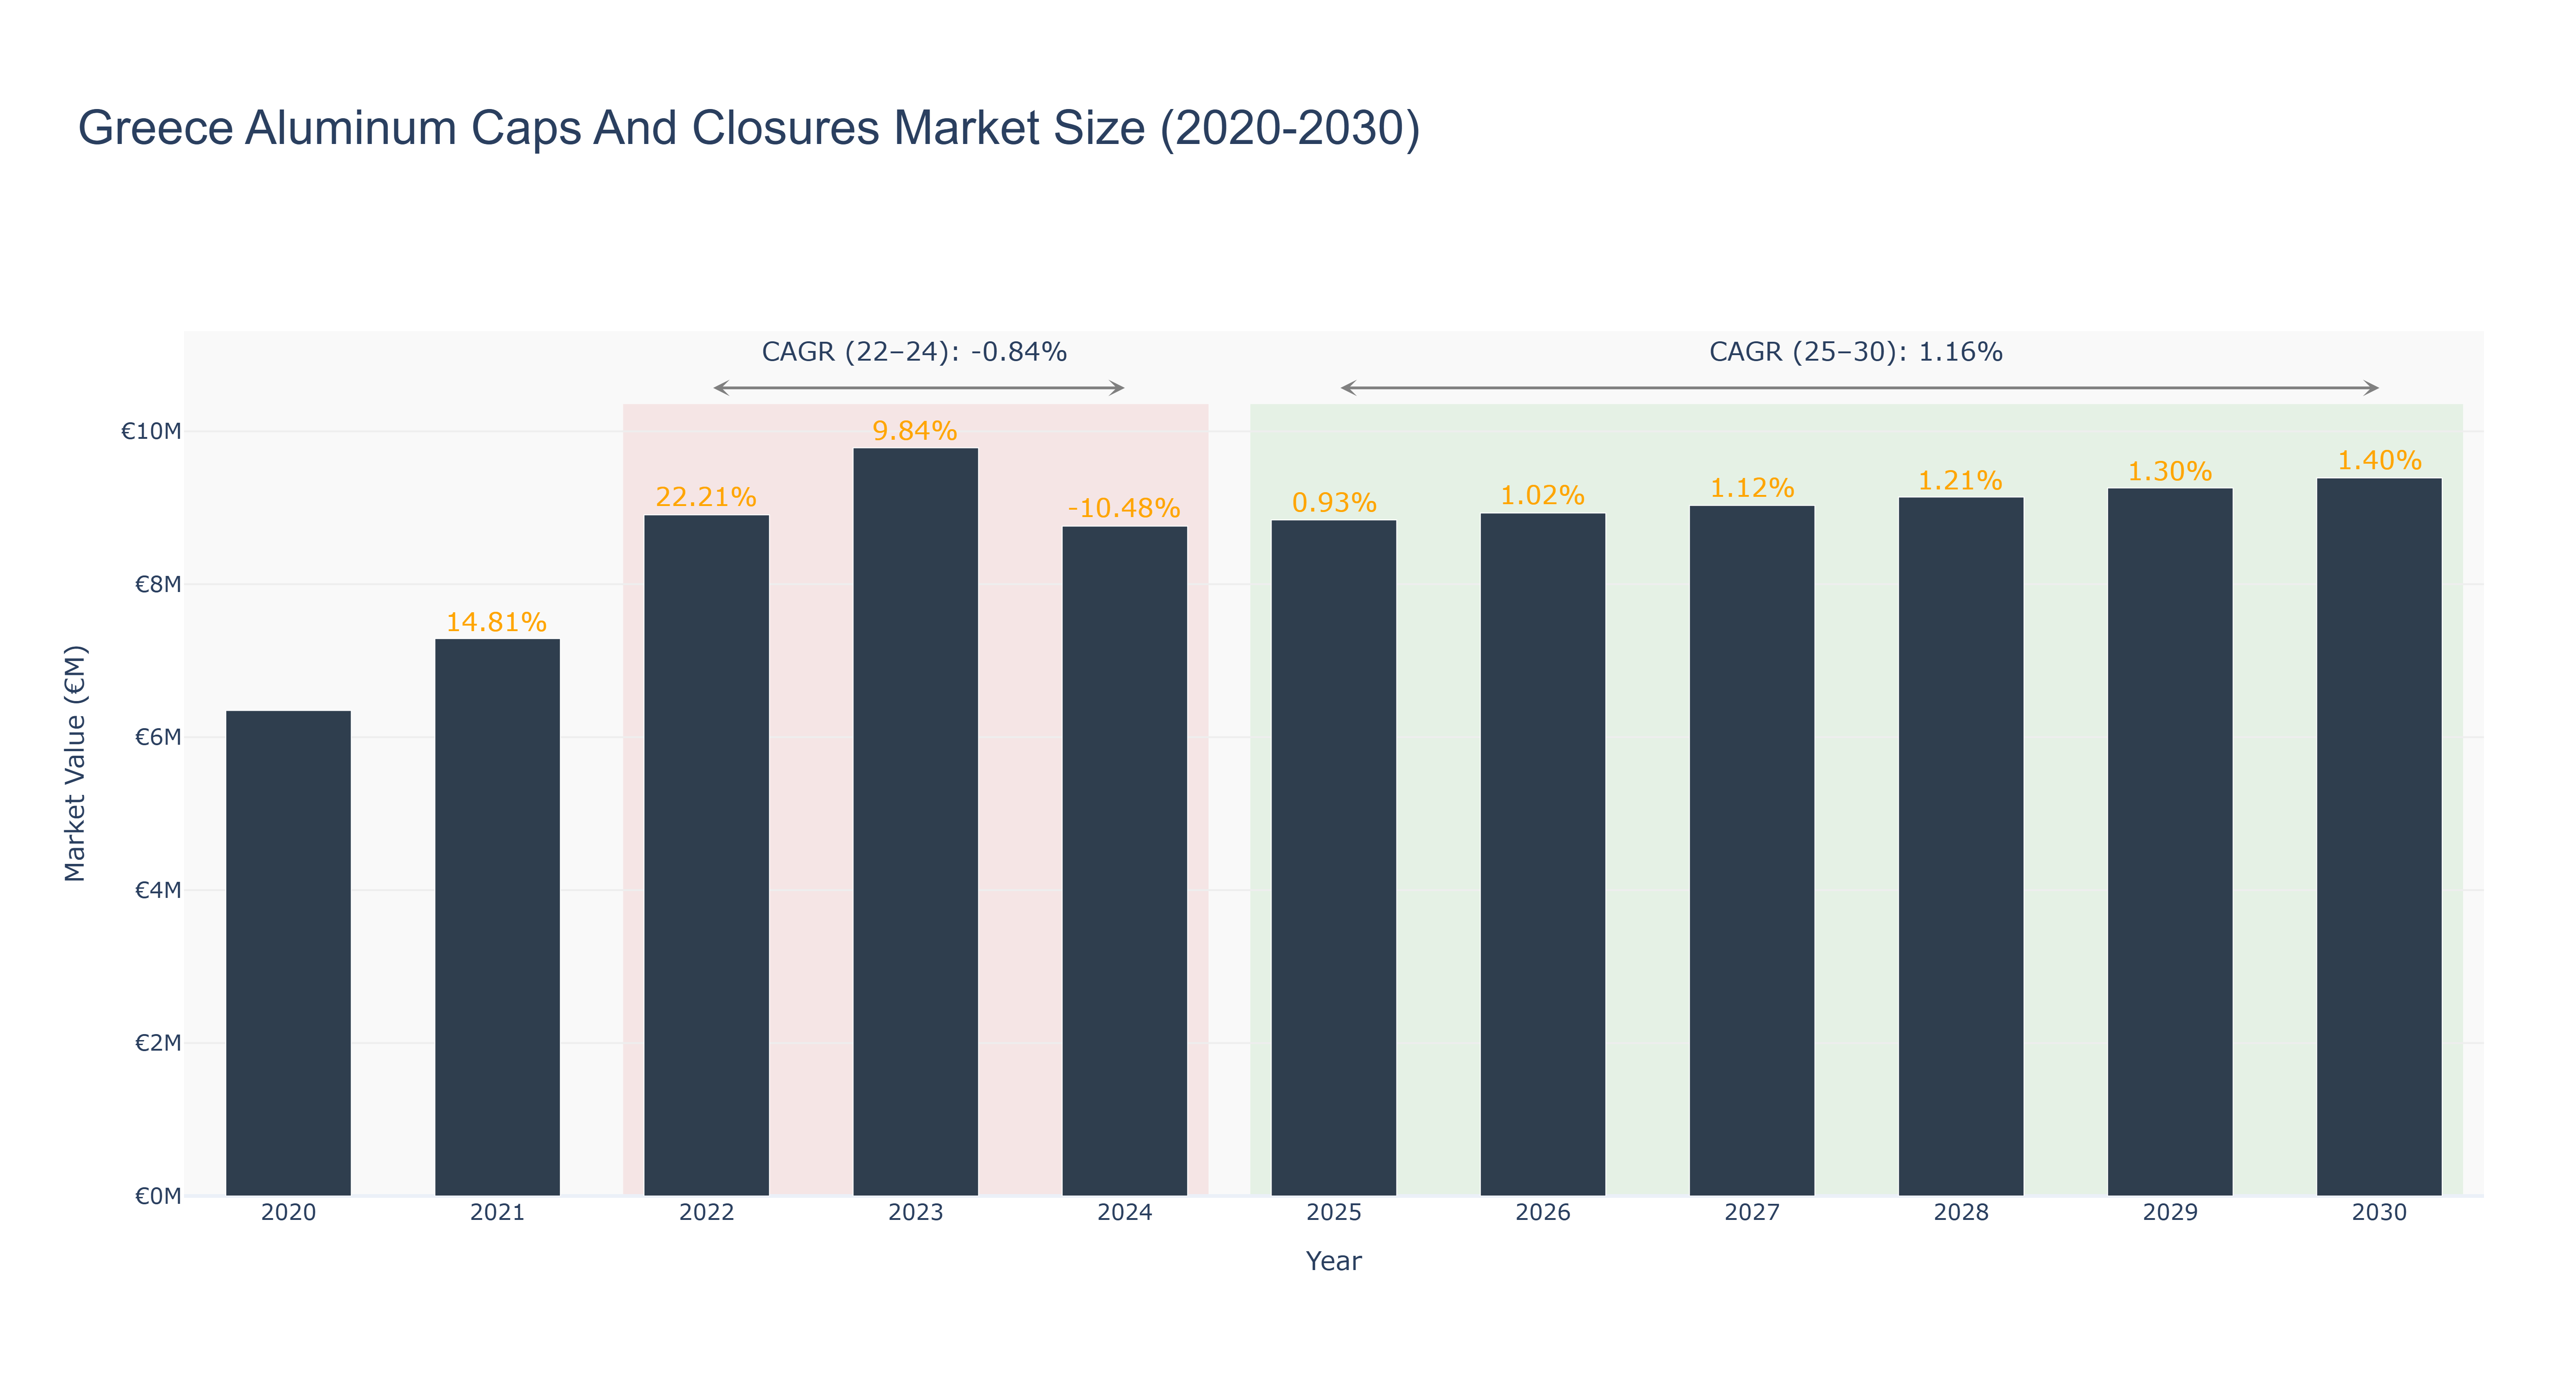
The Greece Aluminum Caps and Closures Market experienced robust growth from 2021 to 2022, with market sizes reaching €7.29 million and peaking at €8.91 million, reflecting a notable growth rate of 22.21%. However, this upward trend was interrupted in 2024, when the market size declined to €8.76 million, resulting in a negative CAGR of -0.84% from 2022 to 2024. The forecasted period from 2025 to 2030 anticipates a modest recovery, with projected market sizes gradually increasing from €8.84 million in 2025 to €9.39 million by 2030, yielding a CAGR of 1.16%. This growth is likely driven by rising consumer demand for sustainable packaging solutions and innovations in manufacturing processes. While market dynamics remain challenged by economic fluctuations and competition from alternative materials, the ongoing shift towards environmentally friendly products is expected to foster gradual growth in the coming years.
Greece Aluminum Caps And Closures Market: Production & Trade Performance (2019-2025)
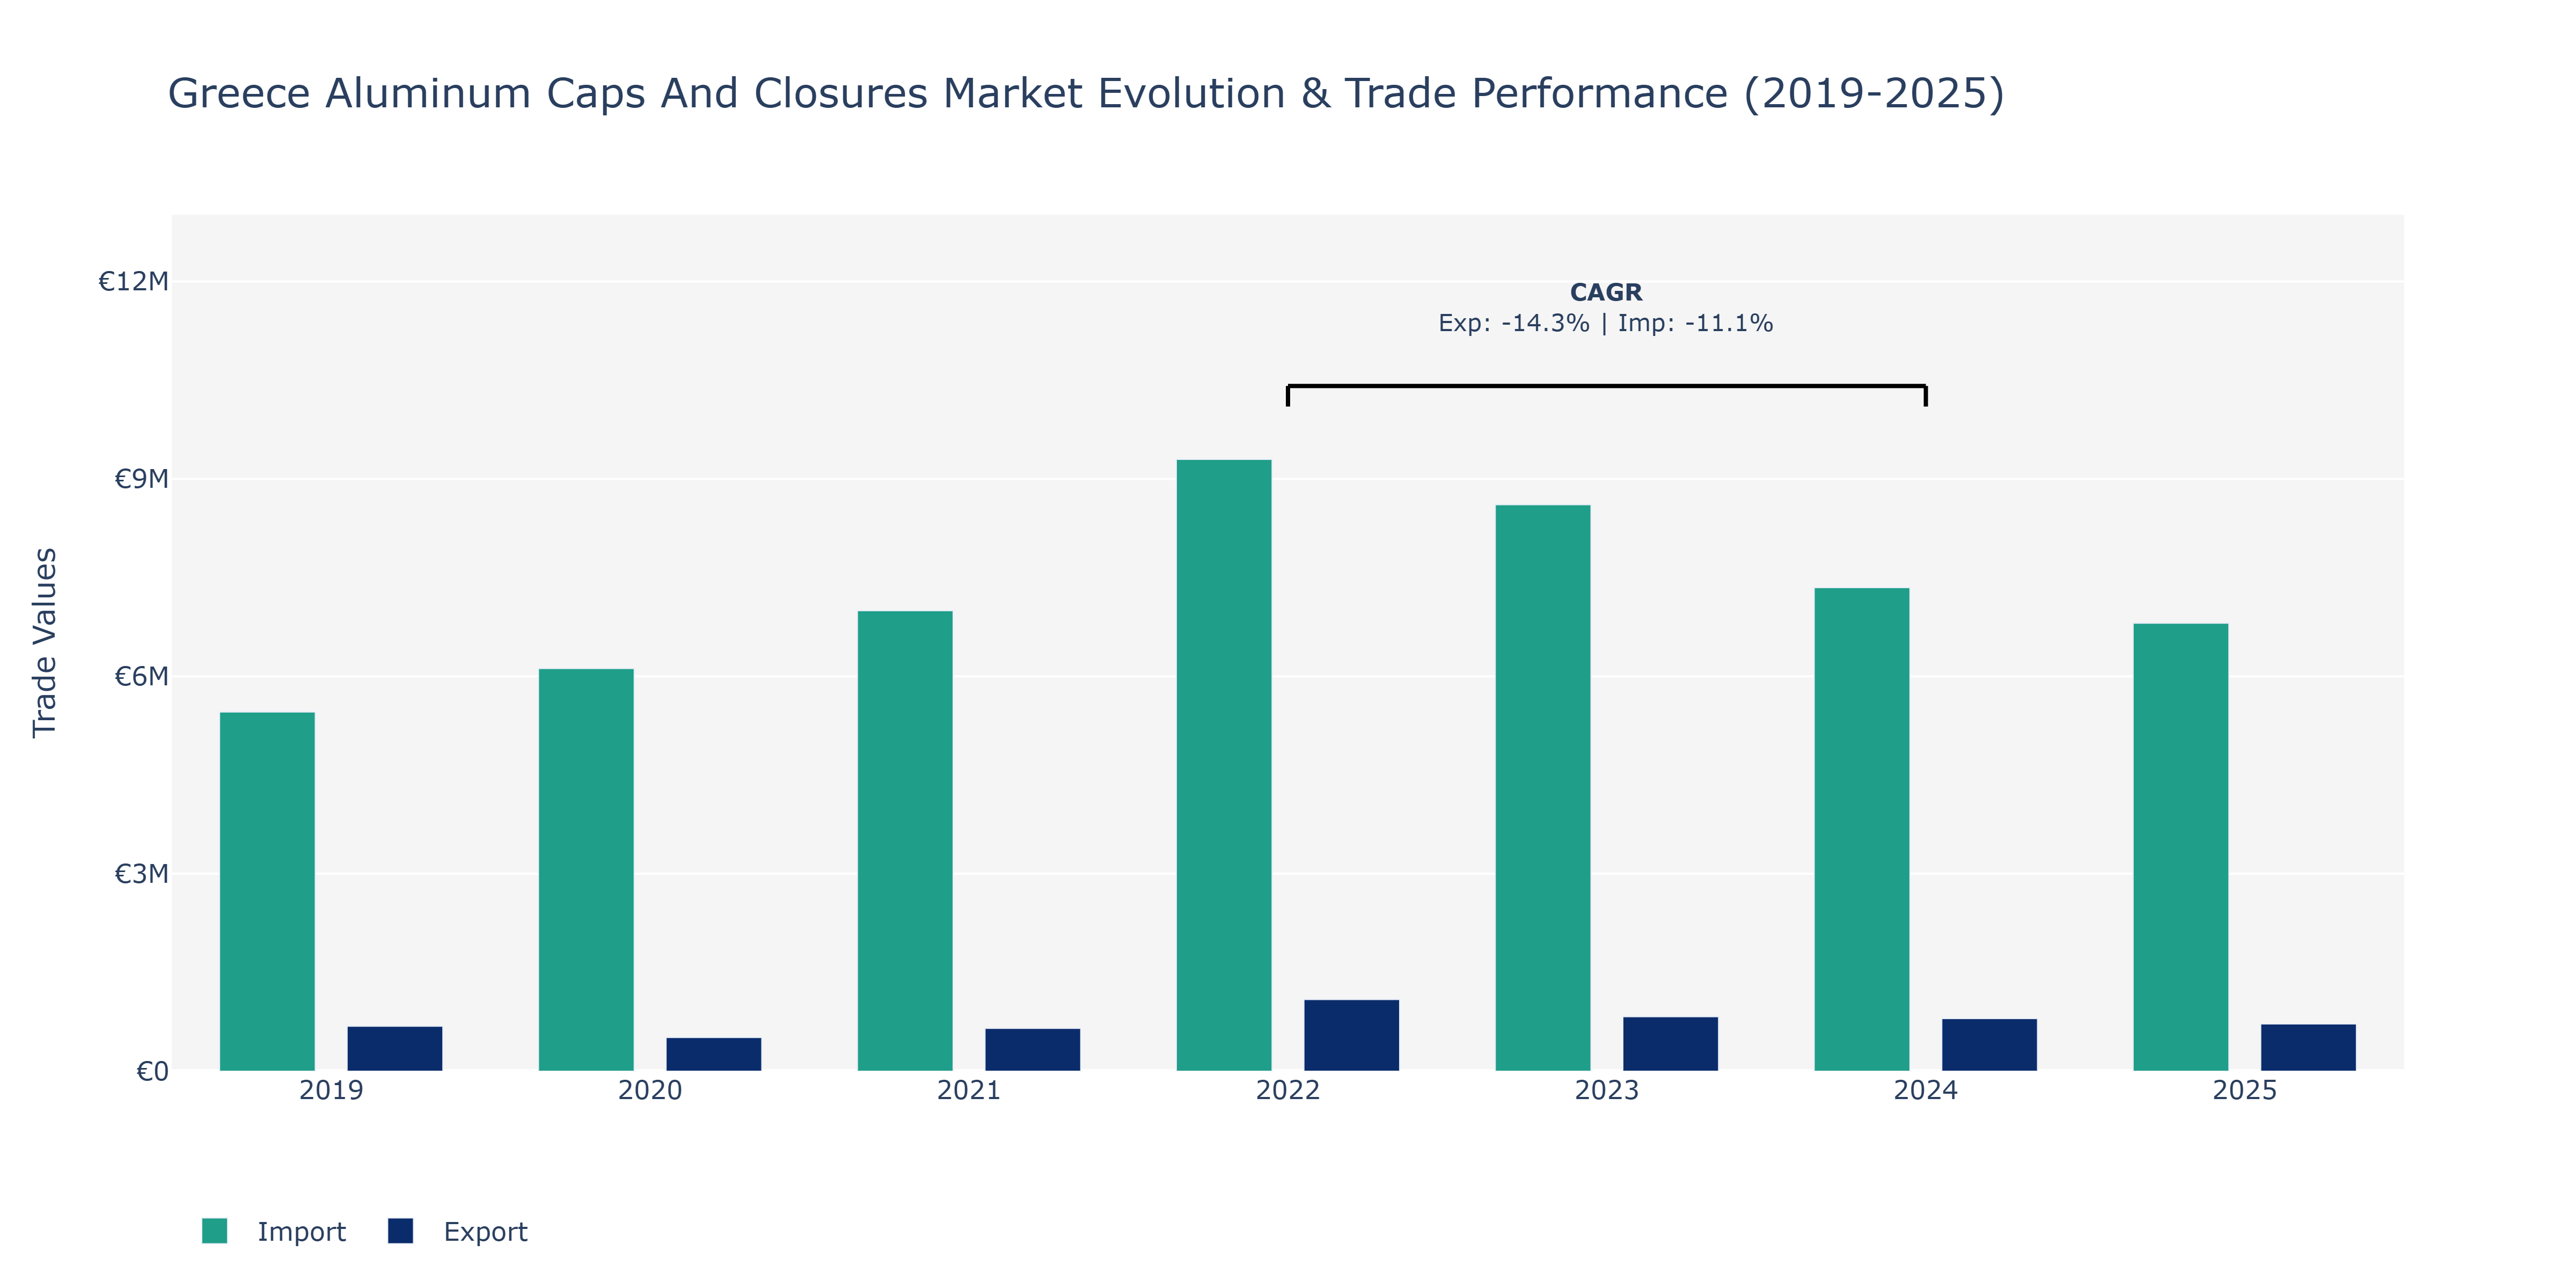
The Greece Aluminum Caps And Closures Market witnessed fluctuations in both exports and imports from 2019 to 2025. In 2019, exports stood at €682.7 thousand and imports at €5.46 million. However, by 2020, exports decreased to €511.06 thousand while imports increased to €6.12 million. This reversal continued into 2021 with exports rising to €650.38 thousand and imports reaching €7.0 million. The peak points were observed in 2022 with exports at €1.09 million and imports at €9.3 million. Subsequently, both exports and imports experienced a decline by 2024, with exports at €798.3 thousand and imports at €7.35 million. In 2025, there was a further decrease in exports to €718.43 thousand and imports to €6.81 million. These fluctuations can be attributed to factors such as global demand shifts, economic conditions impacting trade volumes, and regulatory changes affecting market dynamics in the aluminum caps and closures sector. The decline in CAGR for both exports and imports from 2022 to 2024 can be linked to evolving market preferences, competitive pressures, and geopolitical influences impacting trade relationships within the industry.
Key Highlights of the Report:
- Greece Aluminum Caps and Closures Market Outlook
- Market Size of Greece Aluminum Caps and Closures Market, 2025
- Forecast of Greece Aluminum Caps and Closures Market, 2032
- Historical Data and Forecast of Greece Aluminum Caps and Closures Revenues & Volume for the Period 2022-2032F
- Greece Aluminum Caps and Closures Market Trend Evolution
- Greece Aluminum Caps and Closures Market Drivers and Challenges
- Greece Aluminum Caps and Closures Price Trends
- Greece Aluminum Caps and Closures Porter's Five Forces
- Greece Aluminum Caps and Closures Industry Life Cycle
- Historical Data and Forecast of Greece Aluminum Caps and Closures Market Revenues & Volume By Type for the Period 2022-2032F
- Historical Data and Forecast of Greece Aluminum Caps and Closures Market Revenues & Volume By Screw Caps for the Period 2022-2032F
- Historical Data and Forecast of Greece Aluminum Caps and Closures Market Revenues & Volume By Crown Cork for the Period 2022-2032F
- Historical Data and Forecast of Greece Aluminum Caps and Closures Market Revenues & Volume By Lugs (Press Twist) for the Period 2022-2032F
- Historical Data and Forecast of Greece Aluminum Caps and Closures Market Revenues & Volume By East Open End for the Period 2022-2032F
- Historical Data and Forecast of Greece Aluminum Caps and Closures Market Revenues & Volume By Other for the Period 2022-2032F
- Historical Data and Forecast of Greece Aluminum Caps and Closures Market Revenues & Volume By Product Type for the Period 2022-2032F
- Historical Data and Forecast of Greece Aluminum Caps and Closures Market Revenues & Volume By Roll-On Pilfer-Proof (ROPP) Caps for the Period 2022-2032F
- Historical Data and Forecast of Greece Aluminum Caps and Closures Market Revenues & Volume By Easy-Open Can Ends for the Period 2022-2032F
- Historical Data and Forecast of Greece Aluminum Caps and Closures Market Revenues & Volume By Non-Refillable Closures for the Period 2022-2032F
- Historical Data and Forecast of Greece Aluminum Caps and Closures Market Revenues & Volume By Others for the Period 2022-2032F
- Historical Data and Forecast of Greece Aluminum Caps and Closures Market Revenues & Volume By Application for the Period 2022-2032F
- Historical Data and Forecast of Greece Aluminum Caps and Closures Market Revenues & Volume By Oral Solid for the Period 2022-2032F
- Historical Data and Forecast of Greece Aluminum Caps and Closures Market Revenues & Volume By Oral Liquid for the Period 2022-2032F
- Historical Data and Forecast of Greece Aluminum Caps and Closures Market Revenues & Volume By Parenteral for the Period 2022-2032F
- Historical Data and Forecast of Greece Aluminum Caps and Closures Market Revenues & Volume By Lotion for the Period 2022-2032F
- Historical Data and Forecast of Greece Aluminum Caps and Closures Market Revenues & Volume By Ophthalmic Drugs for the Period 2022-2032F
- Historical Data and Forecast of Greece Aluminum Caps and Closures Market Revenues & Volume By Others for the Period 2022-2032F
- Historical Data and Forecast of Greece Aluminum Caps and Closures Market Revenues & Volume By End-Use Sector for the Period 2022-2032F
- Historical Data and Forecast of Greece Aluminum Caps and Closures Market Revenues & Volume By Beverage for the Period 2022-2032F
- Historical Data and Forecast of Greece Aluminum Caps and Closures Market Revenues & Volume By Food for the Period 2022-2032F
- Historical Data and Forecast of Greece Aluminum Caps and Closures Market Revenues & Volume By Pharmaceutical for the Period 2022-2032F
- Historical Data and Forecast of Greece Aluminum Caps and Closures Market Revenues & Volume By Home and Personal Care for the Period 2022-2032F
- Historical Data and Forecast of Greece Aluminum Caps and Closures Market Revenues & Volume By Others for the Period 2022-2032F
- Greece Aluminum Caps and Closures Import Export Trade Statistics
- Market Opportunity Assessment By Type
- Market Opportunity Assessment By Product Type
- Market Opportunity Assessment By Application
- Market Opportunity Assessment By End-Use Sector
- Greece Aluminum Caps and Closures Top Companies Market Share
- Greece Aluminum Caps and Closures Competitive Benchmarking By Technical and Operational Parameters
- Greece Aluminum Caps and Closures Company Profiles
- Greece Aluminum Caps and Closures Key Strategic Recommendations
Frequently Asked Questions About the Market Study (FAQs):
6Wresearch actively monitors the Greece Aluminum Caps and Closures Market and publishes its comprehensive annual report, highlighting emerging trends, growth drivers, revenue analysis, and forecast outlook. Our insights help businesses to make data-backed strategic decisions with ongoing market dynamics. Our analysts track relevent industries related to the Greece Aluminum Caps and Closures Market, allowing our clients with actionable intelligence and reliable forecasts tailored to emerging regional needs.
Yes, we provide customisation as per your requirements. To learn more, feel free to contact us on sales@6wresearch.com
1 Executive Summary |
2 Introduction |
2.1 Key Highlights of the Report |
2.2 Report Description |
2.3 Market Scope & Segmentation |
2.4 Research Methodology |
2.5 Assumptions |
3 Greece Aluminum Caps and Closures Market Overview |
3.1 Greece Country Macro Economic Indicators |
3.2 Greece Aluminum Caps and Closures Market Revenues & Volume, 2022 & 2032F |
3.3 Greece Aluminum Caps and Closures Market - Industry Life Cycle |
3.4 Greece Aluminum Caps and Closures Market - Porter's Five Forces |
3.5 Greece Aluminum Caps and Closures Market Revenues & Volume Share, By Type, 2022 & 2032F |
3.6 Greece Aluminum Caps and Closures Market Revenues & Volume Share, By Product Type, 2022 & 2032F |
3.7 Greece Aluminum Caps and Closures Market Revenues & Volume Share, By Application, 2022 & 2032F |
3.8 Greece Aluminum Caps and Closures Market Revenues & Volume Share, By End-Use Sector, 2022 & 2032F |
4 Greece Aluminum Caps and Closures Market Dynamics |
4.1 Impact Analysis |
4.2 Market Drivers |
4.2.1 Increasing demand for aluminum caps and closures due to growth in the food and beverage industry in Greece. |
4.2.2 Shift towards sustainable packaging solutions driving the adoption of aluminum caps and closures. |
4.2.3 Technological advancements in manufacturing processes leading to improved efficiency and quality of aluminum caps and closures. |
4.3 Market Restraints |
4.3.1 Fluctuating raw material prices impacting the production cost of aluminum caps and closures. |
4.3.2 Stringent regulations related to recycling and sustainability posing challenges for the aluminum caps and closures market in Greece. |
5 Greece Aluminum Caps and Closures Market Trends |
6 Greece Aluminum Caps and Closures Market, By Types |
6.1 Greece Aluminum Caps and Closures Market, By Type |
6.1.1 Overview and Analysis |
6.1.2 Greece Aluminum Caps and Closures Market Revenues & Volume, By Type, 2022-2032F |
6.1.3 Greece Aluminum Caps and Closures Market Revenues & Volume, By Screw Caps, 2022-2032F |
6.1.4 Greece Aluminum Caps and Closures Market Revenues & Volume, By Crown Cork, 2022-2032F |
6.1.5 Greece Aluminum Caps and Closures Market Revenues & Volume, By Lugs (Press Twist), 2022-2032F |
6.1.6 Greece Aluminum Caps and Closures Market Revenues & Volume, By East Open End, 2022-2032F |
6.1.7 Greece Aluminum Caps and Closures Market Revenues & Volume, By Other, 2022-2032F |
6.2 Greece Aluminum Caps and Closures Market, By Product Type |
6.2.1 Overview and Analysis |
6.2.2 Greece Aluminum Caps and Closures Market Revenues & Volume, By Roll-On Pilfer-Proof (ROPP) Caps, 2022-2032F |
6.2.3 Greece Aluminum Caps and Closures Market Revenues & Volume, By Easy-Open Can Ends, 2022-2032F |
6.2.4 Greece Aluminum Caps and Closures Market Revenues & Volume, By Non-Refillable Closures, 2022-2032F |
6.2.5 Greece Aluminum Caps and Closures Market Revenues & Volume, By Others, 2022-2032F |
6.3 Greece Aluminum Caps and Closures Market, By Application |
6.3.1 Overview and Analysis |
6.3.2 Greece Aluminum Caps and Closures Market Revenues & Volume, By Oral Solid, 2022-2032F |
6.3.3 Greece Aluminum Caps and Closures Market Revenues & Volume, By Oral Liquid, 2022-2032F |
6.3.4 Greece Aluminum Caps and Closures Market Revenues & Volume, By Parenteral, 2022-2032F |
6.3.5 Greece Aluminum Caps and Closures Market Revenues & Volume, By Lotion, 2022-2032F |
6.3.6 Greece Aluminum Caps and Closures Market Revenues & Volume, By Ophthalmic Drugs, 2022-2032F |
6.3.7 Greece Aluminum Caps and Closures Market Revenues & Volume, By Others, 2022-2032F |
6.4 Greece Aluminum Caps and Closures Market, By End-Use Sector |
6.4.1 Overview and Analysis |
6.4.2 Greece Aluminum Caps and Closures Market Revenues & Volume, By Beverage, 2022-2032F |
6.4.3 Greece Aluminum Caps and Closures Market Revenues & Volume, By Food, 2022-2032F |
6.4.4 Greece Aluminum Caps and Closures Market Revenues & Volume, By Pharmaceutical, 2022-2032F |
6.4.5 Greece Aluminum Caps and Closures Market Revenues & Volume, By Home and Personal Care, 2022-2032F |
6.4.6 Greece Aluminum Caps and Closures Market Revenues & Volume, By Others, 2022-2032F |
7 Greece Aluminum Caps and Closures Market Import-Export Trade Statistics |
7.1 Greece Aluminum Caps and Closures Market Export to Major Countries |
7.2 Greece Aluminum Caps and Closures Market Imports from Major Countries |
8 Greece Aluminum Caps and Closures Market Key Performance Indicators |
8.1 Percentage of recycled content used in the production of aluminum caps and closures. |
8.2 Adoption rate of innovative packaging designs using aluminum caps and closures. |
8.3 Average lead time for manufacturing and delivering aluminum caps and closures to customers. |
9 Greece Aluminum Caps and Closures Market - Opportunity Assessment |
9.1 Greece Aluminum Caps and Closures Market Opportunity Assessment, By Type, 2022 & 2032F |
9.2 Greece Aluminum Caps and Closures Market Opportunity Assessment, By Product Type, 2022 & 2032F |
9.3 Greece Aluminum Caps and Closures Market Opportunity Assessment, By Application, 2022 & 2032F |
9.4 Greece Aluminum Caps and Closures Market Opportunity Assessment, By End-Use Sector, 2022 & 2032F |
10 Greece Aluminum Caps and Closures Market - Competitive Landscape |
10.1 Greece Aluminum Caps and Closures Market Revenue Share, By Companies, 2025 |
10.2 Greece Aluminum Caps and Closures Market Competitive Benchmarking, By Operating and Technical Parameters |
11 Company Profiles |
12 Recommendations |
13 Disclaimer |
Global Go To Market Strategy - 2030
Export potential enables firms to identify high-growth global markets with greater confidence by combining advanced trade intelligence with a structured quantitative methodology. The framework analyzes emerging demand trends and country-level import patterns while integrating macroeconomic and trade datasets such as GDP and population forecasts, bilateral import–export flows, tariff structures, elasticity differentials between developed and developing economies, geographic distance, and import demand projections. Using weighted trade values from 2020–2024 as the base period to project country-to-country export potential for 2030, these inputs are operationalized through calculated drivers such as gravity model parameters, tariff impact factors, and projected GDP per-capita growth. Through an analysis of hidden potentials, demand hotspots, and market conditions that are most favorable to success, this method enables firms to focus on target countries, maximize returns, and global expansion with data, backed by accuracy.
By factoring in the projected importer demand gap that is currently unmet and could be potential opportunity, it identifies the potential for the Exporter (Country) among 190 countries, against the general trade analysis, which identifies the biggest importer or exporter.
To discover high-growth global markets and optimize your business strategy:
Click Here
Pricing
- Single User License$ 1,995
- Department License$ 2,400
- Site License$ 3,120
- Global License$ 3,795

Leadership Perspectives from Industry Events
Search
Thought Leadership and Analyst Meet


Our Clients
6WResearch In News
- India Export Attractiveness Tracker 2026
- India Air Conditioner Market Set for Strong Rebound in 2026 After Weather-Led Correction and GST-Driven Recovery: 6Wresearch
- ADAS in India: How Automatic Emergency Braking, Blind Spot Detection & Driver Monitoring are Transforming Road Safety
- Doha a strategic location for EV manufacturing hub: IPA Qatar
- Demand for luxury TVs surging in the GCC, says Samsung
- Empowering Growth: The Thriving Journey of Bangladesh’s Cable Industry
Latest Reports
- Nicaragua RPG Gaming Market (2026-2032)
- New Zealand RPG Gaming Market (2026-2032)
- Netherlands RPG Gaming Market (2026-2032)
- Nauru RPG Gaming Market (2026-2032)
- Namibia RPG Gaming Market (2026-2032)
- Mozambique RPG Gaming Market (2026-2032)
- Montenegro RPG Gaming Market (2026-2032)
- Mongolia RPG Gaming Market (2026-2032)
- Monaco RPG Gaming Market (2026-2032)
- Micronesia RPG Gaming Market (2026-2032)
Industry Events and Analyst Meet

EV India Expo 2026

HIMTEX 2026

India Refining Summit 2026

India EV Show 2026

EV tech India Expo 2026
Whitepaper
- Middle East & Africa Commercial Security Market Click here to view more.
- Middle East & Africa Fire Safety Systems & Equipment Market Click here to view more.
- GCC Drone Market Click here to view more.
- Middle East Lighting Fixture Market Click here to view more.
- GCC Physical & Perimeter Security Market Click here to view more.