Greece Bio Plasticizer Market (2026-2032) | Forecast, Value, Growth, Trends, Share, Analysis, Companies, Segmentation, Revenue, Industry, Outlook & Size
Market Forecast By Type (Sebacates, Succinic Acid, Citrates, Glycerol Esters, Others, Epoxides), By Application (Flooring and Walls, Film and Sheet Coverings, Wires and Cables, Coated Fabrics, Consumer Goods, Others) And Competitive Landscape
| Product Code: ETC5667282 | Publication Date: Nov 2023 | Updated Date: Apr 2026 | Product Type: Market Research Report | |
| Publisher: 6Wresearch | Author: Ravi Bhandari | No. of Pages: 60 | No. of Figures: 30 | No. of Tables: 5 |
Greece Bio Plasticizer Market Size (2020-2030)
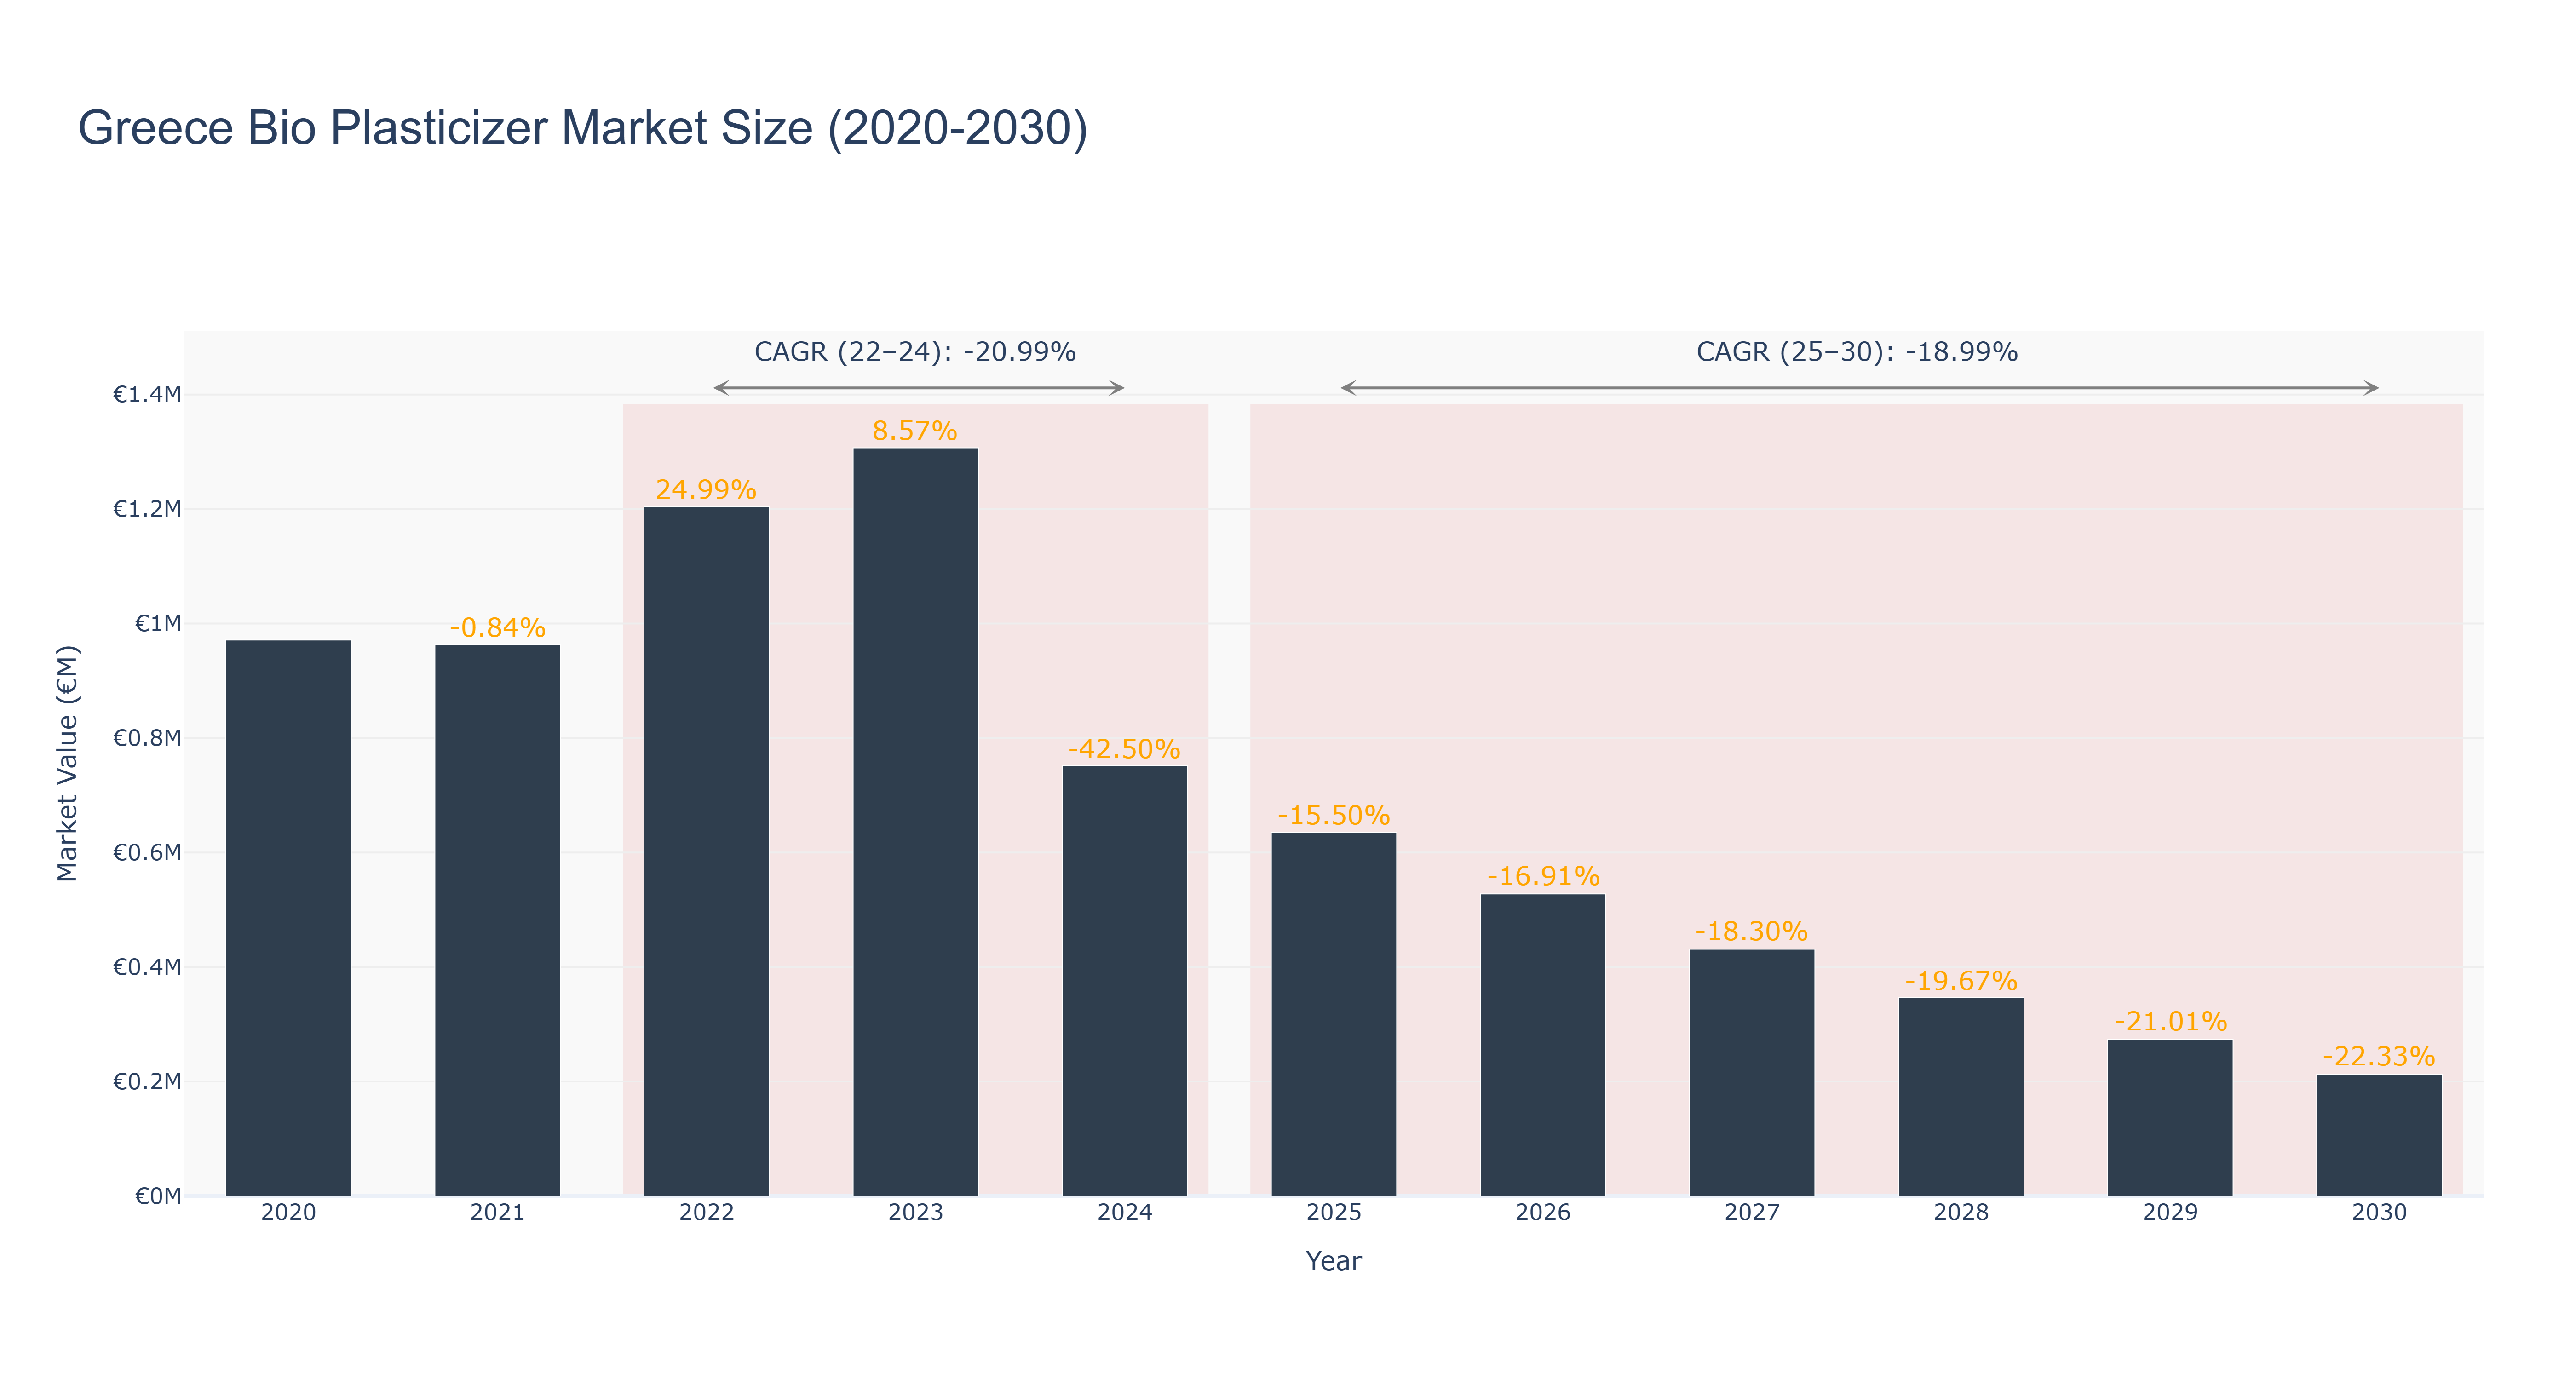
The Greece Bio Plasticizer Market experienced notable fluctuations between 2020 and 2024. The market peaked in 2022 with a size of €1.20 million, reflecting a remarkable growth of 24.99% from the previous year. However, this was followed by a decline, with the market size dropping to €751.53 thousand in 2024, resulting in a negative CAGR of -20.99% for the actual period from 2022 to 2024. Looking ahead, the forecasted period from 2025 to 2030 presents a challenging outlook, with projected market sizes decreasing from €635.03 thousand in 2025 to €212.46 thousand by 2030, reflecting an overall CAGR of -18.99%. This decline may be driven by increasing competition from alternative materials and regulatory challenges. Despite these hurdles, ongoing innovations in bio-based materials and potential shifts towards sustainable practices may offer future growth opportunities in the market.
Greece Bio Plasticizer Market: Production & Trade Performance (2019-2025)
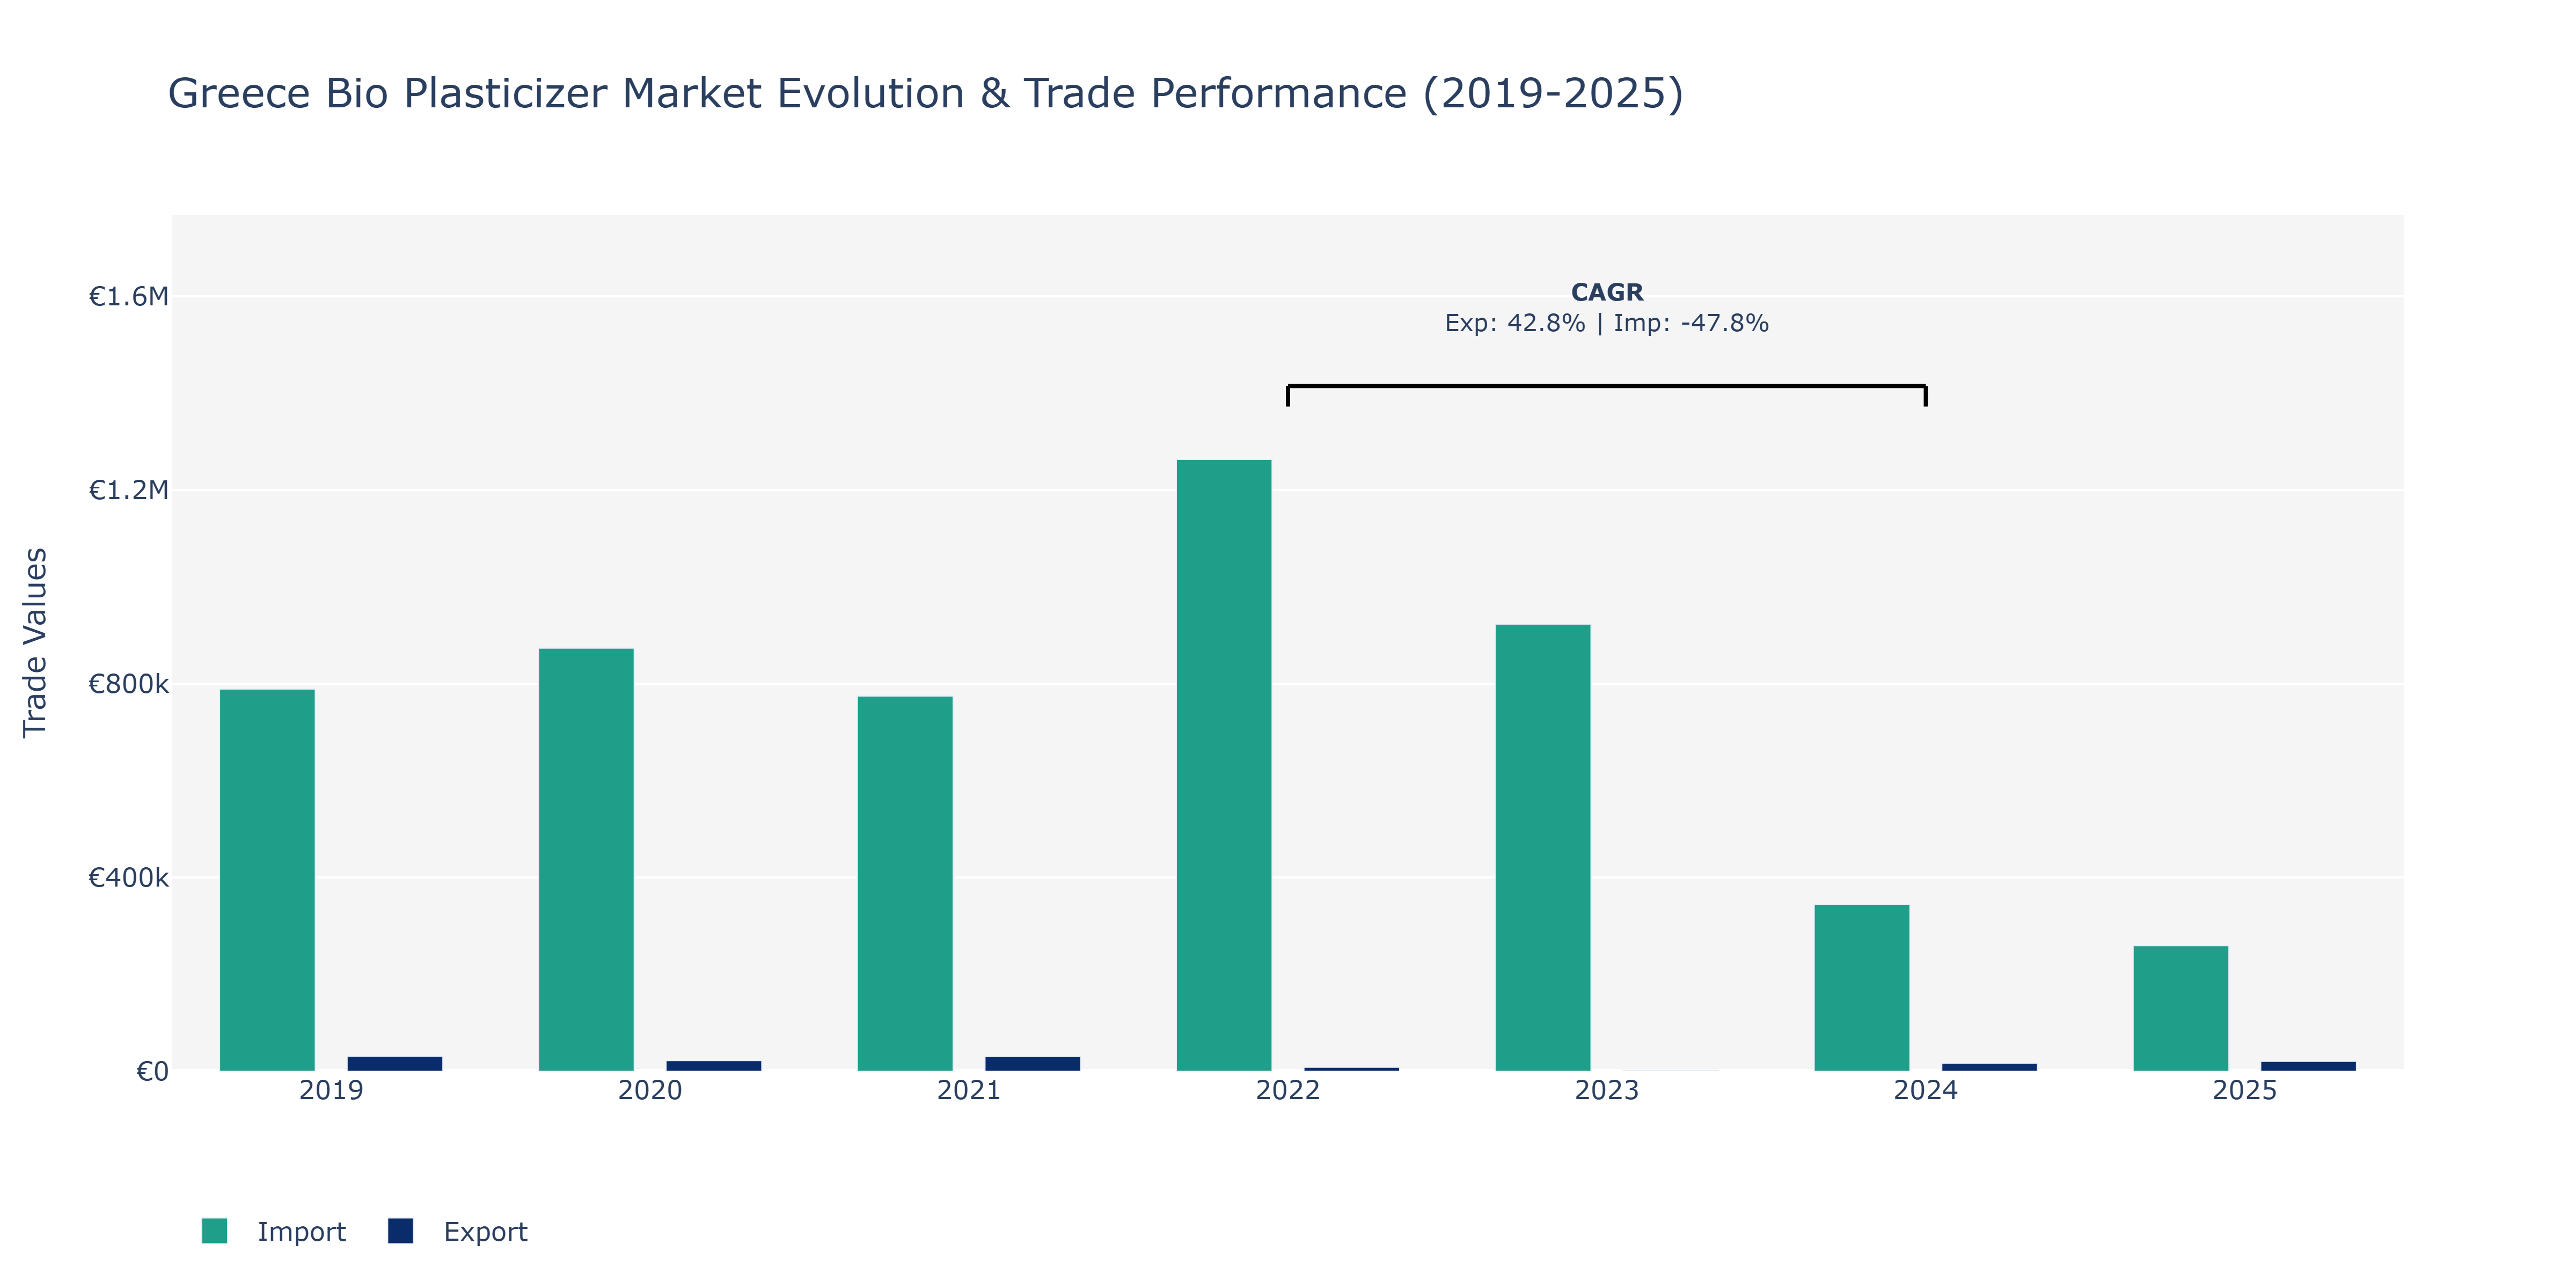
In the Greece Bio Plasticizer Market, exports experienced a notable fluctuation over the years. Starting at €30.8 thousand in 2019, exports declined sharply to €8.04 thousand in 2022, showcasing a substantial drop. However, there was a significant recovery in 2023, with exports reaching €1.8 thousand and then further increasing to €16.39 thousand in 2024. This rebound could be attributed to strategic market positioning and potentially the introduction of innovative product lines. Conversely, imports displayed a different pattern, peaking at €788.88 thousand in 2019, followed by a steady decline through 2021. Although there was a slight uptick in 2022, the trend reversed in 2024, with imports totaling €344.55 thousand. This downward trend might be influenced by shifting global trade dynamics or changes in domestic demand. The contrasting movements between exports and imports indicate evolving market dynamics and emphasize the need for adaptive market strategies in the bio plasticizer sector in Greece.
Key Highlights of the Report:
- Greece Bio Plasticizer Market Outlook
- Market Size of Greece Bio Plasticizer Market, 2025
- Forecast of Greece Bio Plasticizer Market, 2032
- Historical Data and Forecast of Greece Bio Plasticizer Revenues & Volume for the Period 2022-2032F
- Greece Bio Plasticizer Market Trend Evolution
- Greece Bio Plasticizer Market Drivers and Challenges
- Greece Bio Plasticizer Price Trends
- Greece Bio Plasticizer Porter`s Five Forces
- Greece Bio Plasticizer Industry Life Cycle
- Historical Data and Forecast of Greece Bio Plasticizer Market Revenues & Volume By Type for the Period 2022-2032F
- Historical Data and Forecast of Greece Bio Plasticizer Market Revenues & Volume By Sebacates for the Period 2022-2032F
- Historical Data and Forecast of Greece Bio Plasticizer Market Revenues & Volume By Succinic Acid for the Period 2022-2032F
- Historical Data and Forecast of Greece Bio Plasticizer Market Revenues & Volume By Citrates for the Period 2022-2032F
- Historical Data and Forecast of Greece Bio Plasticizer Market Revenues & Volume By Glycerol Esters for the Period 2022-2032F
- Historical Data and Forecast of Greece Bio Plasticizer Market Revenues & Volume By Others for the Period 2022-2032F
- Historical Data and Forecast of Greece Bio Plasticizer Market Revenues & Volume By Epoxides for the Period 2022-2032F
- Historical Data and Forecast of Greece Bio Plasticizer Market Revenues & Volume By Application for the Period 2022-2032F
- Historical Data and Forecast of Greece Bio Plasticizer Market Revenues & Volume By Flooring and Walls for the Period 2022-2032F
- Historical Data and Forecast of Greece Bio Plasticizer Market Revenues & Volume By Film and Sheet Coverings for the Period 2022-2032F
- Historical Data and Forecast of Greece Bio Plasticizer Market Revenues & Volume By Wires and Cables for the Period 2022-2032F
- Historical Data and Forecast of Greece Bio Plasticizer Market Revenues & Volume By Coated Fabrics for the Period 2022-2032F
- Historical Data and Forecast of Greece Bio Plasticizer Market Revenues & Volume By Consumer Goods for the Period 2022-2032F
- Historical Data and Forecast of Greece Bio Plasticizer Market Revenues & Volume By Others for the Period 2022-2032F
- Greece Bio Plasticizer Import Export Trade Statistics
- Market Opportunity Assessment By Type
- Market Opportunity Assessment By Application
- Greece Bio Plasticizer Top Companies Market Share
- Greece Bio Plasticizer Competitive Benchmarking By Technical and Operational Parameters
- Greece Bio Plasticizer Company Profiles
- Greece Bio Plasticizer Key Strategic Recommendations
Frequently Asked Questions About the Market Study (FAQs):
6Wresearch actively monitors the Greece Bio Plasticizer Market and publishes its comprehensive annual report, highlighting emerging trends, growth drivers, revenue analysis, and forecast outlook. Our insights help businesses to make data-backed strategic decisions with ongoing market dynamics. Our analysts track relevent industries related to the Greece Bio Plasticizer Market, allowing our clients with actionable intelligence and reliable forecasts tailored to emerging regional needs.
Yes, we provide customisation as per your requirements. To learn more, feel free to contact us on sales@6wresearch.com
1 Executive Summary |
2 Introduction |
2.1 Key Highlights of the Report |
2.2 Report Description |
2.3 Market Scope & Segmentation |
2.4 Research Methodology |
2.5 Assumptions |
3 Greece Bio Plasticizer Market Overview |
3.1 Greece Country Macro Economic Indicators |
3.2 Greece Bio Plasticizer Market Revenues & Volume, 2022 & 2032F |
3.3 Greece Bio Plasticizer Market - Industry Life Cycle |
3.4 Greece Bio Plasticizer Market - Porter's Five Forces |
3.5 Greece Bio Plasticizer Market Revenues & Volume Share, By Type, 2022 & 2032F |
3.6 Greece Bio Plasticizer Market Revenues & Volume Share, By Application, 2022 & 2032F |
4 Greece Bio Plasticizer Market Dynamics |
4.1 Impact Analysis |
4.2 Market Drivers |
4.2.1 Increasing environmental concerns and regulations promoting the use of bio-based and sustainable solutions. |
4.2.2 Growing consumer awareness and demand for eco-friendly products. |
4.2.3 Government initiatives and policies supporting the development and adoption of bio plasticizers in Greece. |
4.3 Market Restraints |
4.3.1 High production costs associated with bio plasticizers compared to conventional plasticizers. |
4.3.2 Limited availability and higher prices of raw materials for bio plasticizer production in Greece. |
5 Greece Bio Plasticizer Market Trends |
6 Greece Bio Plasticizer Market Segmentations |
6.1 Greece Bio Plasticizer Market, By Type |
6.1.1 Overview and Analysis |
6.1.2 Greece Bio Plasticizer Market Revenues & Volume, By Sebacates, 2022-2032F |
6.1.3 Greece Bio Plasticizer Market Revenues & Volume, By Succinic Acid, 2022-2032F |
6.1.4 Greece Bio Plasticizer Market Revenues & Volume, By Citrates, 2022-2032F |
6.1.5 Greece Bio Plasticizer Market Revenues & Volume, By Glycerol Esters, 2022-2032F |
6.1.6 Greece Bio Plasticizer Market Revenues & Volume, By Others, 2022-2032F |
6.1.7 Greece Bio Plasticizer Market Revenues & Volume, By Epoxides, 2022-2032F |
6.2 Greece Bio Plasticizer Market, By Application |
6.2.1 Overview and Analysis |
6.2.2 Greece Bio Plasticizer Market Revenues & Volume, By Flooring and Walls, 2022-2032F |
6.2.3 Greece Bio Plasticizer Market Revenues & Volume, By Film and Sheet Coverings, 2022-2032F |
6.2.4 Greece Bio Plasticizer Market Revenues & Volume, By Wires and Cables, 2022-2032F |
6.2.5 Greece Bio Plasticizer Market Revenues & Volume, By Coated Fabrics, 2022-2032F |
6.2.6 Greece Bio Plasticizer Market Revenues & Volume, By Consumer Goods, 2022-2032F |
6.2.7 Greece Bio Plasticizer Market Revenues & Volume, By Others, 2022-2032F |
7 Greece Bio Plasticizer Market Import-Export Trade Statistics |
7.1 Greece Bio Plasticizer Market Export to Major Countries |
7.2 Greece Bio Plasticizer Market Imports from Major Countries |
8 Greece Bio Plasticizer Market Key Performance Indicators |
8.1 Percentage of companies in the plasticizer industry in Greece adopting bio plasticizers in their product lines. |
8.2 Investment in research and development for bio plasticizer technologies by companies in Greece. |
8.3 Number of new bio plasticizer products introduced in the Greek market. |
8.4 Environmental impact assessment of bio plasticizers used in Greece compared to conventional plasticizers. |
9 Greece Bio Plasticizer Market - Opportunity Assessment |
9.1 Greece Bio Plasticizer Market Opportunity Assessment, By Type, 2022 & 2032F |
9.2 Greece Bio Plasticizer Market Opportunity Assessment, By Application, 2022 & 2032F |
10 Greece Bio Plasticizer Market - Competitive Landscape |
10.1 Greece Bio Plasticizer Market Revenue Share, By Companies, 2025 |
10.2 Greece Bio Plasticizer Market Competitive Benchmarking, By Operating and Technical Parameters |
11 Company Profiles |
12 Recommendations | 13 Disclaimer |
Global Go To Market Strategy - 2030
Export potential enables firms to identify high-growth global markets with greater confidence by combining advanced trade intelligence with a structured quantitative methodology. The framework analyzes emerging demand trends and country-level import patterns while integrating macroeconomic and trade datasets such as GDP and population forecasts, bilateral import–export flows, tariff structures, elasticity differentials between developed and developing economies, geographic distance, and import demand projections. Using weighted trade values from 2020–2024 as the base period to project country-to-country export potential for 2030, these inputs are operationalized through calculated drivers such as gravity model parameters, tariff impact factors, and projected GDP per-capita growth. Through an analysis of hidden potentials, demand hotspots, and market conditions that are most favorable to success, this method enables firms to focus on target countries, maximize returns, and global expansion with data, backed by accuracy.
By factoring in the projected importer demand gap that is currently unmet and could be potential opportunity, it identifies the potential for the Exporter (Country) among 190 countries, against the general trade analysis, which identifies the biggest importer or exporter.
To discover high-growth global markets and optimize your business strategy:
Click Here
Pricing
- Single User License$ 1,995
- Department License$ 2,400
- Site License$ 3,120
- Global License$ 3,795

Leadership Perspectives from Industry Events
Search
Thought Leadership and Analyst Meet


Our Clients
6WResearch In News
- India Export Attractiveness Tracker 2026
- India Air Conditioner Market Set for Strong Rebound in 2026 After Weather-Led Correction and GST-Driven Recovery: 6Wresearch
- ADAS in India: How Automatic Emergency Braking, Blind Spot Detection & Driver Monitoring are Transforming Road Safety
- Doha a strategic location for EV manufacturing hub: IPA Qatar
- Demand for luxury TVs surging in the GCC, says Samsung
- Empowering Growth: The Thriving Journey of Bangladesh’s Cable Industry
Latest Reports
- Nicaragua RPG Gaming Market (2026-2032)
- New Zealand RPG Gaming Market (2026-2032)
- Netherlands RPG Gaming Market (2026-2032)
- Nauru RPG Gaming Market (2026-2032)
- Namibia RPG Gaming Market (2026-2032)
- Mozambique RPG Gaming Market (2026-2032)
- Montenegro RPG Gaming Market (2026-2032)
- Mongolia RPG Gaming Market (2026-2032)
- Monaco RPG Gaming Market (2026-2032)
- Micronesia RPG Gaming Market (2026-2032)
Industry Events and Analyst Meet

EV India Expo 2026

HIMTEX 2026

India Refining Summit 2026

India EV Show 2026

EV tech India Expo 2026
Whitepaper
- Middle East & Africa Commercial Security Market Click here to view more.
- Middle East & Africa Fire Safety Systems & Equipment Market Click here to view more.
- GCC Drone Market Click here to view more.
- Middle East Lighting Fixture Market Click here to view more.
- GCC Physical & Perimeter Security Market Click here to view more.