Greece Check Valve Market (2026-2032) | Size, Revenue, Outlook, Forecast, Industry, Segmentation, Value, Companies, Growth, Analysis, Share & Trends
Market Forecast By Type (Swing Check Valves, Lift Check Valve, Other), By Application (Chemical, Power, Mining, Oil & Gas, Water & Wastewater, Other Applications) And Competitive Landscape
| Product Code: ETC5172541 | Publication Date: Nov 2023 | Updated Date: Apr 2026 | Product Type: Market Research Report | |
| Publisher: 6Wresearch | Author: Shubham Padhi | No. of Pages: 60 | No. of Figures: 30 | No. of Tables: 5 |
Greece Check Valve Market Size (2020-2030)
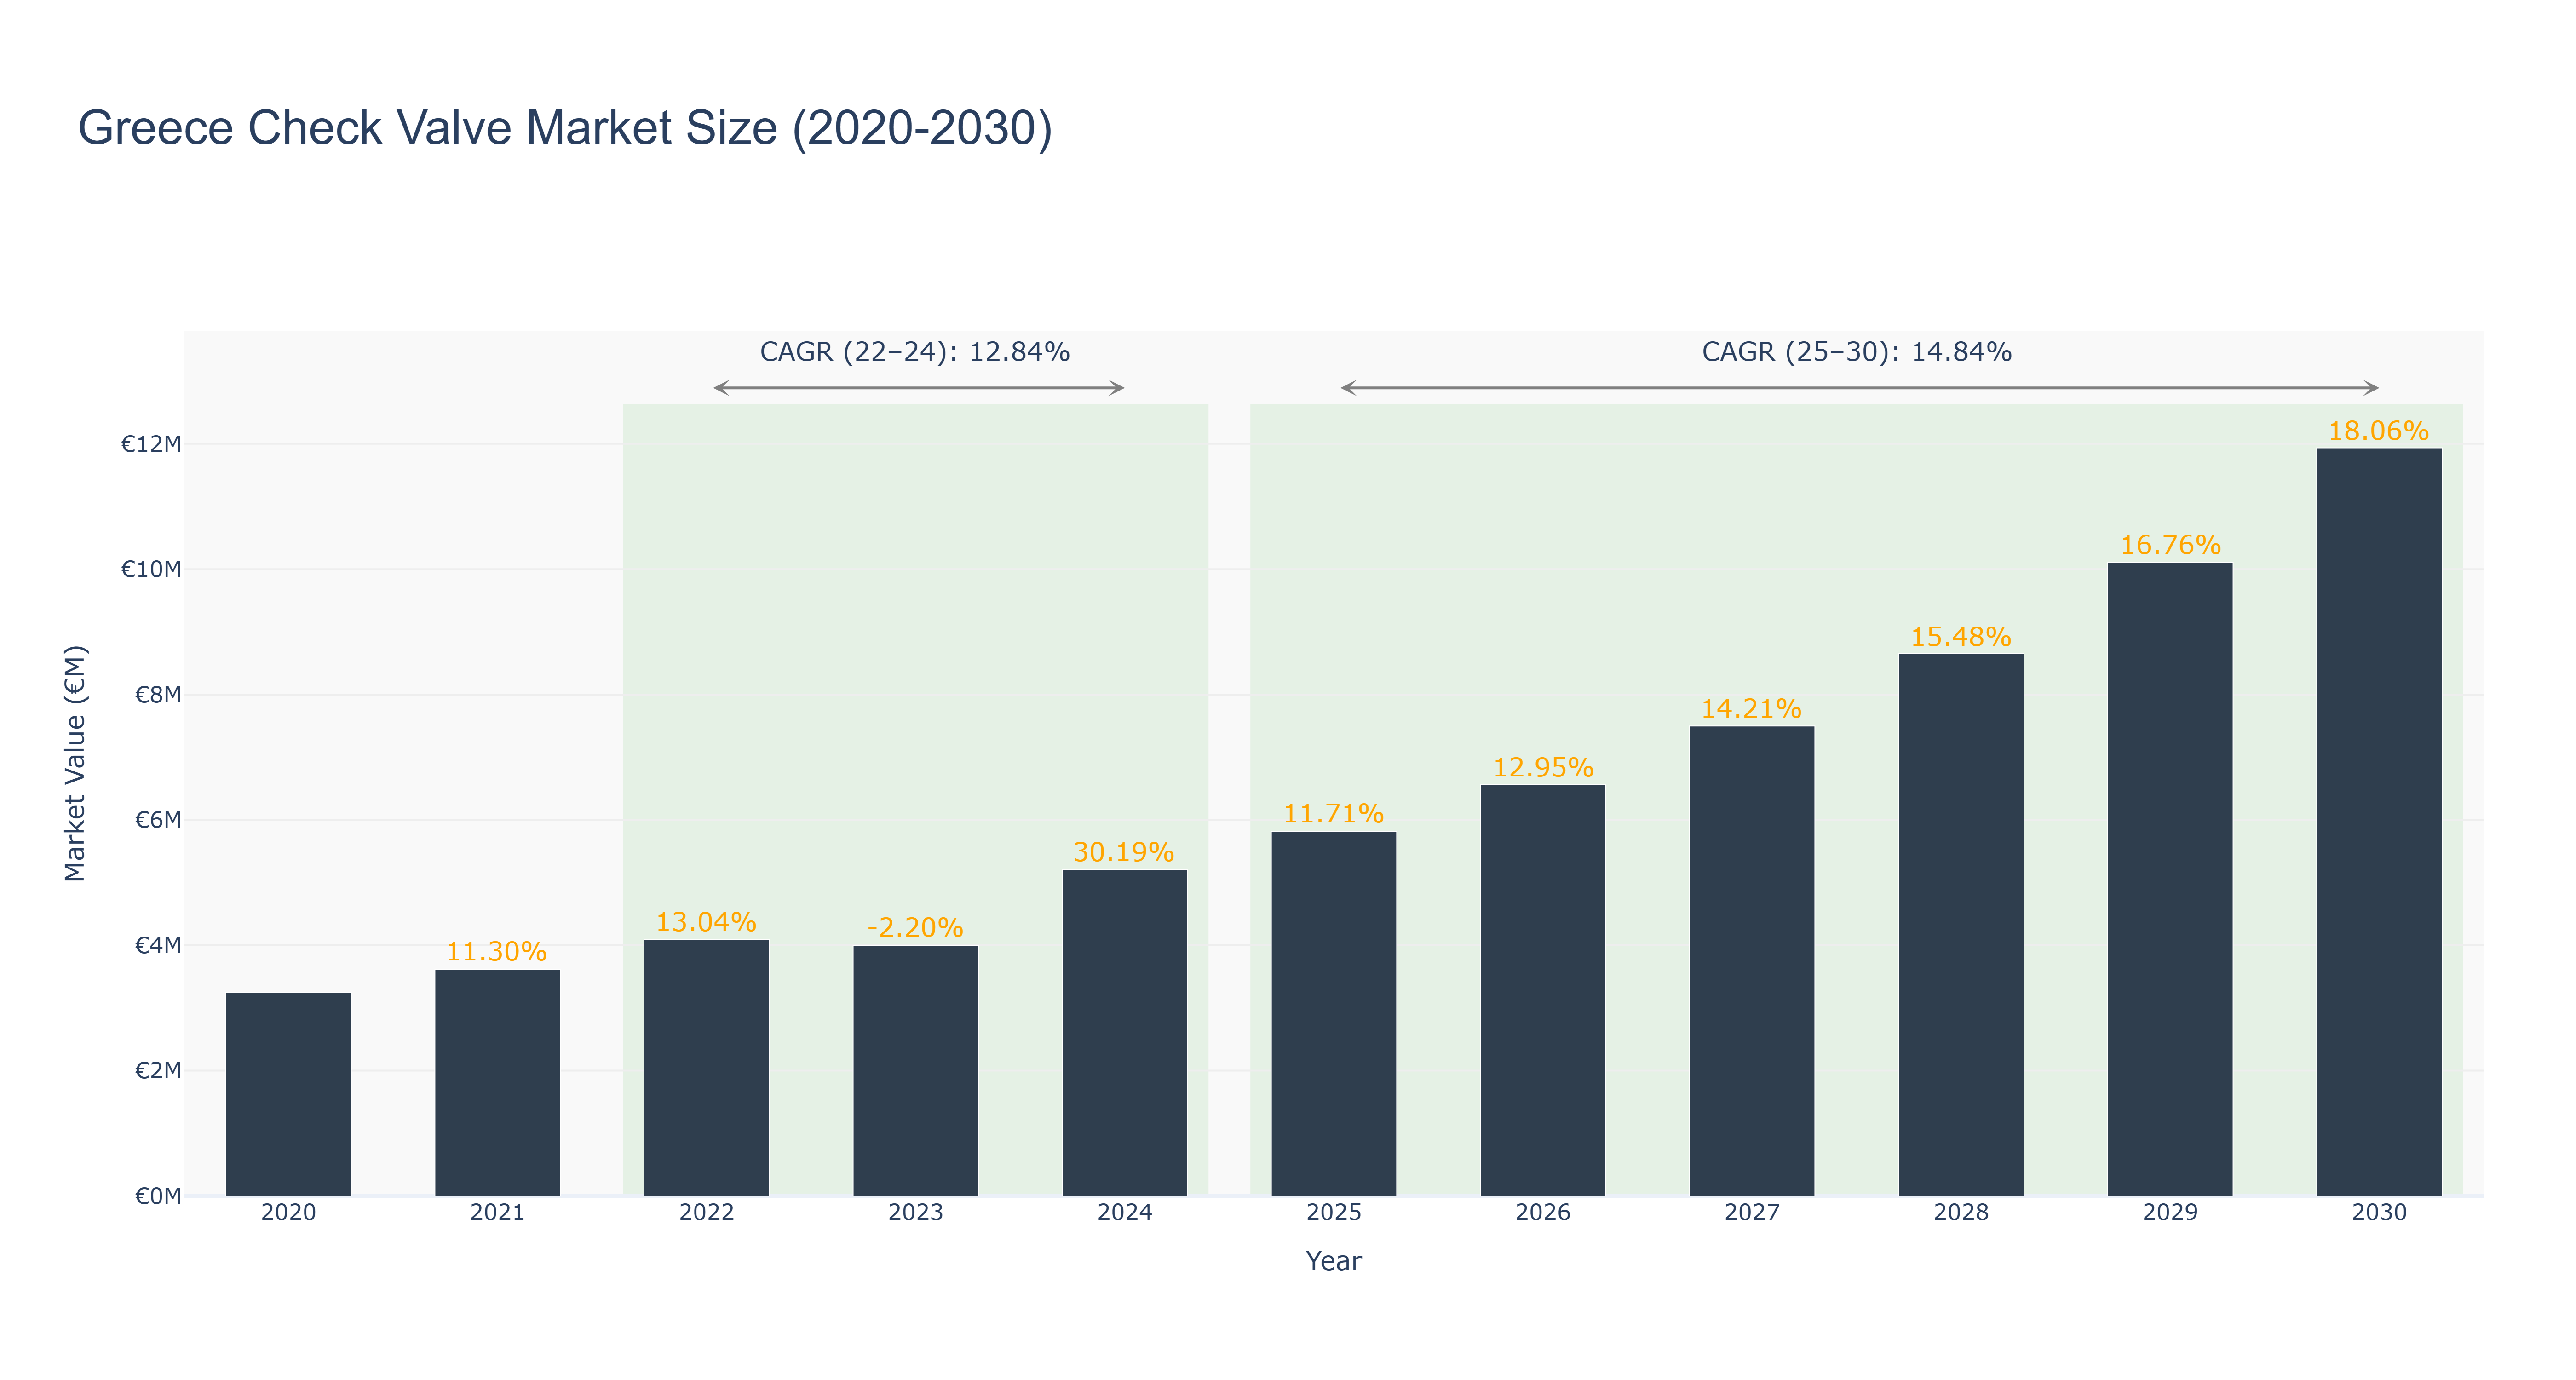
The Greece Check Valve Market has shown a steady growth trajectory over the years. The peak market size of €11.94 million is forecasted for 2030, with a notable increase from €3.25 million in 2020. The market experienced a significant growth spurt from 2024 to 2025, attributed to a CAGR of 14.83941932%. The CAGR from 2022 to 2024 was 12.83941932%, reflecting a positive trend in market expansion. The market faced a slight decline in 2023 due to external economic factors but quickly recovered. Industry drivers such as increasing demand for industrial automation and infrastructure development have been key factors in driving market growth. Looking ahead, upcoming infrastructure projects in Greece, such as the expansion of renewable energy sources, are expected to further boost the demand for check valves in various sectors.
Greece Check Valve Market: Production & Trade Performance (2019-2025)
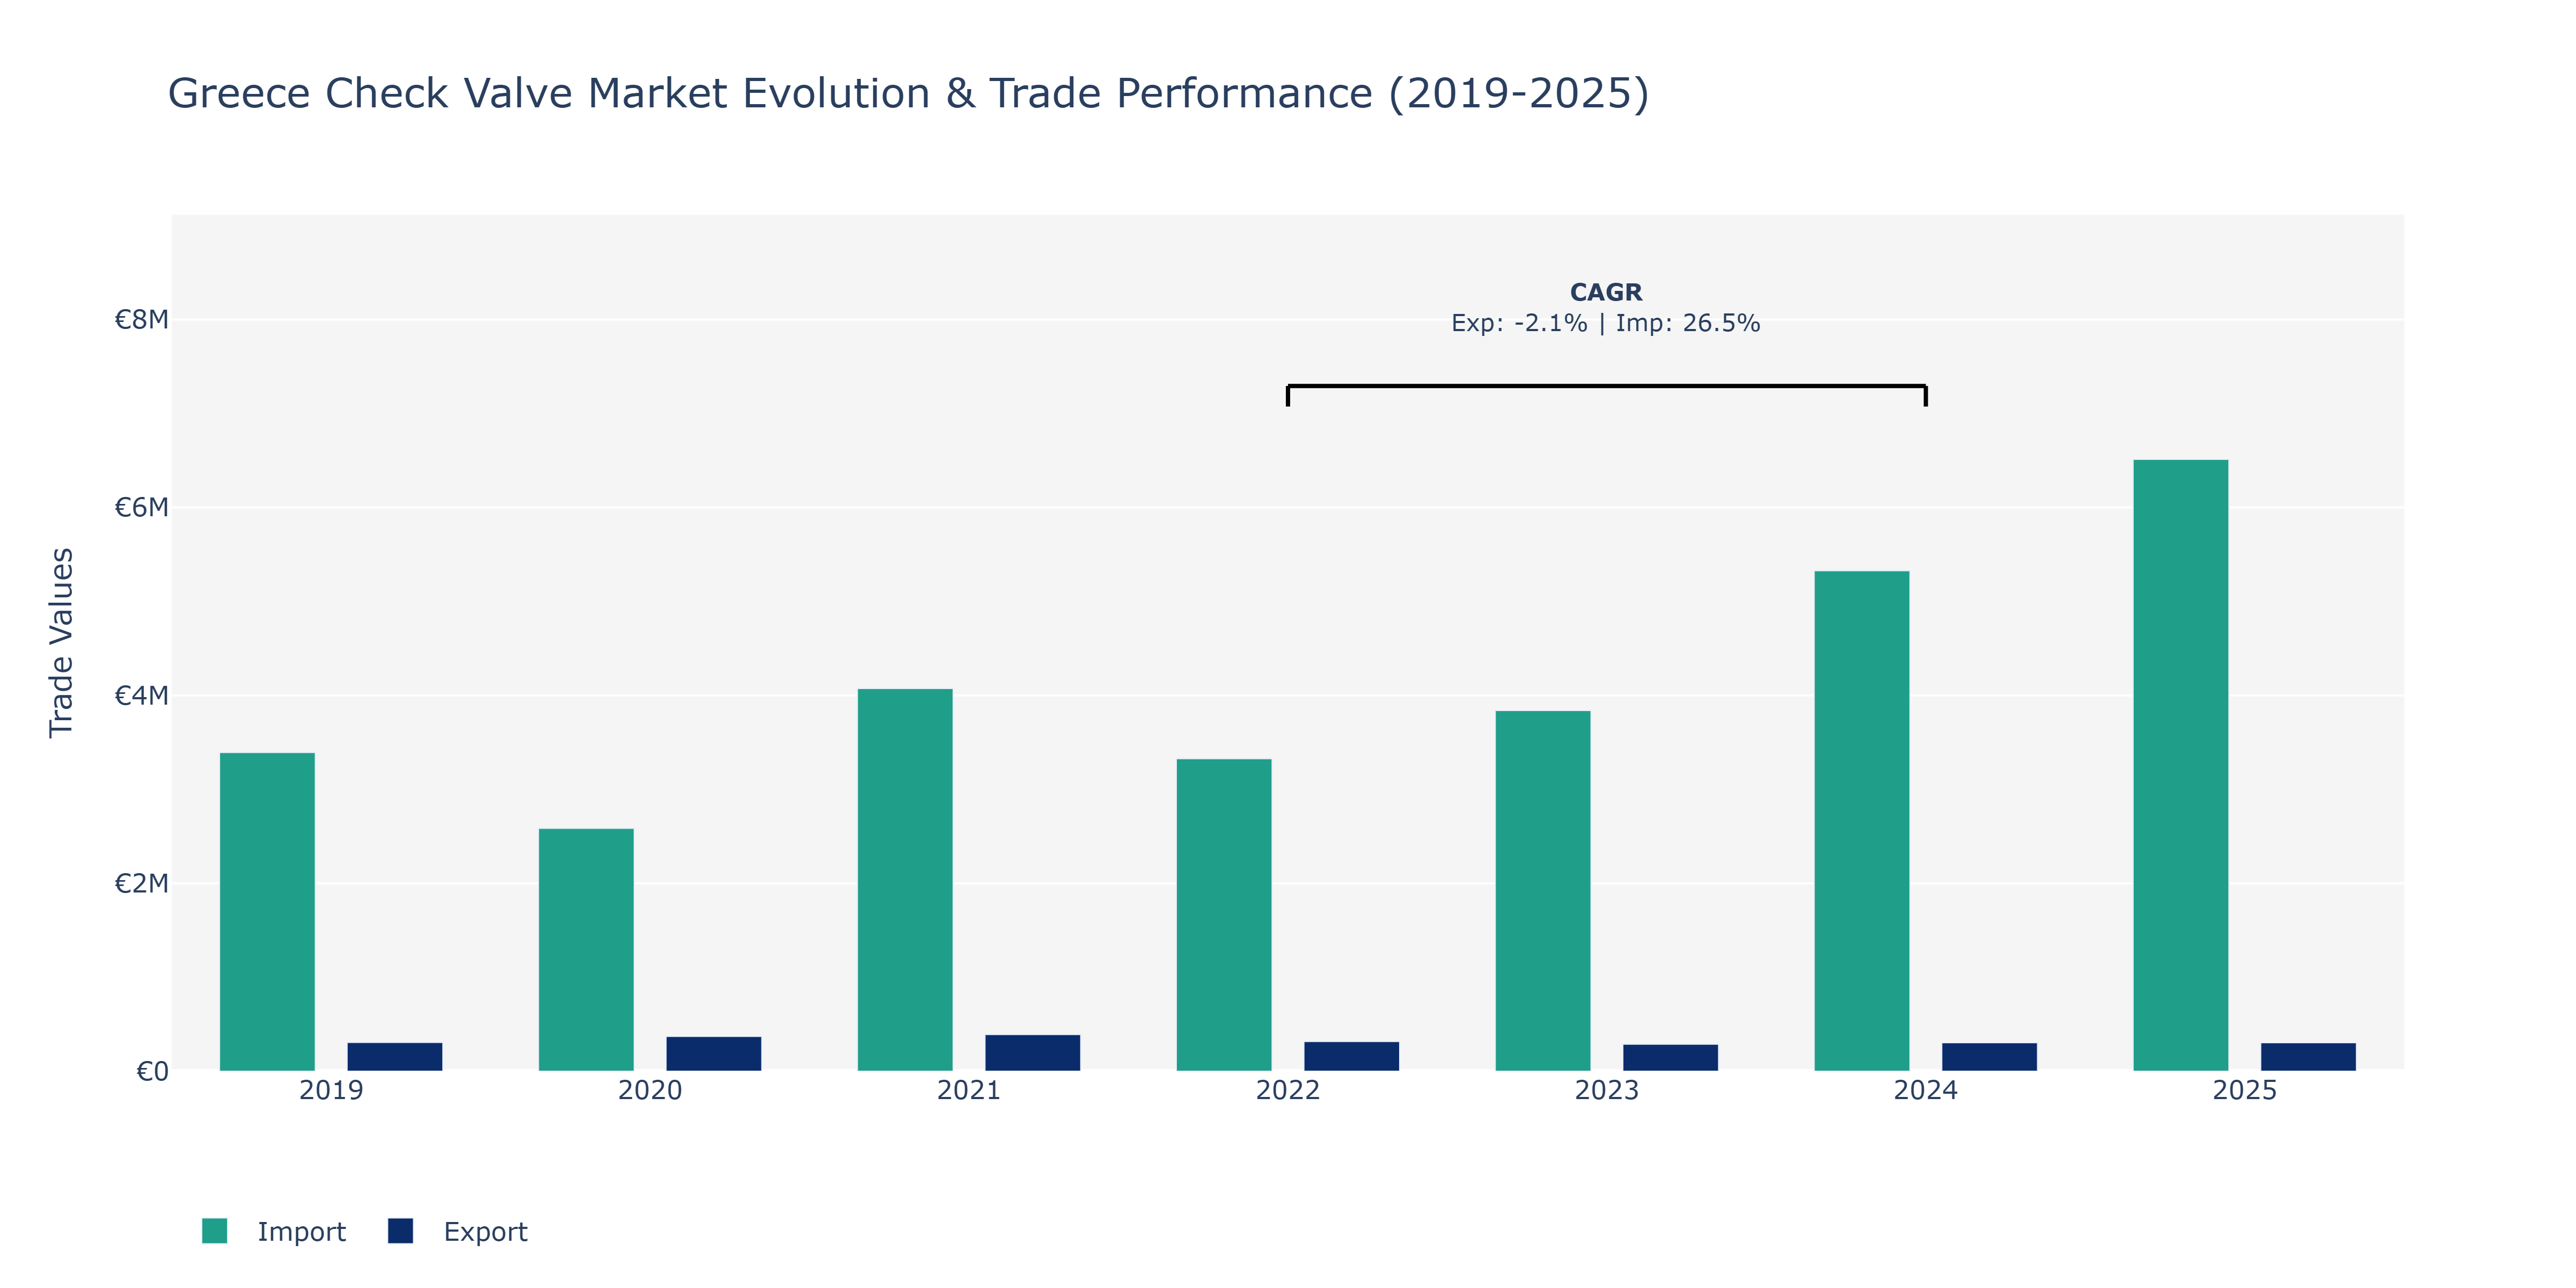
In the Greece Check Valve Market, exports experienced fluctuations over the provided years, with a peak of €389.54 thousand in 2021, followed by a slight decrease in the following years. Imports, on the other hand, showed a steady increase year over year, reaching €6.51 million in 2025, marking a significant growth from €3.39 million in 2019. The notable surge in imports can be attributed to increased demand for foreign check valve products to support infrastructure development and industrial projects in Greece. Despite a temporary decline in exports, the market showcased resilience with a rebound in 2024. This recovery could be linked to strategic partnerships and market expansion initiatives undertaken by Greek check valve manufacturers. The contrasting trends between exports and imports underscore the evolving dynamics of the market, emphasizing the importance of competitive pricing strategies and product innovation to maintain market share and capitalize on growing import opportunities.
Key Highlights of the Report:
- Greece Check Valve Market Outlook
- Market Size of Greece Check Valve Market, 2025
- Forecast of Greece Check Valve Market, 2032
- Historical Data and Forecast of Greece Check Valve Revenues & Volume for the Period 2022-2032F
- Greece Check Valve Market Trend Evolution
- Greece Check Valve Market Drivers and Challenges
- Greece Check Valve Price Trends
- Greece Check Valve Porter`s Five Forces
- Greece Check Valve Industry Life Cycle
- Historical Data and Forecast of Greece Check Valve Market Revenues & Volume By Type for the Period 2022-2032F
- Historical Data and Forecast of Greece Check Valve Market Revenues & Volume By Swing Check Valves for the Period 2022-2032F
- Historical Data and Forecast of Greece Check Valve Market Revenues & Volume By Lift Check Valve for the Period 2022-2032F
- Historical Data and Forecast of Greece Check Valve Market Revenues & Volume By Other for the Period 2022-2032F
- Historical Data and Forecast of Greece Check Valve Market Revenues & Volume By Application for the Period 2022-2032F
- Historical Data and Forecast of Greece Check Valve Market Revenues & Volume By Chemical for the Period 2022-2032F
- Historical Data and Forecast of Greece Check Valve Market Revenues & Volume By Power for the Period 2022-2032F
- Historical Data and Forecast of Greece Check Valve Market Revenues & Volume By Mining for the Period 2022-2032F
- Historical Data and Forecast of Greece Check Valve Market Revenues & Volume By Oil & Gas for the Period 2022-2032F
- Historical Data and Forecast of Greece Check Valve Market Revenues & Volume By Water & Wastewater for the Period 2022-2032F
- Historical Data and Forecast of Greece Check Valve Market Revenues & Volume By Other Applications for the Period 2022-2032F
- Greece Check Valve Import Export Trade Statistics
- Market Opportunity Assessment By Type
- Market Opportunity Assessment By Application
- Greece Check Valve Top Companies Market Share
- Greece Check Valve Competitive Benchmarking By Technical and Operational Parameters
- Greece Check Valve Company Profiles
- Greece Check Valve Key Strategic Recommendations
Frequently Asked Questions About the Market Study (FAQs):
6Wresearch actively monitors the Greece Check Valve Market and publishes its comprehensive annual report, highlighting emerging trends, growth drivers, revenue analysis, and forecast outlook. Our insights help businesses to make data-backed strategic decisions with ongoing market dynamics. Our analysts track relevent industries related to the Greece Check Valve Market, allowing our clients with actionable intelligence and reliable forecasts tailored to emerging regional needs.
Yes, we provide customisation as per your requirements. To learn more, feel free to contact us on sales@6wresearch.com
1 Executive Summary |
2 Introduction |
2.1 Key Highlights of the Report |
2.2 Report Description |
2.3 Market Scope & Segmentation |
2.4 Research Methodology |
2.5 Assumptions |
3 Greece Check Valve Market Overview |
3.1 Greece Country Macro Economic Indicators |
3.2 Greece Check Valve Market Revenues & Volume, 2022 & 2032F |
3.3 Greece Check Valve Market - Industry Life Cycle |
3.4 Greece Check Valve Market - Porter's Five Forces |
3.5 Greece Check Valve Market Revenues & Volume Share, By Type, 2022 & 2032F |
3.6 Greece Check Valve Market Revenues & Volume Share, By Application, 2022 & 2032F |
4 Greece Check Valve Market Dynamics |
4.1 Impact Analysis |
4.2 Market Drivers |
4.2.1 Increasing demand for check valves in the oil and gas industry for controlling flow and preventing backflow. |
4.2.2 Growing emphasis on water and wastewater treatment infrastructure development in Greece, driving the need for check valves. |
4.2.3 Adoption of check valves in HVAC systems for efficient flow control and energy savings. |
4.3 Market Restraints |
4.3.1 Economic instability in Greece impacting investments in infrastructure projects. |
4.3.2 Competition from alternative valve types such as ball valves and gate valves. |
4.3.3 Regulatory challenges related to environmental standards and compliance affecting market growth. |
5 Greece Check Valve Market Trends |
6 Greece Check Valve Market Segmentations |
6.1 Greece Check Valve Market, By Type |
6.1.1 Overview and Analysis |
6.1.2 Greece Check Valve Market Revenues & Volume, By Swing Check Valves, 2022-2032F |
6.1.3 Greece Check Valve Market Revenues & Volume, By Lift Check Valve, 2022-2032F |
6.1.4 Greece Check Valve Market Revenues & Volume, By Other, 2022-2032F |
6.2 Greece Check Valve Market, By Application |
6.2.1 Overview and Analysis |
6.2.2 Greece Check Valve Market Revenues & Volume, By Chemical, 2022-2032F |
6.2.3 Greece Check Valve Market Revenues & Volume, By Power, 2022-2032F |
6.2.4 Greece Check Valve Market Revenues & Volume, By Mining, 2022-2032F |
6.2.5 Greece Check Valve Market Revenues & Volume, By Oil & Gas, 2022-2032F |
6.2.6 Greece Check Valve Market Revenues & Volume, By Water & Wastewater, 2022-2032F |
6.2.7 Greece Check Valve Market Revenues & Volume, By Other Applications, 2022-2032F |
7 Greece Check Valve Market Import-Export Trade Statistics |
7.1 Greece Check Valve Market Export to Major Countries |
7.2 Greece Check Valve Market Imports from Major Countries |
8 Greece Check Valve Market Key Performance Indicators |
8.1 Number of infrastructure projects incorporating check valves. |
8.2 Adoption rate of check valves in key industries like oil and gas, water treatment, and HVAC. |
8.3 Percentage increase in demand for check valves compared to previous years. |
9 Greece Check Valve Market - Opportunity Assessment |
9.1 Greece Check Valve Market Opportunity Assessment, By Type, 2022 & 2032F |
9.2 Greece Check Valve Market Opportunity Assessment, By Application, 2022 & 2032F |
10 Greece Check Valve Market - Competitive Landscape |
10.1 Greece Check Valve Market Revenue Share, By Companies, 2025 |
10.2 Greece Check Valve Market Competitive Benchmarking, By Operating and Technical Parameters |
11 Company Profiles |
12 Recommendations | 13 Disclaimer |
Global Go To Market Strategy - 2030
Export potential enables firms to identify high-growth global markets with greater confidence by combining advanced trade intelligence with a structured quantitative methodology. The framework analyzes emerging demand trends and country-level import patterns while integrating macroeconomic and trade datasets such as GDP and population forecasts, bilateral import–export flows, tariff structures, elasticity differentials between developed and developing economies, geographic distance, and import demand projections. Using weighted trade values from 2020–2024 as the base period to project country-to-country export potential for 2030, these inputs are operationalized through calculated drivers such as gravity model parameters, tariff impact factors, and projected GDP per-capita growth. Through an analysis of hidden potentials, demand hotspots, and market conditions that are most favorable to success, this method enables firms to focus on target countries, maximize returns, and global expansion with data, backed by accuracy.
By factoring in the projected importer demand gap that is currently unmet and could be potential opportunity, it identifies the potential for the Exporter (Country) among 190 countries, against the general trade analysis, which identifies the biggest importer or exporter.
To discover high-growth global markets and optimize your business strategy:
Click Here
Pricing
- Single User License$ 1,995
- Department License$ 2,400
- Site License$ 3,120
- Global License$ 3,795

Leadership Perspectives from Industry Events
Search
Thought Leadership and Analyst Meet


Our Clients
6WResearch In News
- India Export Attractiveness Tracker 2026
- India Air Conditioner Market Set for Strong Rebound in 2026 After Weather-Led Correction and GST-Driven Recovery: 6Wresearch
- ADAS in India: How Automatic Emergency Braking, Blind Spot Detection & Driver Monitoring are Transforming Road Safety
- Doha a strategic location for EV manufacturing hub: IPA Qatar
- Demand for luxury TVs surging in the GCC, says Samsung
- Empowering Growth: The Thriving Journey of Bangladesh’s Cable Industry
Latest Reports
- Nicaragua RPG Gaming Market (2026-2032)
- New Zealand RPG Gaming Market (2026-2032)
- Netherlands RPG Gaming Market (2026-2032)
- Nauru RPG Gaming Market (2026-2032)
- Namibia RPG Gaming Market (2026-2032)
- Mozambique RPG Gaming Market (2026-2032)
- Montenegro RPG Gaming Market (2026-2032)
- Mongolia RPG Gaming Market (2026-2032)
- Monaco RPG Gaming Market (2026-2032)
- Micronesia RPG Gaming Market (2026-2032)
Industry Events and Analyst Meet

EV India Expo 2026

HIMTEX 2026

India Refining Summit 2026

India EV Show 2026

EV tech India Expo 2026
Whitepaper
- Middle East & Africa Commercial Security Market Click here to view more.
- Middle East & Africa Fire Safety Systems & Equipment Market Click here to view more.
- GCC Drone Market Click here to view more.
- Middle East Lighting Fixture Market Click here to view more.
- GCC Physical & Perimeter Security Market Click here to view more.