Hungary Glassy Carbon Electrode Market (2026-2032) Outlook | Share, Forecast, Growth, Trends, Size, Analysis, Industry, Revenue, Value & Companies
Market Forecast By Size (Below 3mm, Above 3mm), By Application (Chemically Modified Electrode, Anodic Solution, Working Electrode, Others) And Competitive Landscape
| Product Code: ETC264139 | Publication Date: Aug 2022 | Updated Date: Apr 2026 | Product Type: Market Research Report | |
| Publisher: 6Wresearch | Author: Ravi Bhandari | No. of Pages: 75 | No. of Figures: 35 | No. of Tables: 20 |
Hungary Glassy Carbon Electrode Market Size (2020-2030)
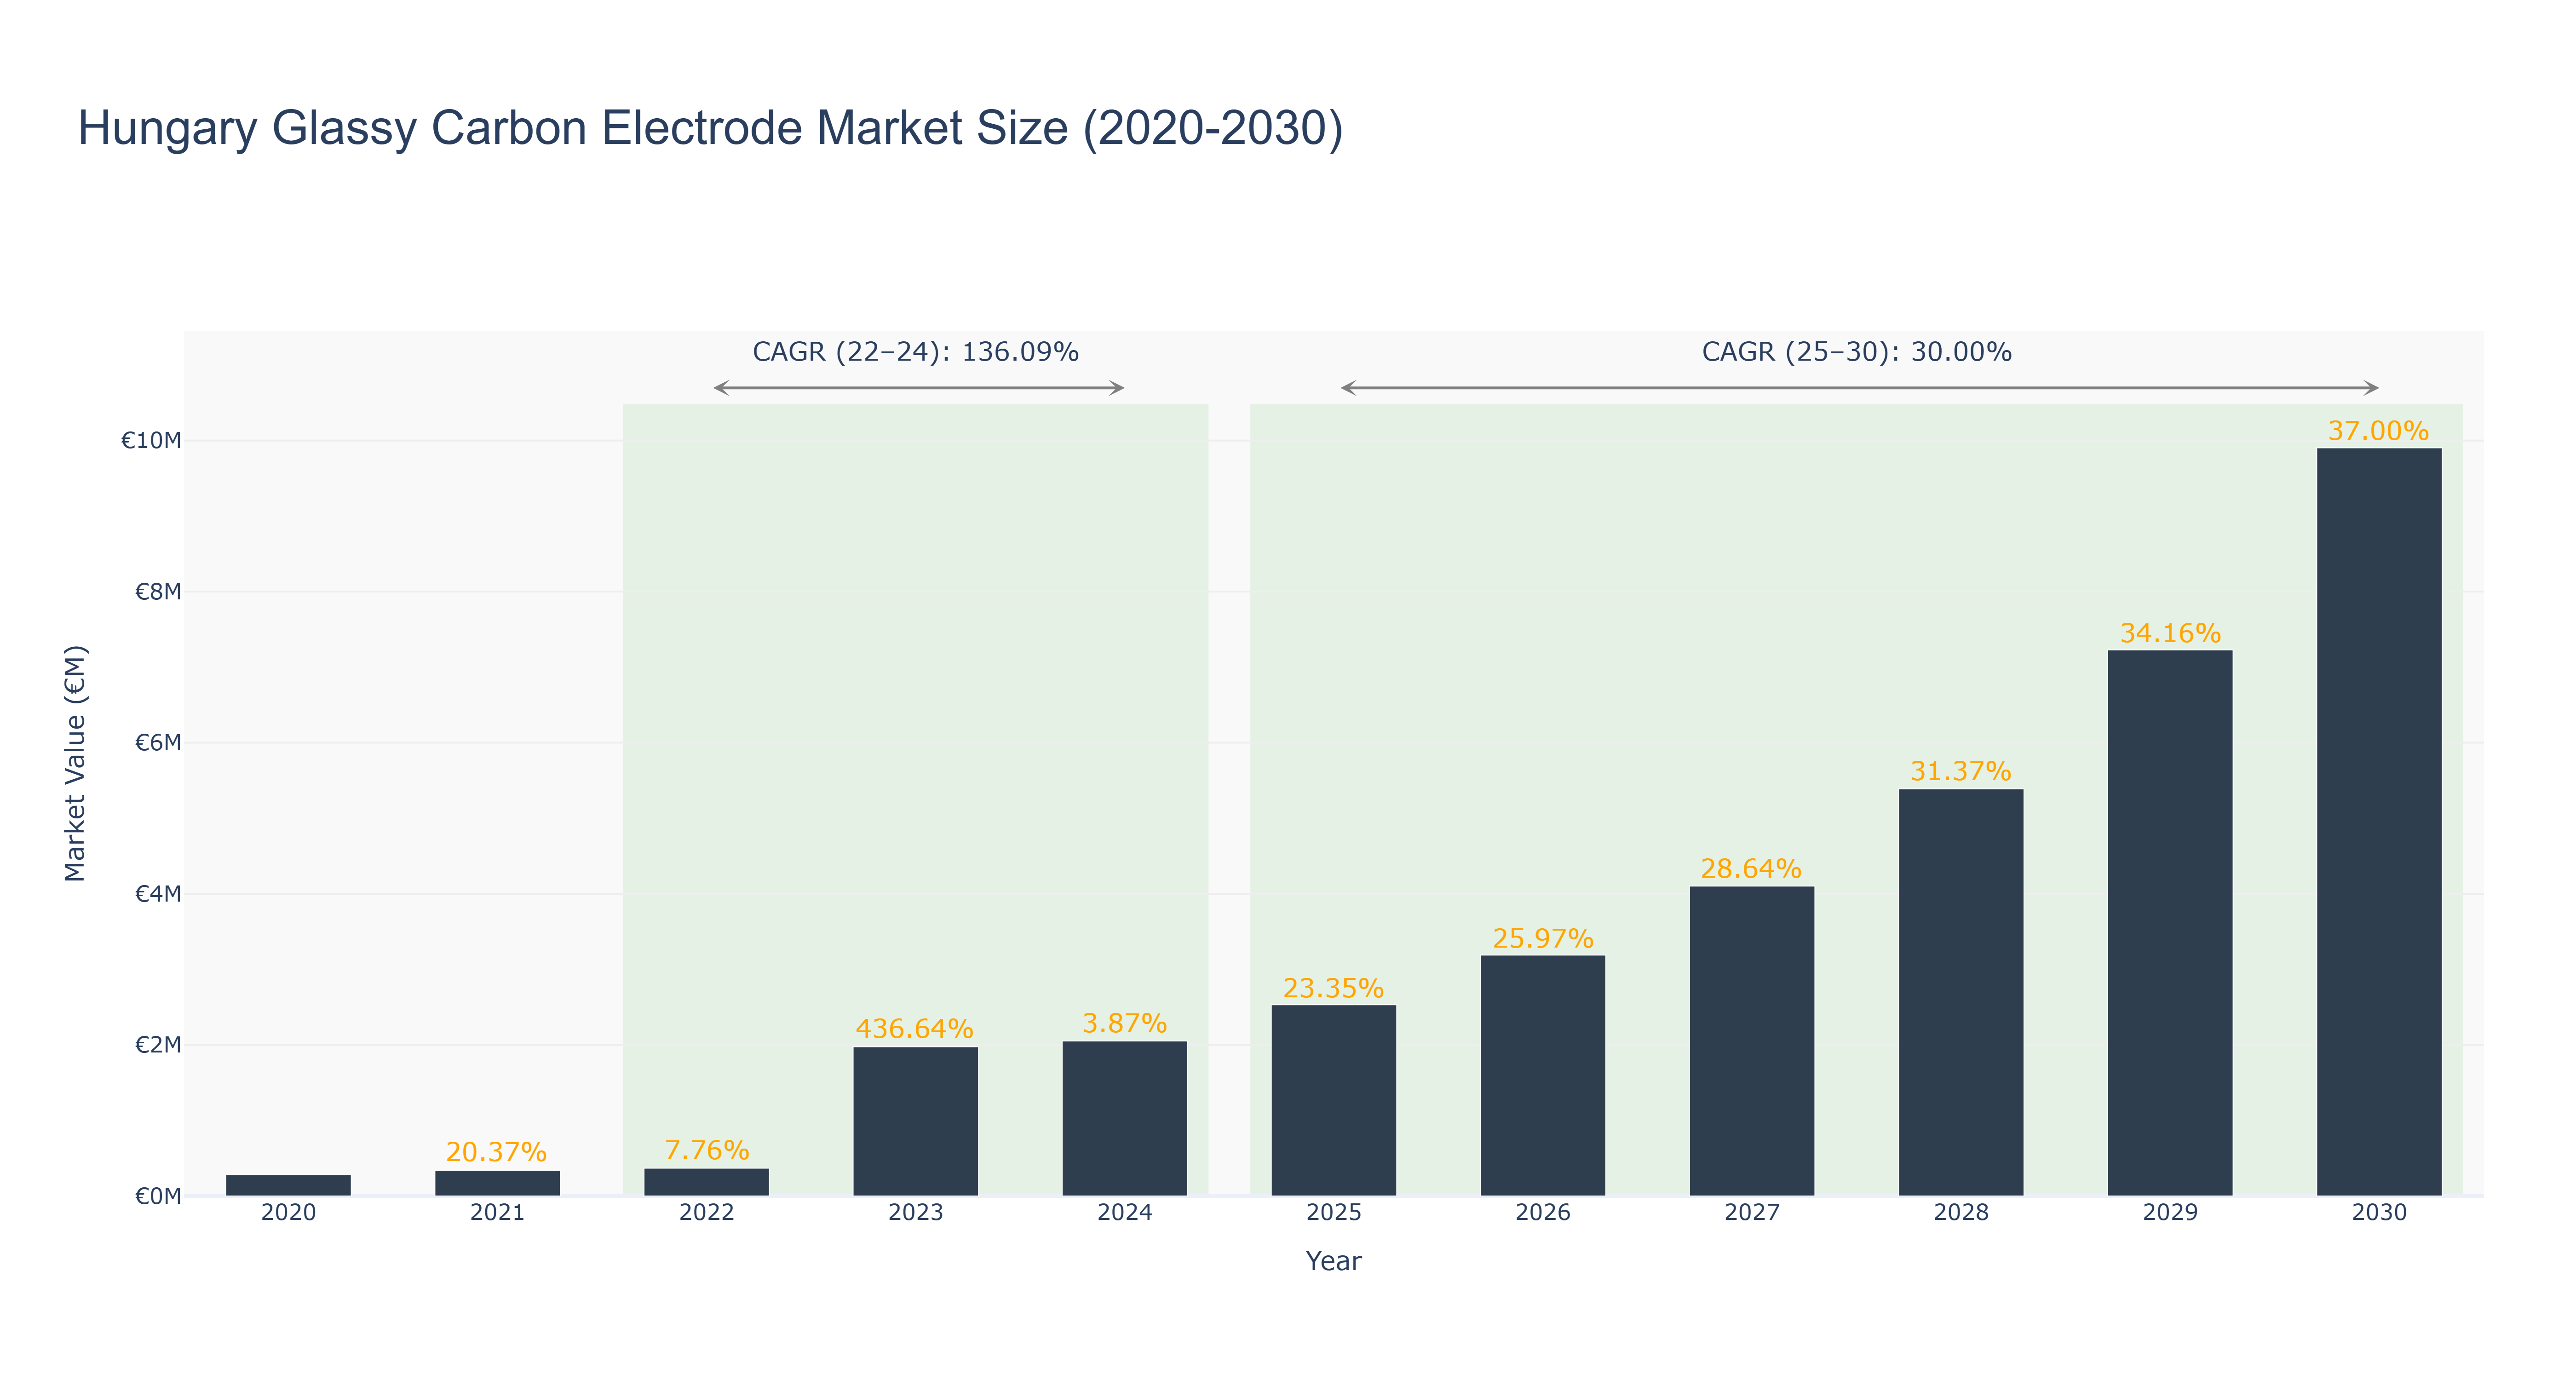
Hungary Glassy Carbon Electrode Market has shown remarkable growth over the years. The peak market size was €9.90 million in 2030, with a significant increase from €0.28 million in 2020. The actual market size saw steady growth from 2020 to 2024, with a notable spike in 2023 due to a CAGR of 436.64%. Forecasted market size from 2025 to 2030 is expected to maintain a strong upward trajectory, supported by a CAGR of 30.0%. The market's growth can be attributed to increasing demand for glassy carbon electrodes in various industries such as pharmaceuticals and electronics. Looking ahead, Hungary is set to invest in advanced manufacturing technologies to further boost the glassy carbon electrode market, enhancing its position in the global market.
Hungary Glassy Carbon Electrode Market: Production & Trade Performance (2019-2025)
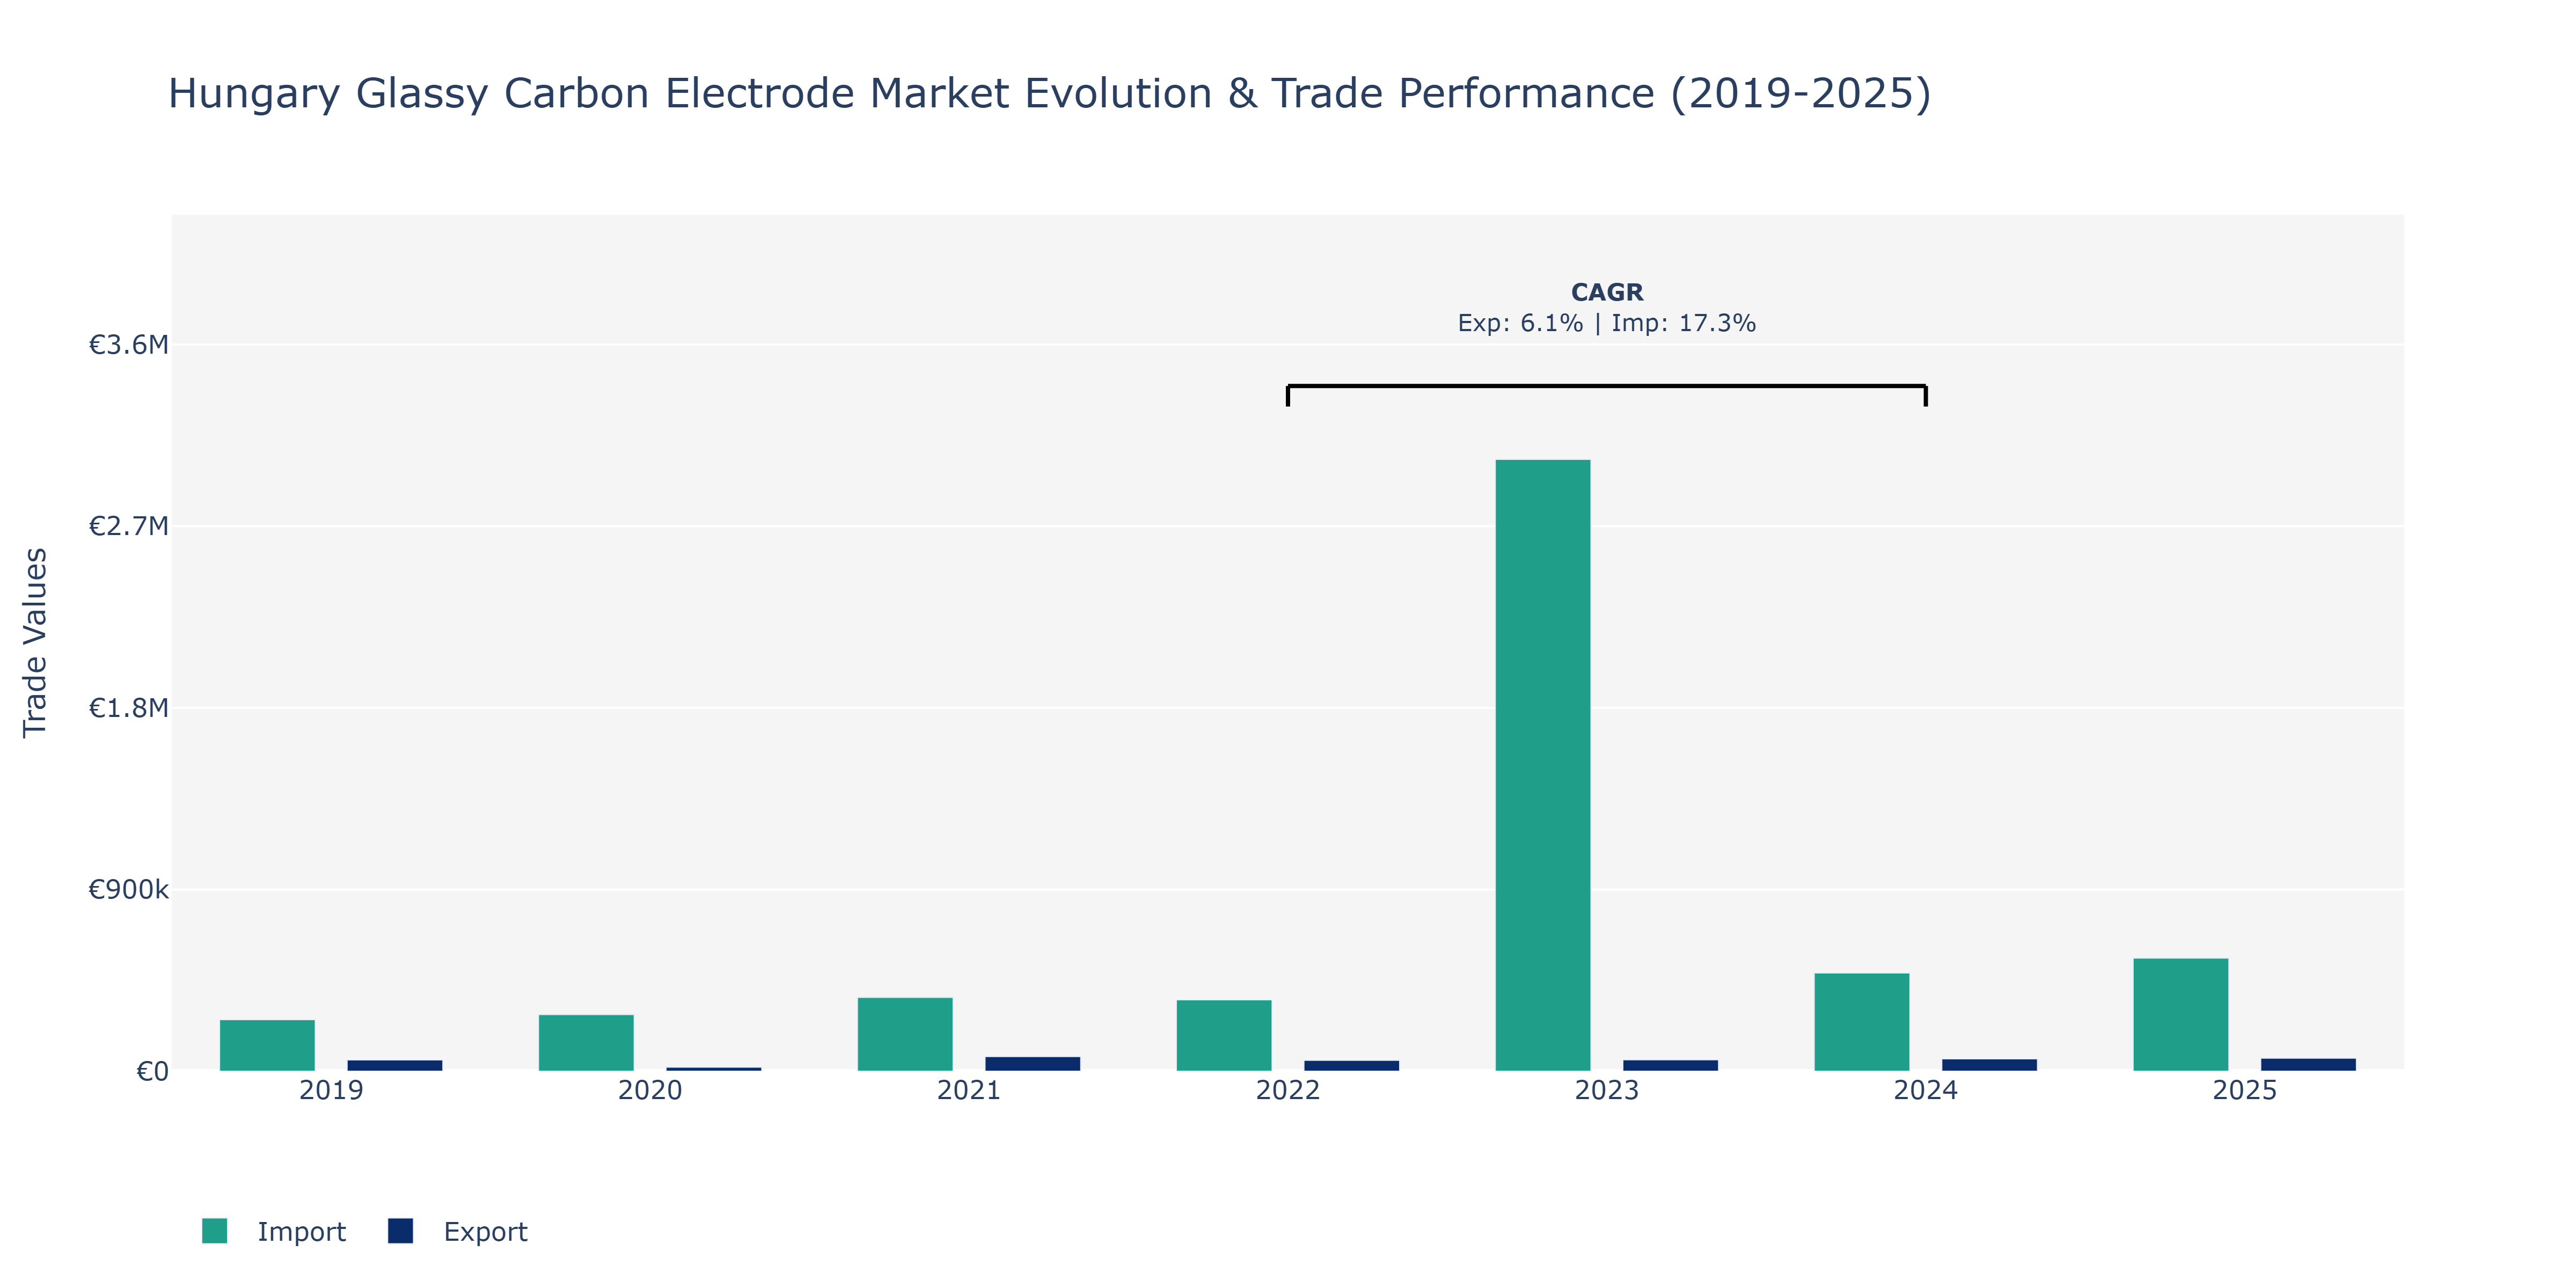
In the Hungary Glassy Carbon Electrode Market, exports experienced fluctuations over the years, with a notable decline from €56.05 thousand in 2019 to €19.67 thousand in 2020 before rebounding sharply to €72.52 thousand in 2021. The exports then decreased to €54.1 thousand in 2022, followed by a slight increase to €56.28 thousand in 2023 and €60.9 thousand in 2024. Conversely, imports showed consistent growth, rising from €255.44 thousand in 2019 to €365.52 thousand in 2021 before reaching €486.5 thousand in 2024. A significant peak in imports was observed in 2023, amounting to €3.03 million. These fluctuations can be attributed to various factors such as changes in demand, global market conditions, and trade agreements affecting the glassy carbon electrode industry. The increase in imports could be due to rising demand for raw materials or technological advancements requiring specialized imports. Conversely, fluctuations in exports may be influenced by changes in production capacities or shifts in global demand.
Key Highlights of the Report:
- Hungary Glassy Carbon Electrode Market Outlook
- Market Size of Hungary Glassy Carbon Electrode Market, 2025
- Forecast of Hungary Glassy Carbon Electrode Market, 2032
- Historical Data and Forecast of Hungary Glassy Carbon Electrode Revenues & Volume for the Period 2022-2032F
- Hungary Glassy Carbon Electrode Market Trend Evolution
- Hungary Glassy Carbon Electrode Market Drivers and Challenges
- Hungary Glassy Carbon Electrode Price Trends
- Hungary Glassy Carbon Electrode Porter's Five Forces
- Hungary Glassy Carbon Electrode Industry Life Cycle
- Historical Data and Forecast of Hungary Glassy Carbon Electrode Market Revenues & Volume By Size for the Period 2022-2032F
- Historical Data and Forecast of Hungary Glassy Carbon Electrode Market Revenues & Volume By Below 3mm for the Period 2022-2032F
- Historical Data and Forecast of Hungary Glassy Carbon Electrode Market Revenues & Volume By Above 3mm for the Period 2022-2032F
- Historical Data and Forecast of Hungary Glassy Carbon Electrode Market Revenues & Volume By Application for the Period 2022-2032F
- Historical Data and Forecast of Hungary Glassy Carbon Electrode Market Revenues & Volume By Chemically Modified Electrode for the Period 2022-2032F
- Historical Data and Forecast of Hungary Glassy Carbon Electrode Market Revenues & Volume By Anodic Solution for the Period 2022-2032F
- Historical Data and Forecast of Hungary Glassy Carbon Electrode Market Revenues & Volume By Working Electrode for the Period 2022-2032F
- Historical Data and Forecast of Hungary Glassy Carbon Electrode Market Revenues & Volume By Others for the Period 2022-2032F
- Hungary Glassy Carbon Electrode Import Export Trade Statistics
- Market Opportunity Assessment By Size
- Market Opportunity Assessment By Application
- Hungary Glassy Carbon Electrode Top Companies Market Share
- Hungary Glassy Carbon Electrode Competitive Benchmarking By Technical and Operational Parameters
- Hungary Glassy Carbon Electrode Company Profiles
- Hungary Glassy Carbon Electrode Key Strategic Recommendations
Frequently Asked Questions About the Market Study (FAQs):
6Wresearch actively monitors the Hungary Glassy Carbon Electrode Market and publishes its comprehensive annual report, highlighting emerging trends, growth drivers, revenue analysis, and forecast outlook. Our insights help businesses to make data-backed strategic decisions with ongoing market dynamics. Our analysts track relevent industries related to the Hungary Glassy Carbon Electrode Market, allowing our clients with actionable intelligence and reliable forecasts tailored to emerging regional needs.
Yes, we provide customisation as per your requirements. To learn more, feel free to contact us on sales@6wresearch.com
1 Executive Summary |
2 Introduction |
2.1 Key Highlights of the Report |
2.2 Report Description |
2.3 Market Scope & Segmentation |
2.4 Research Methodology |
2.5 Assumptions |
3 Hungary Glassy Carbon Electrode Market Overview |
3.1 Hungary Country Macro Economic Indicators |
3.2 Hungary Glassy Carbon Electrode Market Revenues & Volume, 2022 & 2032F |
3.3 Hungary Glassy Carbon Electrode Market - Industry Life Cycle |
3.4 Hungary Glassy Carbon Electrode Market - Porter's Five Forces |
3.5 Hungary Glassy Carbon Electrode Market Revenues & Volume Share, By Size, 2022 & 2032F |
3.6 Hungary Glassy Carbon Electrode Market Revenues & Volume Share, By Application, 2022 & 2032F |
4 Hungary Glassy Carbon Electrode Market Dynamics |
4.1 Impact Analysis |
4.2 Market Drivers |
4.2.1 Growing demand for glassy carbon electrodes in research and development activities in industries such as pharmaceuticals, chemicals, and environmental monitoring. |
4.2.2 Increasing adoption of glassy carbon electrodes in electrochemical sensing applications due to their high sensitivity and stability. |
4.3 Market Restraints |
4.3.1 High manufacturing costs associated with glassy carbon electrodes, limiting their affordability for smaller research facilities and academic institutions. |
4.3.2 Competition from alternative electrode materials such as platinum and gold, which offer similar performance characteristics at lower costs. |
5 Hungary Glassy Carbon Electrode Market Trends |
6 Hungary Glassy Carbon Electrode Market, By Types |
6.1 Hungary Glassy Carbon Electrode Market, By Size |
6.1.1 Overview and Analysis |
6.1.2 Hungary Glassy Carbon Electrode Market Revenues & Volume, By Size, 2022 - 2032F |
6.1.3 Hungary Glassy Carbon Electrode Market Revenues & Volume, By Below 3mm, 2022 - 2032F |
6.1.4 Hungary Glassy Carbon Electrode Market Revenues & Volume, By Above 3mm, 2022 - 2032F |
6.2 Hungary Glassy Carbon Electrode Market, By Application |
6.2.1 Overview and Analysis |
6.2.2 Hungary Glassy Carbon Electrode Market Revenues & Volume, By Chemically Modified Electrode, 2022 - 2032F |
6.2.3 Hungary Glassy Carbon Electrode Market Revenues & Volume, By Anodic Solution, 2022 - 2032F |
6.2.4 Hungary Glassy Carbon Electrode Market Revenues & Volume, By Working Electrode, 2022 - 2032F |
6.2.5 Hungary Glassy Carbon Electrode Market Revenues & Volume, By Others, 2022 - 2032F |
7 Hungary Glassy Carbon Electrode Market Import-Export Trade Statistics |
7.1 Hungary Glassy Carbon Electrode Market Export to Major Countries |
7.2 Hungary Glassy Carbon Electrode Market Imports from Major Countries |
8 Hungary Glassy Carbon Electrode Market Key Performance Indicators |
8.1 Research and development investment in electrochemical technologies in Hungary. |
8.2 Number of patents filed related to glassy carbon electrode applications. |
8.3 Adoption rate of glassy carbon electrodes in new industries and applications. |
8.4 Number of research publications citing the use of glassy carbon electrodes in Hungary. |
9 Hungary Glassy Carbon Electrode Market - Opportunity Assessment |
9.1 Hungary Glassy Carbon Electrode Market Opportunity Assessment, By Size, 2022 & 2032F |
9.2 Hungary Glassy Carbon Electrode Market Opportunity Assessment, By Application, 2022 & 2032F |
10 Hungary Glassy Carbon Electrode Market - Competitive Landscape |
10.1 Hungary Glassy Carbon Electrode Market Revenue Share, By Companies, 2025 |
10.2 Hungary Glassy Carbon Electrode Market Competitive Benchmarking, By Operating and Technical Parameters |
11 Company Profiles |
12 Recommendations |
13 Disclaimer |
Global Go To Market Strategy - 2030
Export potential enables firms to identify high-growth global markets with greater confidence by combining advanced trade intelligence with a structured quantitative methodology. The framework analyzes emerging demand trends and country-level import patterns while integrating macroeconomic and trade datasets such as GDP and population forecasts, bilateral import–export flows, tariff structures, elasticity differentials between developed and developing economies, geographic distance, and import demand projections. Using weighted trade values from 2020–2024 as the base period to project country-to-country export potential for 2030, these inputs are operationalized through calculated drivers such as gravity model parameters, tariff impact factors, and projected GDP per-capita growth. Through an analysis of hidden potentials, demand hotspots, and market conditions that are most favorable to success, this method enables firms to focus on target countries, maximize returns, and global expansion with data, backed by accuracy.
By factoring in the projected importer demand gap that is currently unmet and could be potential opportunity, it identifies the potential for the Exporter (Country) among 190 countries, against the general trade analysis, which identifies the biggest importer or exporter.
To discover high-growth global markets and optimize your business strategy:
Click Here
Pricing
- Single User License$ 1,995
- Department License$ 2,400
- Site License$ 3,120
- Global License$ 3,795

Leadership Perspectives from Industry Events
Search
Thought Leadership and Analyst Meet


Our Clients
6WResearch In News
- India Export Attractiveness Tracker 2026
- India Air Conditioner Market Set for Strong Rebound in 2026 After Weather-Led Correction and GST-Driven Recovery: 6Wresearch
- ADAS in India: How Automatic Emergency Braking, Blind Spot Detection & Driver Monitoring are Transforming Road Safety
- Doha a strategic location for EV manufacturing hub: IPA Qatar
- Demand for luxury TVs surging in the GCC, says Samsung
- Empowering Growth: The Thriving Journey of Bangladesh’s Cable Industry
Latest Reports
- Nicaragua RPG Gaming Market (2026-2032)
- New Zealand RPG Gaming Market (2026-2032)
- Netherlands RPG Gaming Market (2026-2032)
- Nauru RPG Gaming Market (2026-2032)
- Namibia RPG Gaming Market (2026-2032)
- Mozambique RPG Gaming Market (2026-2032)
- Montenegro RPG Gaming Market (2026-2032)
- Mongolia RPG Gaming Market (2026-2032)
- Monaco RPG Gaming Market (2026-2032)
- Micronesia RPG Gaming Market (2026-2032)
Industry Events and Analyst Meet

EV India Expo 2026

HIMTEX 2026

India Refining Summit 2026

India EV Show 2026

EV tech India Expo 2026
Whitepaper
- Middle East & Africa Commercial Security Market Click here to view more.
- Middle East & Africa Fire Safety Systems & Equipment Market Click here to view more.
- GCC Drone Market Click here to view more.
- Middle East Lighting Fixture Market Click here to view more.
- GCC Physical & Perimeter Security Market Click here to view more.