India Smart Energy Services Market Size & Growth Rate
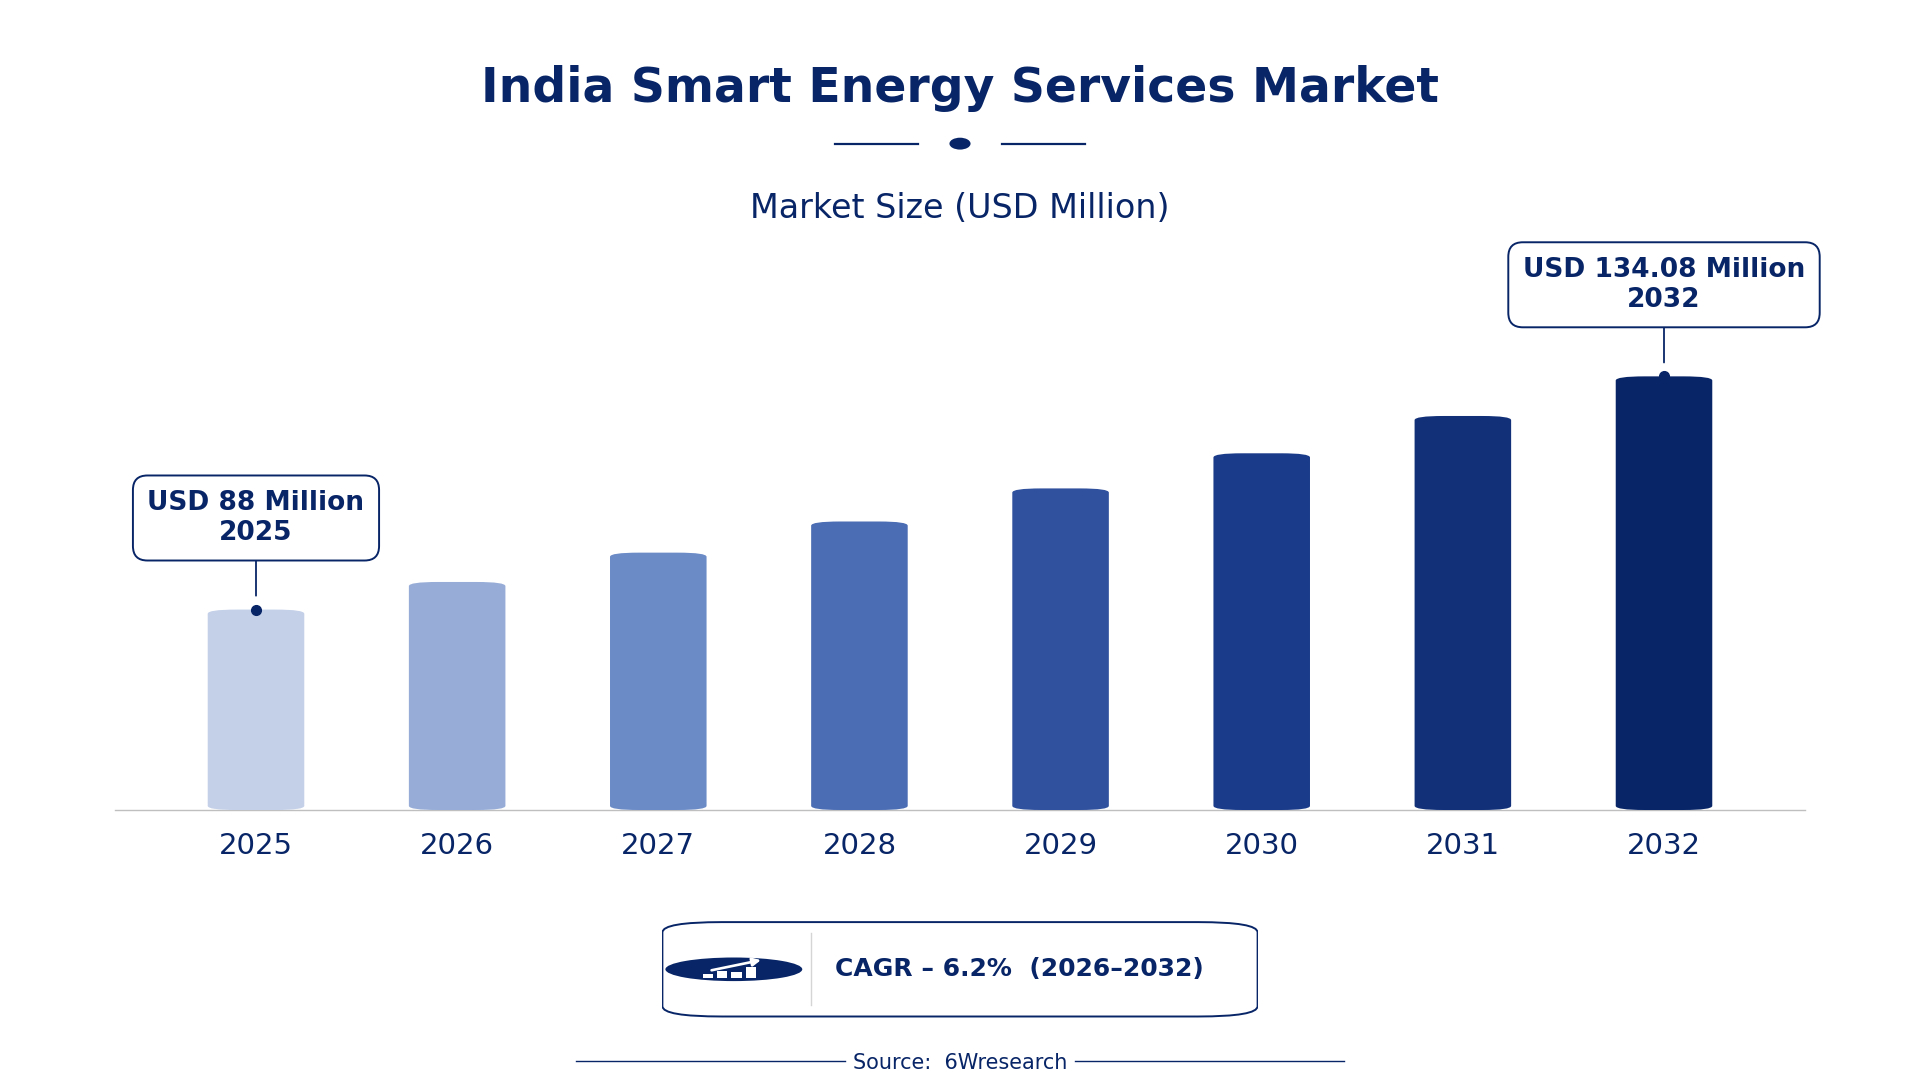
According to 6Wresearch internal database and industry insights, the India Smart Energy Services Market was valued at USD 88.0 million in 2025 and is projected to reach USD 134.08 million by 2032, growing at a CAGR of approximately 6.2% during 2026–2032.
India Smart Energy Services Market Highlights
| Report Metric | Details |
| Report Name | India Smart Energy Services Market |
| Market Size 2025 | USD 88.0 million |
| Market Size 2032 | USD 134.08 million |
| Absolute Growth 2025–2032 | USD 46.08 million |
| CAGR 2026–2032 | 6.2% |
| Peak Annual Growth | 8.5% in 2030 |
| Forecast Period | 2026–2032 |
| Historical Data | 2022–2025 |
| Base Year | 2025 |
| Leading Service Type, 2025 | Demand Response Systems (42% share) |
| Leading Smart Feature, 2025 | Real-Time Insights (52% share) |
| Leading Delivery Model, 2025 | Cloud-Based Platform (43% share) |
| Leading End User, 2025 | Utilities (36% share) |
| Fastest-Growing Service Type | Energy Usage Analytics (9.0% CAGR) |
| Fastest-Growing Smart Feature | Automated Load Shifting (8.8% CAGR) |
| Fastest-Growing Delivery Model | SaaS (8.8% CAGR) |
| Fastest-Growing End User | Energy Retailers (8.1% CAGR) |
| Growing Sector | Utilities |
| Key End Users | Utilities, Energy Retailers, Industrial Energy Managers, Smart Building Owners |
India Smart Energy Services Market Year-wise Growth Rate and Key Drivers (2022–2032)
This graph illustrates the annual growth rates of the market from 2022 to 2032, highlighting a steady upward trajectory and projected market expansion over the forecast period.
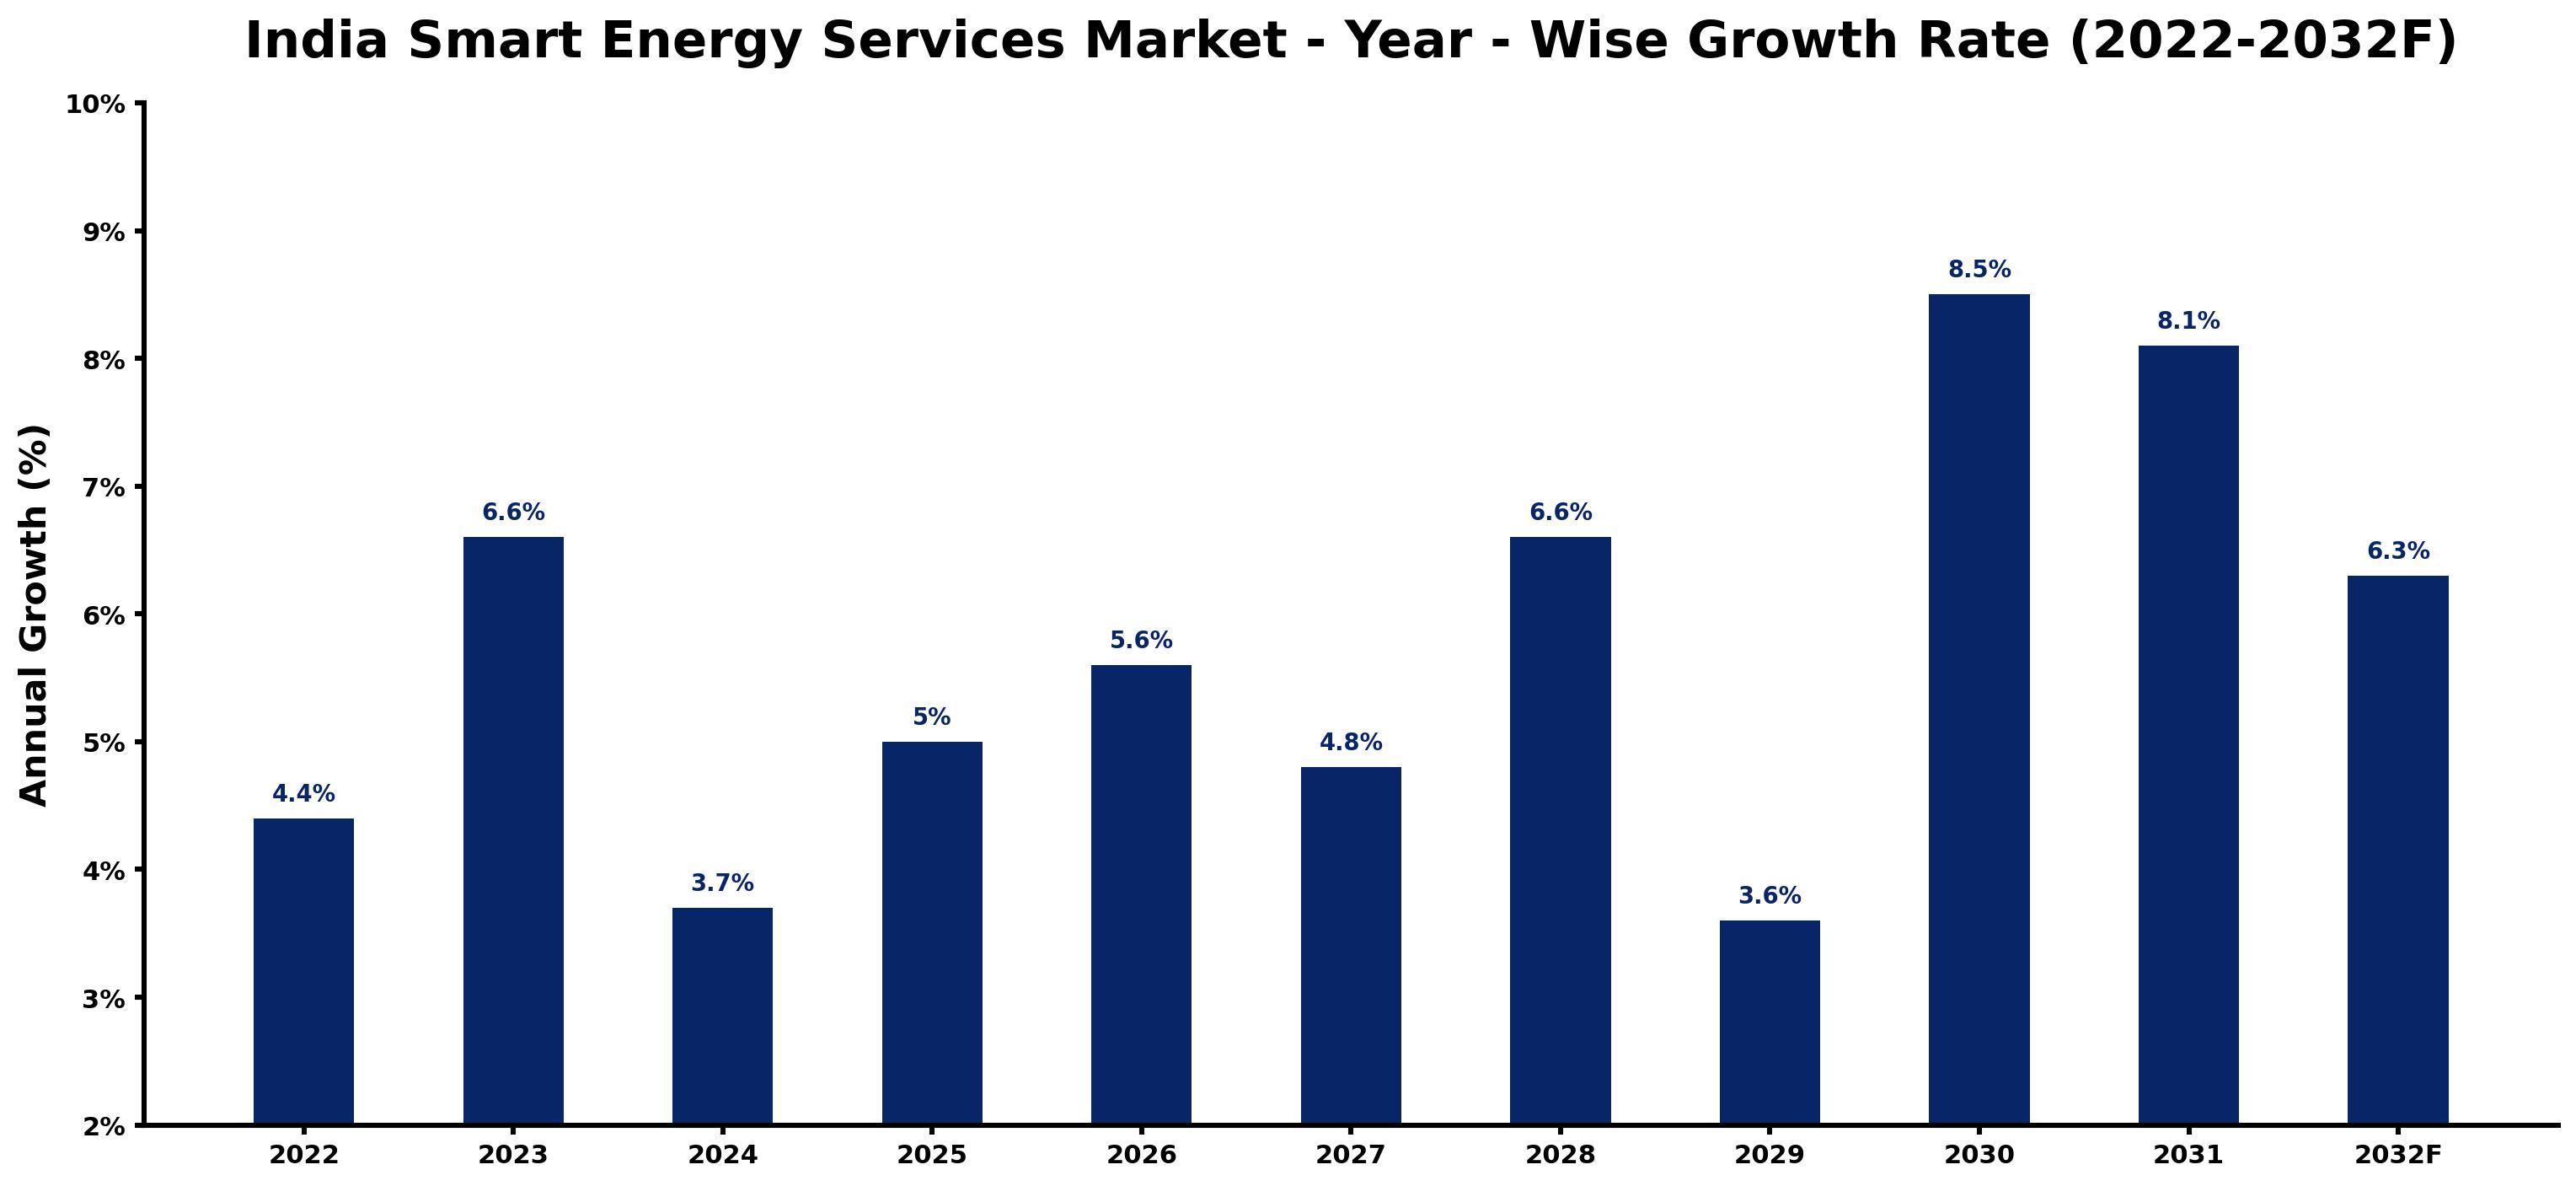
The table below sets out the estimated growth rate for each year and the main factor behind it.
| Year | Estimated Annual Growth (%) | Market Rationale |
| 2022 | 4.4 | The market experienced steady growth due to urbanisation and the Smart Cities Mission promoting energy efficiency. |
| 2023 | 6.6 | Demand surged as smart billing solutions were adopted by over 50% of urban utilities. |
| 2024 | 3.7 | Growth slowed as utilities adjusted to the previous year's rapid expansion of services. |
| 2025 | 5.0 | Increased adoption of energy usage analytics among smart buildings contributed to growth this year. |
| 2026 | 5.6 | Investment in demand response systems among utilities is expected to support continued market growth. |
| 2027 | 4.8 | The market will see a slowdown as utilities face challenges in implementing new technologies effectively. |
| 2028 | 6.6 | Growth is projected to pick up again as automated load shifting technologies gain traction among users. |
| 2029 | 3.6 | The market is expected to slow again as utilities focus on stabilising their existing systems and technologies. |
| 2030 | 8.5 | A peak in growth is anticipated with the increasing adoption of dynamic tariff calculations among utilities. |
| 2031 | 8.1 | Growth is expected to slow slightly as the market stabilises after rapid expansion in previous years. |
| 2032 | 6.3 | The market will continue to grow, driven by ongoing investments in energy efficiency initiatives. |
Note: Market size estimations and growth projections presented in this report are based on 6Wresearch's proprietary forecasting methodology, utilizing the latest available industry data, government publications, and primary research inputs.
India Smart Energy Services Market Synopsis
Smart Energy Services in India encompass technology-driven solutions aimed at optimising energy consumption and improving efficiency. These services utilise data analytics, IoT, and AI, primarily serving commercial and industrial sectors. This focus on sustainability and cost reduction is propelling demand for these services.
Market Dynamics Impact Analysis (2026–2032)
| Factor | Type | Impact | Primary Segment Affected |
| Increasing urbanisation drives demand for energy-efficient solutions in commercial sectors. | Driver | High | Energy Usage Analytics |
| Government initiatives are promoting the adoption of smart energy technologies. | Driver | High | Demand Response Systems |
| The growing need for energy efficiency creates opportunities for new service providers. | Opportunity | High | Smart Billing Solutions |
| Investment in automated load shifting technologies presents a significant market entry point. | Opportunity | High | Automated Load Shifting |
| High initial costs deter some potential adopters from investing in smart services. | Restraint | High | Smart Billing Solutions |
| Limited awareness of smart energy services restricts market penetration in rural areas. | Restraint | Medium | Remote Energy Audits |
| Regulatory hurdles can delay the implementation of smart energy projects. | Challenge | High | Demand Response Systems |
| Supply chain disruptions affect the availability of smart energy technologies. | Challenge | Medium | Energy Usage Analytics |
Evaluation of Drivers in India Smart Energy Services Market (2026–2032)
The main growth drivers and the segments they affect most are set out below.
| Drivers | Primary Segment Affected | Why It Matters (Evidence) |
| Investment in smart energy technologies is increasing as urban utilities modernise their systems. | Demand Response Systems | Over 50% of urban utilities are adopting smart billing solutions as part of their upgrades. |
| The push for sustainability is driving demand for real-time energy management solutions. | Energy Usage Analytics | More than 1,000 smart buildings are utilising energy usage analytics for optimisation. |
| Government initiatives are facilitating the adoption of smart energy services in urban areas. | Smart Billing Solutions | The Smart Cities Mission allocates funds for implementing smart energy services in 100 cities. |
| Technological advancements in AI and IoT are improving the capabilities of smart energy services. | Automated Load Shifting | Energy retailers are investing in platforms for better customer engagement. |
| The need for dynamic tariff calculations is rising as utilities manage demand effectively. | Dynamic Tariff Calculation | Dynamic tariff calculations are increasingly used by utilities to manage demand response. |
The Smart Energy Services market in India is expanding as investment in smart energy technologies rises, with urban utilities modernising their systems. Demand for real-time energy management solutions is increasing, supported by over 1,000 smart buildings utilising energy usage analytics for optimisation. Energy retailers are investing in platforms to improve service delivery, which is expected to drive market growth further. The rising need for dynamic tariff calculations among utilities is also contributing to this upward trend.
Evaluation of Restraints in India Smart Energy Services Market
The main factors holding the market back are set out below.
| Market Restraint | Primary Segment Affected | Why It Matters (Evidence) |
| High initial costs deter some potential adopters from investing in smart services. | Smart Billing Solutions | The implementation of smart billing solutions requires substantial upfront investments, limiting adoption. |
| Limited awareness of smart energy services restricts market penetration in rural areas. | Remote Energy Audits | Many rural users are unaware of the benefits of remote energy audits, hindering growth. |
| Regulatory hurdles can delay the implementation of smart energy projects. | Demand Response Systems | Complex approval processes slow down the deployment of demand response systems among utilities. |
| Supply chain disruptions affect the availability of smart energy technologies. | Energy Usage Analytics | Recent global supply chain issues have led to delays in technology availability for analytics. |
| Competition among service providers can lead to price wars, affecting profitability. | Automated Load Shifting | Increased competition may drive down prices, impacting the financial viability of providers. |
India Smart Energy Services Market Challenges
The India Smart Energy Services Market faces regulatory hurdles that delay project approvals, leading to potential setbacks of up to six months for producers. These delays can strain cash flow for suppliers, forcing them to manage financial challenges. A shortage of skilled workers hampers the implementation of advanced energy technologies, resulting in inefficiencies for buyers who require effective solutions. Supply chain disruptions for critical components can inflate project costs by 15%, compelling buyers to absorb these increased expenses and limiting their investment options.
Trends in the India Smart Energy Services Market
Several trends are reshaping the India Smart Energy Services Market; the most important are set out below.
- Shift from Traditional to Smart Billing Solutions: Since 2023, urban utilities have increasingly adopted smart billing solutions, with over 50% of them modernising their systems. This shift improves customer engagement and operational efficiency, making it essential for energy retailers.
- Transition to Real-Time Energy Management: The rise of smart buildings in India has led to a significant increase in real-time energy management solutions. As of 2023, over 1,000 buildings are utilising energy usage analytics, improving sustainability efforts.
- Emergence of Dynamic Tariff Calculations: Dynamic tariff calculations are becoming more prevalent among utilities, with their usage increasing significantly in recent years. This trend helps manage demand response effectively and optimises energy costs for consumers.
- Growing Adoption of Automated Load Shifting: Automated load shifting technologies have gained traction in India, with over 300 energy retailers implementing these solutions. This trend is important for managing peak demand and improving grid stability.
Investment Opportunities in the India Smart Energy Services Market
The following opportunities in the India Smart Energy Services Market pair current demand with a clear way in.
- Partnerships with Local Utilities: Now is the time to establish partnerships with local utilities, as they seek to modernise their systems. With over 50% of urban utilities adopting smart billing solutions, collaboration can improve service delivery.
- Investment in Energy Efficiency Projects: The market gap for energy efficiency projects is significant, with the Indian government targeting 175 GW of renewable energy capacity by 2022. Investors can capitalise on this by supporting energy efficiency initiatives in urban areas.
- Entry into Smart Cities Mission: The Smart Cities Mission presents a timely opportunity for investment in smart energy services. With funds allocated for implementation in 100 cities, suppliers can engage in various projects.
- Focus on SaaS Platforms: The growing demand for SaaS platforms in energy management is evident, with energy retailers increasingly investing in these technologies. Suppliers can enter this market by forming joint ventures with local providers.
Government Initiatives in the India Smart Energy Services Market
The Energy Conservation Building Code (ECBC), updated by the Bureau of Energy Efficiency in 2021, mandates energy efficiency measures for new commercial buildings in India. This regulation ensures that smart energy services are integrated into building designs, promoting sustainability. Additionally, the National Smart Grid Mission, launched in 2020 by the Ministry of Power, aims to enhance the efficiency and reliability of the electricity grid through smart technologies. This initiative is crucial for the deployment of smart energy services across the country, supporting the transition to a modern energy infrastructure.
Urban utilities are leveraging the Smart Cities Mission, initiated in 2020, to implement smart energy services in 100 cities, improving energy efficiency and management. The Energy Efficiency Financing Platform (EEFP), established in 2021, facilitates funding for energy efficiency projects, enabling various sectors to adopt advanced technologies. This platform supports initiatives that enhance energy management and reduce costs for buyers. Furthermore, the Ministry of Power's 2022 initiative promotes the adoption of demand response systems, helping utilities manage peak loads effectively.
Future Insight of the India Smart Energy Services Market
The India Smart Energy Services Market will undergo significant changes by 2032, driven by the National Smart Grid Mission and the Smart Cities Mission which will modernise infrastructure. Adoption of smart billing solutions among urban utilities is expected to surpass 60%, enhancing service delivery. Increased investment in energy efficiency projects, facilitated by the Energy Efficiency Financing Platform, will provide broader access to innovative technologies. The Indian government's target of 175 GW of renewable energy capacity will create new opportunities for suppliers and buyers, energising market dynamics.
Market Segmentation Analysis
The report offers a comprehensive study of the following market segments and their leading categories in the market.
By Service Type – Demand Response Systems Dominated, Energy Usage Analytics Expected to Grow Fastest
According to Dhaval Chaurasia, Assistant Manager at 6Wresearch, in 2025, Demand Response Systems led the service type split with a 42% share. Demand Response Systems hold the largest share as they are critical for managing peak loads, ensuring grid stability during high demand periods. This is especially important in urban areas where energy consumption can vary significantly, necessitating effective solutions. Energy Usage Analytics is projected to grow fastest, at a CAGR of 9.0% during 2026–2032. Energy Usage Analytics is experiencing rapid growth, with over 1,000 smart buildings in India adopting these analytics for optimisation, underscoring a strong trend towards data-driven energy management. This momentum will likely continue as the push for energy efficiency intensifies. Suppliers should concentrate on developing advanced analytics solutions to cater to the increasing demand for energy optimisation.
By Smart Feature – Real-Time Insights Dominated, Automated Load Shifting Expected to Grow Fastest
With a 52% revenue share in 2025, Real-Time Insights was the largest smart feature category. Real-Time Insights dominate the market share because they are essential for immediate decision-making in energy management, enabling users to quickly adapt to changes in consumption patterns. This feature is particularly vital for sectors focused on energy efficiency to minimise costs and enhance sustainability. The quickest growth will come from Automated Load Shifting, forecast to expand at a CAGR of 8.8% between 2026 and 2032. Automated Load Shifting is the fastest-growing feature, with over 300 energy retailers adopting these technologies to manage peak demand effectively. This trend indicates a rising focus on energy efficiency measures among retailers, which is expected to continue expanding. Buyers will benefit from investing in automated solutions that enhance energy management capabilities during peak usage periods.
By Delivery Model – Cloud-Based Platform Dominated, SaaS Expected to Grow Fastest
Cloud-Based Platform took a 43% share of delivery model in 2025, more than any other category. Cloud-Based Platforms lead the market share by providing scalable and flexible energy solutions, appealing to a diverse range of users in commercial and industrial sectors. Their ability to adapt to varying energy needs is particularly attractive in urban settings where demand can fluctuate unpredictably. SaaS are set to record the highest CAGR in this split, 8.8% over 2026–2032. SaaS is the fastest-growing delivery model, as energy retailers increasingly invest in these platforms to improve customer engagement and service delivery. This shift towards SaaS reflects a broader trend of digital transformation within the energy sector. Suppliers should prioritise the development of SaaS offerings to meet the rising demand for accessible energy management tools.
By End User – Utilities Dominated, Energy Retailers Expected to Grow Fastest
The largest end user category in 2025 was Utilities, with a 36% share of total revenue. Utilities represent the largest share in the market as they are key players in implementing energy management systems, directly impacting energy efficiency initiatives across various regions. Their established infrastructure and regulatory support make them essential in the smart energy services sector. Over 2026–2032, Energy Retailers are expected to post the fastest growth, at a CAGR of 8.1%. Energy Retailers are the fastest-growing end user group, leveraging smart services to enhance customer management and service delivery. Their increasing investment in smart energy solutions highlights a strategic shift towards improving customer engagement and operational efficiency. Suppliers should tailor their offerings to address the specific needs of energy retailers, who are rapidly adopting smart technologies.
Key Attractiveness of the Report
- 10 Years of Market Numbers
- Historical Data Starting from 2022 to 2025
- Base Year 2025
- Forecast Data until 2032
- Key Performance Indicators Impacting the Market
- Major Upcoming Developments and Projects
Key Highlights of the Report:
- India Smart Energy Services Market Outlook
- Market Size of India Smart Energy Services Market, 2025
- Forecast of India Smart Energy Services Market, 2032
- Historical Data and Forecast of India Smart Energy Services Revenues & Volume for the Period 2022 - 2032F
- India Smart Energy Services Market Trend Evolution
- India Smart Energy Services Market Drivers and Challenges
- India Smart Energy Services Price Trends
- India Smart Energy Services Porter's Five Forces
- India Smart Energy Services Industry Life Cycle
- Historical Data and Forecast of India Smart Energy Services Market Revenues & Volume By Service Type for the Period 2022 - 2032F
- Historical Data and Forecast of India Smart Energy Services Market Revenues & Volume By Energy Usage Analytics for the Period 2022 - 2032F
- Historical Data and Forecast of India Smart Energy Services Market Revenues & Volume By Demand Response Systems for the Period 2022 - 2032F
- Historical Data and Forecast of India Smart Energy Services Market Revenues & Volume By Smart Billing Solutions for the Period 2022 - 2032F
- Historical Data and Forecast of India Smart Energy Services Market Revenues & Volume By Remote Energy Audits for the Period 2022 - 2032F
- Historical Data and Forecast of India Smart Energy Services Market Revenues & Volume By Smart Feature for the Period 2022 - 2032F
- Historical Data and Forecast of India Smart Energy Services Market Revenues & Volume By Real-Time Insights for the Period 2022 - 2032F
- Historical Data and Forecast of India Smart Energy Services Market Revenues & Volume By Automated Load Shifting for the Period 2022 - 2032F
- Historical Data and Forecast of India Smart Energy Services Market Revenues & Volume By Dynamic Tariff Calculation for the Period 2022 - 2032F
- Historical Data and Forecast of India Smart Energy Services Market Revenues & Volume By AI-Based Inspection for the Period 2022 - 2032F
- Historical Data and Forecast of India Smart Energy Services Market Revenues & Volume By Delivery Model for the Period 2022 - 2032F
- Historical Data and Forecast of India Smart Energy Services Market Revenues & Volume By SaaS for the Period 2022 - 2032F
- Historical Data and Forecast of India Smart Energy Services Market Revenues & Volume By Cloud-Based Platform for the Period 2022 - 2032F
- Historical Data and Forecast of India Smart Energy Services Market Revenues & Volume By Mobile Apps for the Period 2022 - 2032F
- Historical Data and Forecast of India Smart Energy Services Market Revenues & Volume By IoT + Remote Tech for the Period 2022 - 2032F
- Historical Data and Forecast of India Smart Energy Services Market Revenues & Volume By End User for the Period 2022 - 2032F
- Historical Data and Forecast of India Smart Energy Services Market Revenues & Volume By Smart Building Owners for the Period 2022 - 2032F
- Historical Data and Forecast of India Smart Energy Services Market Revenues & Volume By Utilities for the Period 2022 - 2032F
- Historical Data and Forecast of India Smart Energy Services Market Revenues & Volume By Energy Retailers for the Period 2022 - 2032F
- Historical Data and Forecast of India Smart Energy Services Market Revenues & Volume By Industrial Energy Managers for the Period 2022 - 2032F
- India Smart Energy Services Import Export Trade Statistics
- Market Opportunity Assessment By Service Type
- Market Opportunity Assessment By Smart Feature
- Market Opportunity Assessment By Delivery Model
- Market Opportunity Assessment By End User
- India Smart Energy Services Top Companies Market Share
- India Smart Energy Services Competitive Benchmarking By Technical and Operational Parameters
- India Smart Energy Services Company Profiles
- India Smart Energy Services Key Strategic Recommendations
Market Covered
Segments analysed in this report are listed below.
By Service Type
- Energy Usage Analytics
- Demand Response Systems
- Smart Billing Solutions
- Remote Energy Audits
By Smart Feature
- Real-Time Insights
- Automated Load Shifting
- Dynamic Tariff Calculation
- AI-Based Inspection
By Delivery Model
- SaaS
- Cloud-Based Platform
- Mobile Apps
- IoT + Remote Tech
By End User
- Smart Building Owners
- Utilities
- Energy Retailers
- Industrial Energy Managers































