India Spill Containment Market Size & Growth Rate
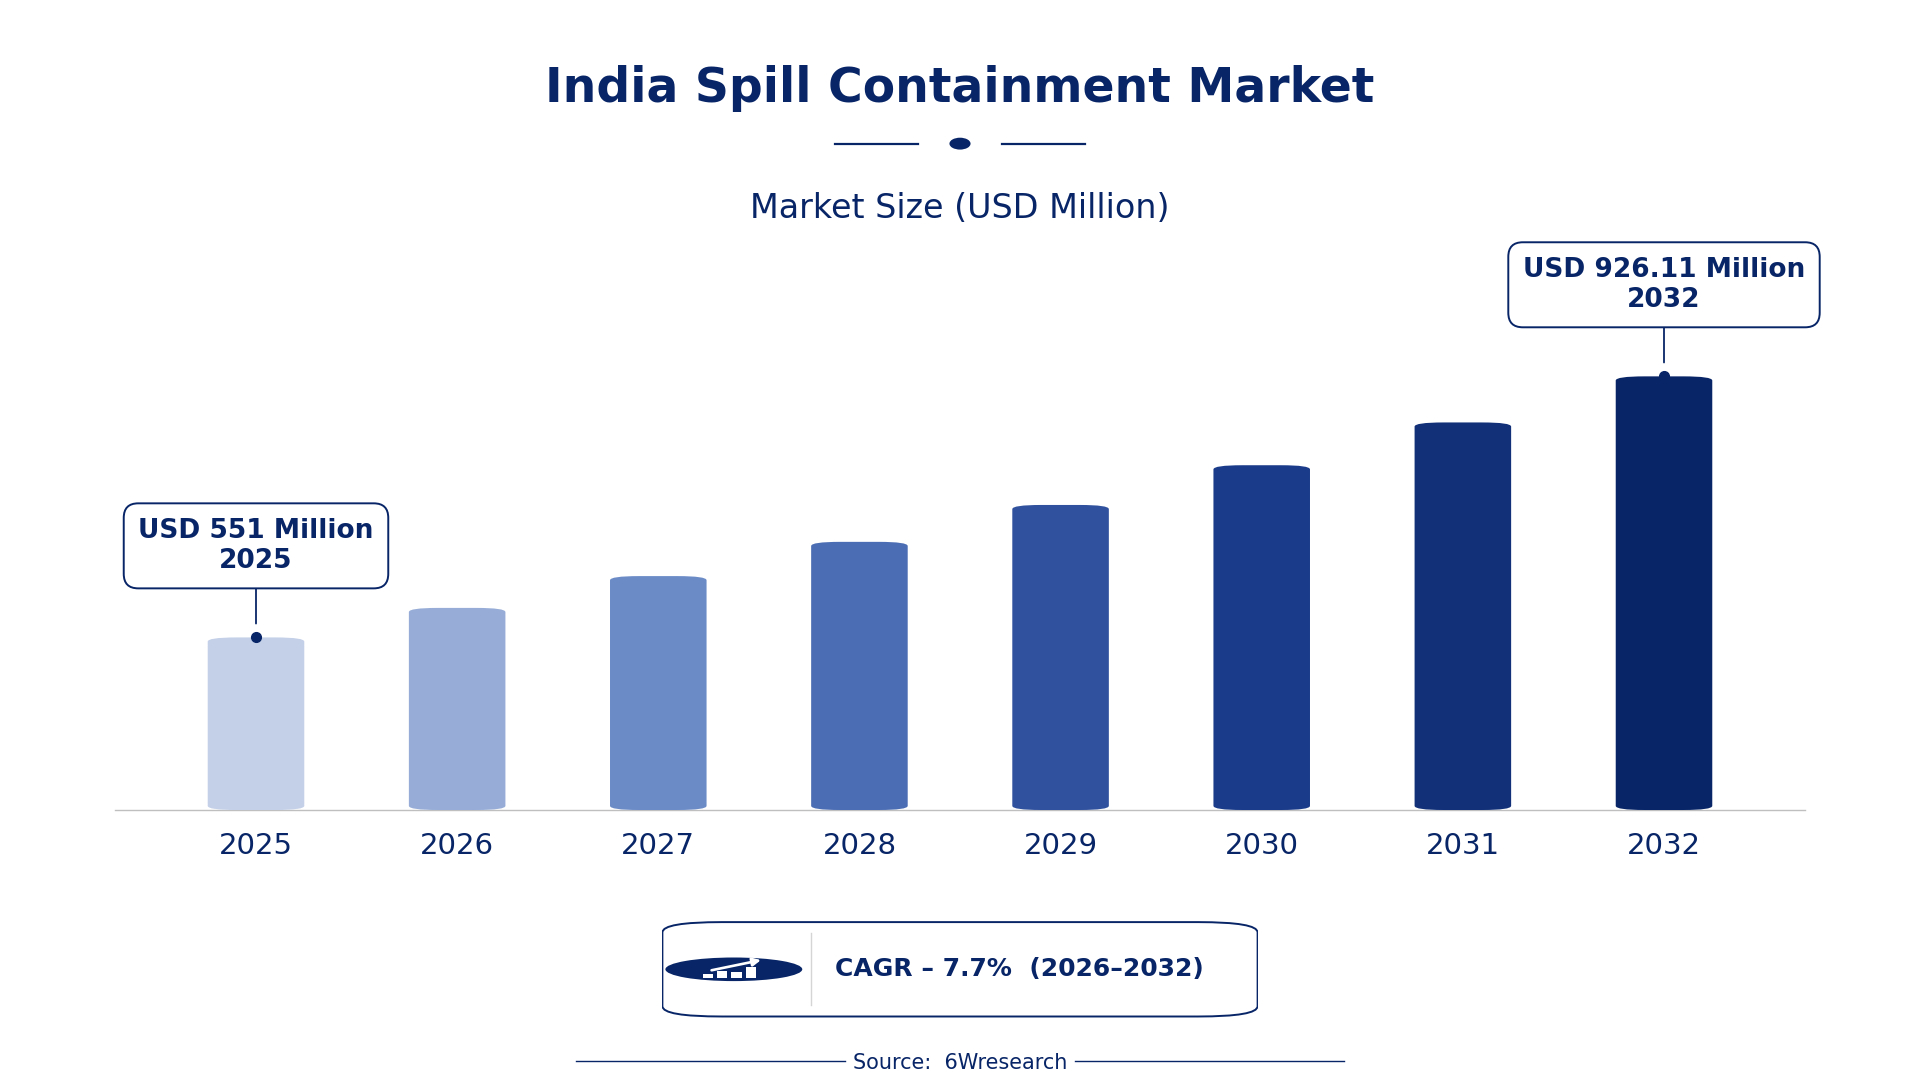
According to 6Wresearch internal database and industry insights, the India Spill Containment Market was valued at USD 551.0 million in 2025 and is projected to reach USD 926.11 million by 2032, growing at a CAGR of approximately 7.7% during 2026–2032.
India Spill Containment Market Highlights
| Report Metric | Details |
| Report Name | India Spill Containment Market |
| Market Size 2025 | USD 551.0 million |
| Market Size 2032 | USD 926.11 million |
| Absolute Growth 2025–2032 | USD 375.11 million |
| CAGR 2026–2032 | 7.7% |
| Peak Annual Growth | 10.3% in 2026 |
| Forecast Period | 2026–2032 |
| Historical Data | 2022–2025 |
| Base Year | 2025 |
| Leading Containment Type, 2025 | Spill Kits (41% share) |
| Leading Spill Category, 2025 | Chemical/Oil Spills (44% share) |
| Leading Deployment Format, 2025 | Temporary/Reusable (45% share) |
| Leading End User, 2025 | Industrial Facilities (39% share) |
| Fastest-Growing Containment Type | Drain Covers & Socks (9.9% CAGR) |
| Fastest-Growing Spill Category | Biohazard/Lubricant (9.4% CAGR) |
| Fastest-Growing Deployment Format | Mobile Units (10.3% CAGR) |
| Fastest-Growing End User | Safety Response Teams (9.8% CAGR) |
| Growing Sector | Safety Response Teams |
| Key End Users | Industrial Facilities, Manufacturing Plants, Safety Response Teams, Environmental Agencies |
India Spill Containment Market Year-wise Growth Rate and Key Drivers (2022–2032)
This graph illustrates the annual growth rates of the market from 2022 to 2032, highlighting a steady upward trajectory and projected market expansion over the forecast period.
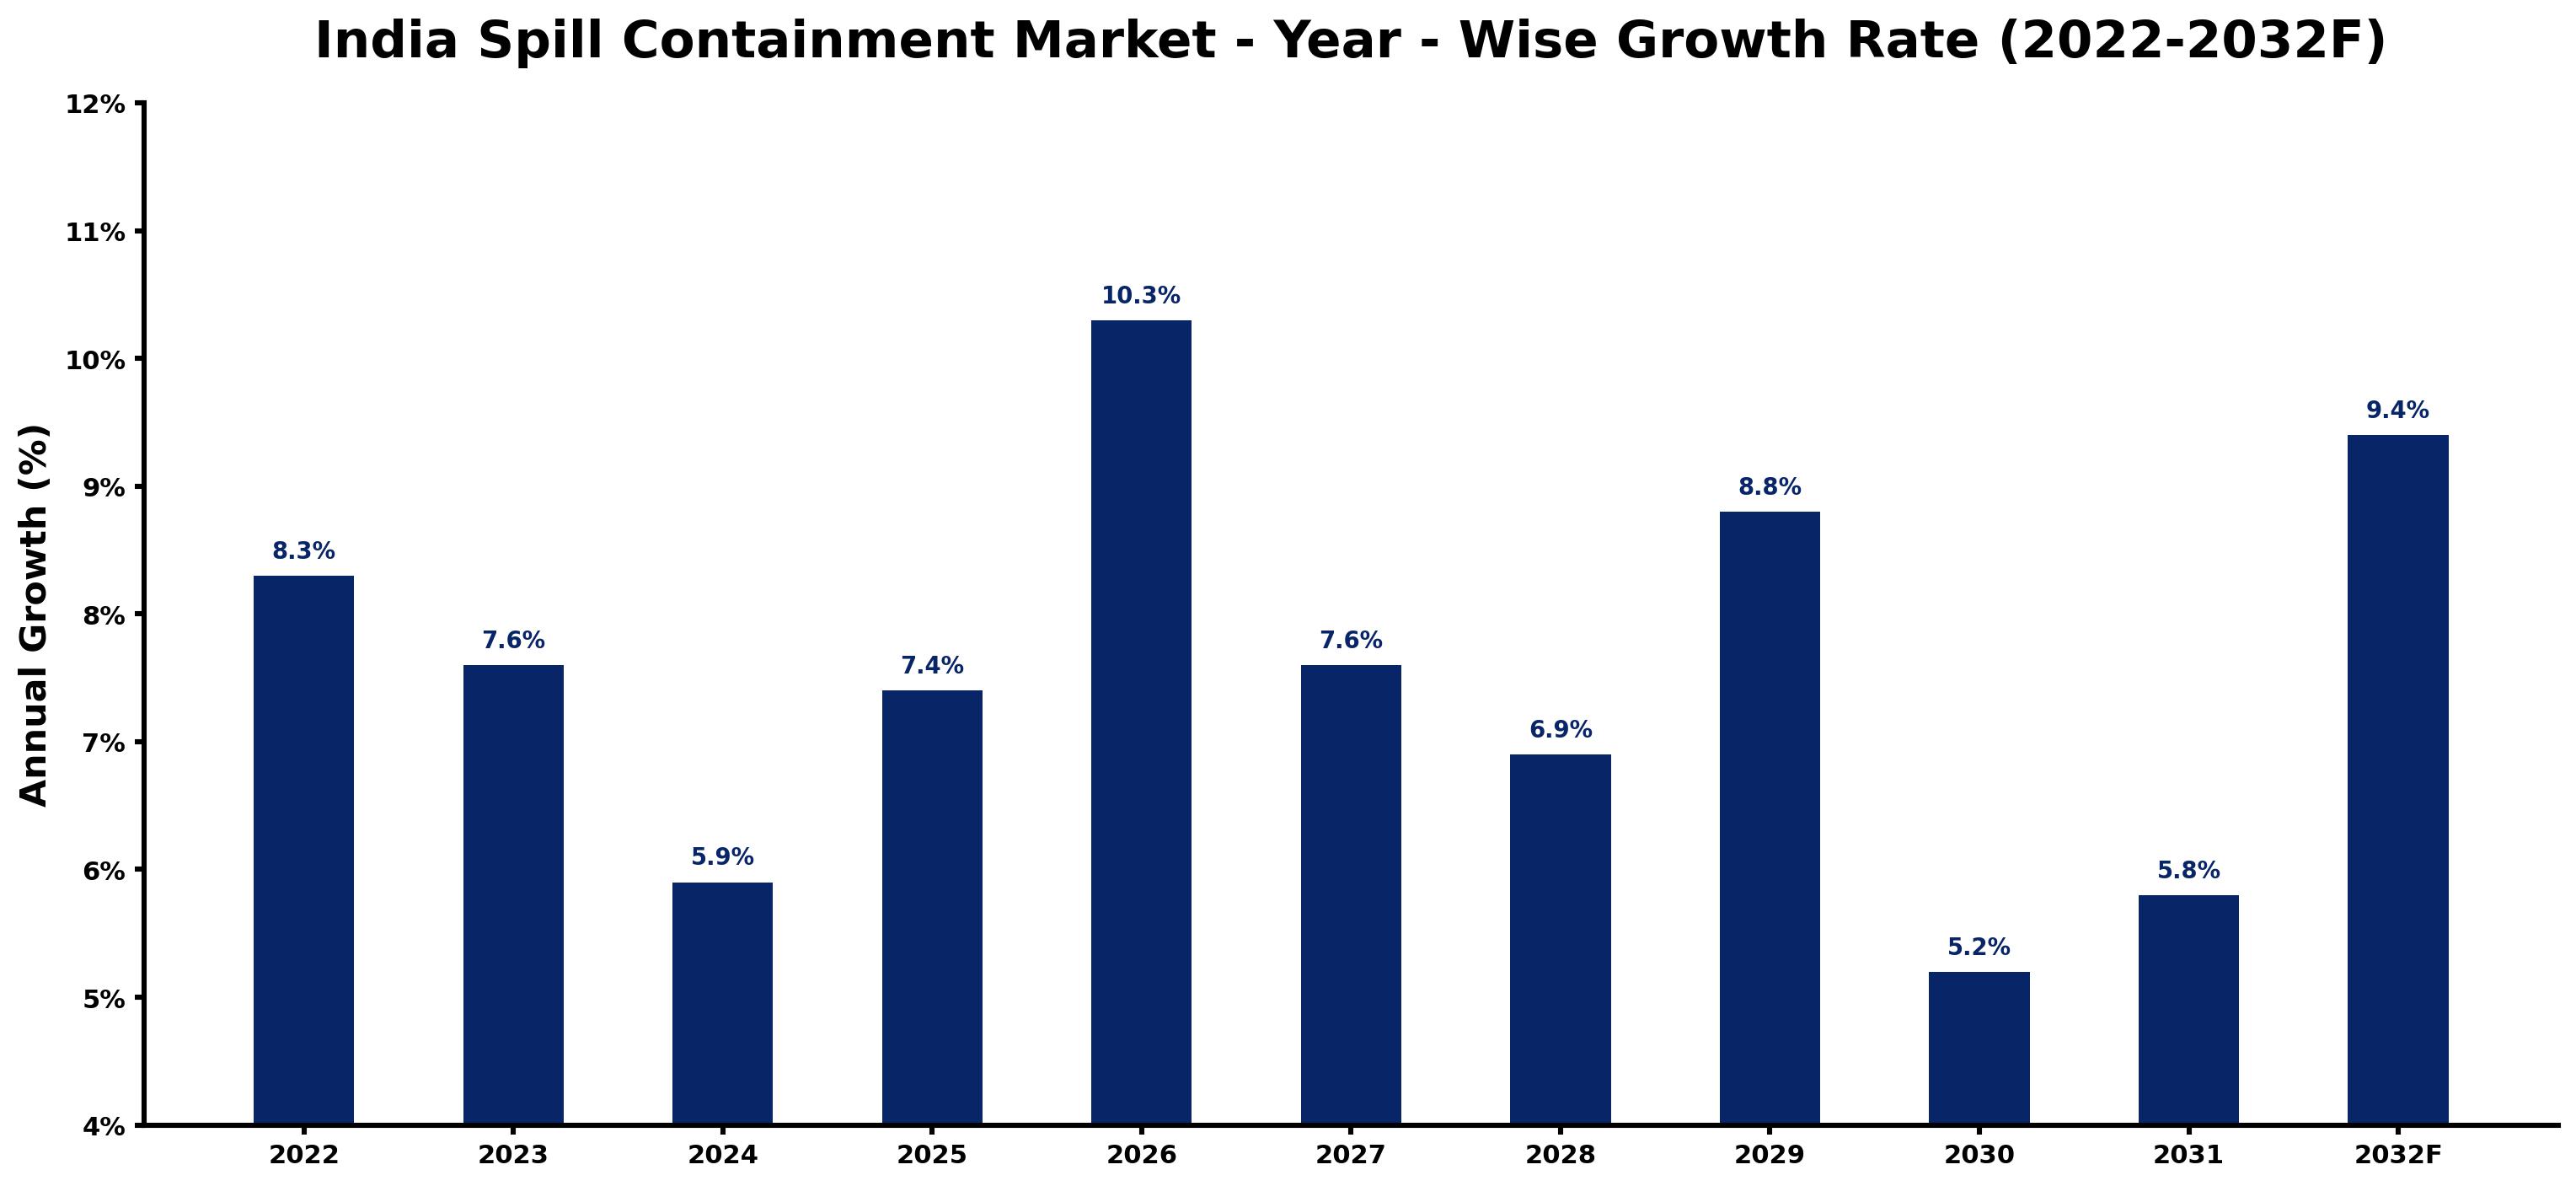
Annual growth estimates for each year appear below with the principal reason behind them, explaining the shifts that set the pace of the market.
| Year | Estimated Annual Growth (%) | Market Rationale |
| 2022 | 8.3 | The market was influenced by heightened safety regulations in industrial sectors. |
| 2023 | 7.6 | Demand growth slowed due to increased scrutiny on compliance measures. |
| 2024 | 5.9 | The market continued to grow as industries adapted to new environmental standards. |
| 2025 | 7.4 | Improved safety protocols in manufacturing led to faster demand growth. |
| 2026 | 10.3 | The introduction of new spill containment technologies is expected to accelerate market expansion. |
| 2027 | 7.6 | A slowdown in growth is projected as industries adjust to recent regulations. |
| 2028 | 6.9 | The market is expected to see slower growth due to the implementation of the National Policy on Hazardous Waste Management. |
| 2029 | 8.8 | Increased industrial accidents will prompt a resurgence in demand for containment solutions. |
| 2030 | 5.2 | Growth is projected to slow as the market adjusts to previous years' rapid expansion. |
| 2031 | 5.8 | Demand will increase again as industries improve their spill management strategies. |
| 2032 | 9.4 | The market is expected to grow as environmental safety becomes a priority. |
Note: Market size estimations and growth projections presented in this report are based on 6Wresearch's proprietary forecasting methodology, utilizing the latest available industry data, government publications, and primary research inputs.
India Spill Containment Market Synopsis
The India Spill Containment Market encompasses products designed to prevent and manage hazardous material spills in industrial settings. These products are made from durable materials that withstand chemical exposure and physical stress, ensuring compliance with safety regulations. Demand is driven by rising industrial activities, stringent safety regulations, and increased awareness of environmental protection. Key sources include industrial facilities and environmental agencies, with ongoing investments in spill management solutions expected to propel growth in the coming years.
Market Dynamics Impact Analysis (2026–2032)
| Factor | Type | Impact | Primary Segment Affected |
| Rising industrial activities drive demand for effective spill containment solutions. | Driver | High | Chemical/Oil Spills |
| Increased regulatory scrutiny on environmental safety promotes the adoption of spill kits. | Driver | High | Spill Kits |
| Growing emphasis on safety in manufacturing plants creates opportunities for innovative containment products. | Opportunity | High | Manufacturing Plants |
| The expansion of industrial facilities in Maharashtra and Gujarat opens new markets for spill containment. | Opportunity | High | Industrial Facilities |
| Compliance costs for spill management can burden smaller manufacturers. | Restraint | Medium | Manufacturing Plants |
| Limited awareness of spill containment solutions in certain sectors hampers market growth. | Restraint | Medium | Environmental Agencies |
| The market faces challenges from fluctuating raw material costs affecting product pricing. | Challenge | High | Spill Kits |
| Inconsistent enforcement of safety regulations can lead to variability in market demand. | Challenge | Medium | Chemical/Oil Spills |
Evaluation of Drivers in India Spill Containment Market (2026–2032)
Key forces behind demand, with the segment each one moves most, are listed below.
| Drivers | Primary Segment Affected | Why It Matters (Evidence) |
| Increased industrial activities require more spill containment solutions. | Chemical/Oil Spills | With over 2,000 manufacturing plants in India, demand for effective containment is critical. |
| Stringent safety regulations mandate the use of spill kits in manufacturing. | Spill Kits | Many plants are required to have spill kits, driving consistent demand. |
| The focus on environmental compliance encourages investment in spill management. | Chemical/Oil Spills | The National Policy on Hazardous Waste Management promotes better practices. |
| The rise in industrial accidents highlights the need for effective spill response. | Safety Response Teams | With around 1,500 industrial accidents annually, demand for response solutions increases. |
| Growing awareness of environmental protection drives demand for containment products. | Environmental Agencies | Regulatory bodies are pushing for improved spill management practices. |
The Spill Containment market in India is growing on the back of rising industrial activities, stringent safety regulations, and increased awareness of environmental protection. The industrial sector includes over 2,000 manufacturing plants requiring spill containment solutions, which boosts demand. The National Policy on Hazardous Waste Management emphasises the importance of spill prevention, driving the need for effective containment products. Environmental audits by agencies ensure compliance and promote best practices, further increasing demand for spill containment solutions. The average number of industrial accidents reported annually is around 1,500, highlighting the urgency for spill response measures.
Evaluation of Restraints in India Spill Containment Market
The key brakes on demand, and where they bite hardest, are shown below.
| Market Restraint | Primary Segment Affected | Why It Matters (Evidence) |
| High compliance costs can deter smaller manufacturers from investing in spill containment. | Manufacturing Plants | Smaller facilities may struggle to meet the financial demands of compliance with safety regulations. |
| Limited awareness of spill containment solutions hinders adoption in some sectors. | Environmental Agencies | Certain sectors lack knowledge about effective spill management practices, slowing market growth. |
| Fluctuating raw material costs impact pricing of spill containment products. | Spill Kits | Variability in costs can lead to unpredictable pricing, affecting buyer decisions. |
| Inconsistent enforcement of safety regulations leads to unpredictable demand. | Chemical/Oil Spills | Without stringent enforcement, industries may not prioritise spill management. |
| Market fragmentation complicates supply chain management for manufacturers. | Manufacturing Plants | Diverse buyer needs create challenges in standardising products and services. |
India Spill Containment Market Challenges
The India Spill Containment Market encounters several practical issues, with outdated technology being a primary concern. Many industrial facilities continue to rely on traditional containment methods, resulting in increased spill incidents that can cost producers up to 20% more in potential fines and cleanup. Buyers face compliance challenges as safety regulations require updated spill kits, leading to delays and incurring costs of around 15% in operational expenses. Skills shortages in spill response training leave workers unprepared during emergencies, potentially extending response times and increasing damage. Regulatory pressures from the Central Pollution Control Board impose strict adherence to standards, overwhelming smaller producers who lack the resources for compliance.
Trends in the India Spill Containment Market
The trends below show where the India Spill Containment Market is heading.
- Shift in Focus to Chemical Spill Management: Maharashtra is prioritising chemical spill management due to increased industrial activity, with 44% of spill containment demand coming from this category in 2025.
- Adoption of Mobile Spill Containment Units: The Chemical Safety Programme launched in 2023 promotes mobile units, which are expected to grow at a CAGR of 10.3% from 2026 to 2032, improving response capabilities.
- Increased Regulation on Hazardous Waste: Since 2020, the National Policy on Hazardous Waste Management has heightened regulatory scrutiny, leading to a stronger emphasis on spill prevention measures in industrial facilities.
- Growing Demand for Spill Kits in Manufacturing: The year 2022 marked a rise in the mandatory use of spill kits in manufacturing plants, with compliance rates increasing across various sectors.
Investment Opportunities in the India Spill Containment Market
Some of the investment opportunities in the India Spill Containment Market are mentioned below.
- Investment in Spill Kit Production: The average annual growth of the spill containment market is projected at 7.7%, creating opportunities for manufacturers to invest in spill kit production, particularly in industrial hubs like Gujarat.
- Expansion of Industrial Facilities in Maharashtra: With over 2,000 manufacturing plants, Maharashtra presents a market gap for spill containment solutions, encouraging local partnerships for effective supply chain management.
- Growing Need for Training Programs: The recent emphasis on safety training in manufacturing plants creates an opportunity for training providers to develop spill response programs, addressing the need for compliance and preparedness.
- Collaboration with Environmental Agencies: Engaging with environmental agencies for compliance audits can provide manufacturers with insights into market needs, facilitating tailored product development.
Government Initiatives in the India Spill Containment Market
The 'National Policy on Hazardous Waste Management' was launched in 2020 to improve spill containment practices across industries. This policy mandates stricter adherence to spill prevention measures, raising overall safety standards in the industrial sector. The 'Guidelines for the Management of Hazardous Waste' were updated in 2021 to ensure that industries adopt best practices in spill management, further strengthening compliance requirements. The 'Factories Act Amendment' implemented in 2021 mandates spill containment measures in all manufacturing facilities, ensuring that producers adhere to safety standards.
Manufacturers benefit from the 'Chemical Safety Programme' introduced in 2023, which focuses on spill management training for industrial workers. This initiative aims to improve the skills of workers in spill response, ensuring that they are well-prepared for emergencies. The National Disaster Management Authority also provides guidelines for spill response in industrial accidents, promoting safety and effective management. Environmental audits conducted by the Central Pollution Control Board help ensure compliance, with over 1,000 inspections carried out annually.
Future Insight of the India Spill Containment Market
The India Spill Containment Market is expected to develop by 2032, driven by several key factors. The 'Make in India' initiative will boost local production of advanced containment solutions, improving availability for buyers. The National Industrial Corridor Development Programme will raise safety standards across industrial sectors, encouraging investments in modern spill management technologies. Innovations in containment strategies will be necessary due to the average annual rainfall, which increases spill risks. Environmental audits by agencies will reinforce compliance, promoting a culture of safety and responsibility among producers.
Market Segmentation Analysis
The report offers a comprehensive study of the following market segments and their leading categories in the market.
By Containment Type – Spill Kits Dominated, Drain Covers & Socks Expected to Grow Fastest
According to Summon Dutta, Assistant Manager at 6Wresearch, with a 41% revenue share in 2025, Spill Kits was the largest containment type category. Spill kits hold the largest market share in India as they are crucial for immediate response to spills across various industrial environments. Their importance is highlighted by mandatory regulations that require their installation in over 2,000 manufacturing plants nationwide. Drain Covers & Socks are projected to grow fastest, at a CAGR of 9.9% during 2026–2032. The drain covers and socks segment is experiencing rapid growth, propelled by stricter regulations aimed at preventing contaminants from entering drainage systems during spills. This growth is particularly relevant in industrial regions where compliance with safety standards is essential. Suppliers should focus on ensuring the availability of spill kits and related products to meet the increasing demand in industrial facilities.
By Spill Category – Chemical/Oil Spills Dominated, Biohazard/Lubricant Expected to Grow Fastest
Chemical/Oil Spills took a 44% share of spill category in 2025, more than any other category. Chemical and oil spills command the largest market share due to the high level of industrial activity in India that produces hazardous waste. The emphasis on these spills is reinforced by regulations from the Central Pollution Control Board, which prioritise containment measures in industrial operations. Over 2026–2032, Biohazard/Lubricant is expected to post the fastest growth, at a CAGR of 9.4%. The biohazard and lubricant spill category is witnessing the fastest growth as industries recognise the need to manage less frequent but critical spill types. The implementation of enhanced safety standards and training initiatives is contributing to this upward trend. Buyers must equip themselves with solutions for both chemical and biohazard spills to ensure compliance with safety regulations.
By Deployment Format – Temporary/Reusable Dominated, Mobile Units Expected to Grow Fastest
Temporary/Reusable accounted for a 45% market share by deployment format in 2025. Temporary and reusable spill containment solutions dominate the market share due to their adaptability and effectiveness across a variety of spill scenarios. Their practicality is evident in the frequent need for flexible containment measures in diverse industrial sectors. The quickest growth will come from Mobile Units, forecast to expand at a CAGR of 10.3% between 2026 and 2032. Mobile units are rapidly gaining popularity, primarily because they allow for quick deployment in emergency situations. This trend is a direct response to the rising frequency of industrial accidents, necessitating immediate and effective response capabilities. Suppliers should invest in mobile unit technologies to address the urgent needs of industries facing spill incidents.
By End User – Industrial Facilities Dominated, Safety Response Teams Expected to Grow Fastest
Industrial Facilities held a 39% share of the India Spill Containment Market by end user in 2025. Industrial facilities represent the largest user segment for spill containment products, driven by the significant risk of spills associated with their operations. With around 1,500 industrial accidents reported annually, the demand for effective containment solutions remains high. Safety Response Teams are set to record the highest CAGR in this split, 9.8% over 2026–2032. Safety response teams are the fastest-growing end-user group, as their role in emergency spill management becomes increasingly vital. The rise in training and preparedness initiatives is enhancing their operational efficiency during spill incidents. Suppliers should tailor their offerings to meet the specific needs of safety response teams, ensuring they have the right tools for effective spill management.
Key Attractiveness of the Report
- 10 Years of Market Numbers
- Historical Data Starting from 2022 to 2025
- Base Year 2025
- Forecast Data until 2032
- Key Performance Indicators Impacting the Market
- Major Upcoming Developments and Projects
Key Highlights of the Report:
- India Spill Containment Market Outlook
- Market Size of India Spill Containment Market, 2025
- Forecast of India Spill Containment Market, 2032
- Historical Data and Forecast of India Spill Containment Revenues & Volume for the Period 2022 - 2032F
- India Spill Containment Market Trend Evolution
- India Spill Containment Market Drivers and Challenges
- India Spill Containment Price Trends
- India Spill Containment Porter's Five Forces
- India Spill Containment Industry Life Cycle
- Historical Data and Forecast of India Spill Containment Market Revenues & Volume By Containment Type for the Period 2022 - 2032F
- Historical Data and Forecast of India Spill Containment Market Revenues & Volume By Portable Berms for the Period 2022 - 2032F
- Historical Data and Forecast of India Spill Containment Market Revenues & Volume By Spill Kits for the Period 2022 - 2032F
- Historical Data and Forecast of India Spill Containment Market Revenues & Volume By Containment Pallets for the Period 2022 - 2032F
- Historical Data and Forecast of India Spill Containment Market Revenues & Volume By Drain Covers & Socks for the Period 2022 - 2032F
- Historical Data and Forecast of India Spill Containment Market Revenues & Volume By Spill Category for the Period 2022 - 2032F
- Historical Data and Forecast of India Spill Containment Market Revenues & Volume By Chemical/Oil Spills for the Period 2022 - 2032F
- Historical Data and Forecast of India Spill Containment Market Revenues & Volume By Biohazard/Lubricant for the Period 2022 - 2032F
- Historical Data and Forecast of India Spill Containment Market Revenues & Volume By Drum Storage for the Period 2022 - 2032F
- Historical Data and Forecast of India Spill Containment Market Revenues & Volume By Sewer Spill Protection for the Period 2022 - 2032F
- Historical Data and Forecast of India Spill Containment Market Revenues & Volume By Deployment Format for the Period 2022 - 2032F
- Historical Data and Forecast of India Spill Containment Market Revenues & Volume By Temporary/Reusable for the Period 2022 - 2032F
- Historical Data and Forecast of India Spill Containment Market Revenues & Volume By Mobile Units for the Period 2022 - 2032F
- Historical Data and Forecast of India Spill Containment Market Revenues & Volume By Stationary for the Period 2022 - 2032F
- Historical Data and Forecast of India Spill Containment Market Revenues & Volume By Flexible Materials for the Period 2022 - 2032F
- Historical Data and Forecast of India Spill Containment Market Revenues & Volume By End User for the Period 2022 - 2032F
- Historical Data and Forecast of India Spill Containment Market Revenues & Volume By Industrial Facilities for the Period 2022 - 2032F
- Historical Data and Forecast of India Spill Containment Market Revenues & Volume By Safety Response Teams for the Period 2022 - 2032F
- Historical Data and Forecast of India Spill Containment Market Revenues & Volume By Manufacturing Plants for the Period 2022 - 2032F
- Historical Data and Forecast of India Spill Containment Market Revenues & Volume By Environmental Agencies for the Period 2022 - 2032F
- India Spill Containment Import Export Trade Statistics
- Market Opportunity Assessment By Containment Type
- Market Opportunity Assessment By Spill Category
- Market Opportunity Assessment By Deployment Format
- Market Opportunity Assessment By End User
- India Spill Containment Top Companies Market Share
- India Spill Containment Competitive Benchmarking By Technical and Operational Parameters
- India Spill Containment Company Profiles
- India Spill Containment Key Strategic Recommendations
Market Covered
The report offers an extensive study of the following market segments.
By Containment Type
- Portable Berms
- Spill Kits
- Containment Pallets
- Drain Covers & Socks
By Spill Category
- Chemical/Oil Spills
- Biohazard/Lubricant
- Drum Storage
- Sewer Spill Protection
By Deployment Format
- Temporary/Reusable
- Mobile Units
- Stationary
- Flexible Materials
By End User
- Industrial Facilities
- Safety Response Teams
- Manufacturing Plants
- Environmental Agencies































