Indonesia Activated Carbon for Mercury Control Market (2026-2032) Outlook | Revenue, Analysis, Growth, Share, Industry, Size, Trends, Value, Companies & Forecast
Market Forecast By Application (Coal Burning, Gold Mining, Cement Production, Ferrous & Non-Ferrous Metals, Oil & Gas Burning, Oil Refining , Others) And Competitive Landscape
| Product Code: ETC4484609 | Publication Date: Jul 2023 | Updated Date: Mar 2026 | Product Type: Report | |
| Publisher: 6Wresearch | Author: Ravi Bhandari | No. of Pages: 85 | No. of Figures: 45 | No. of Tables: 25 |
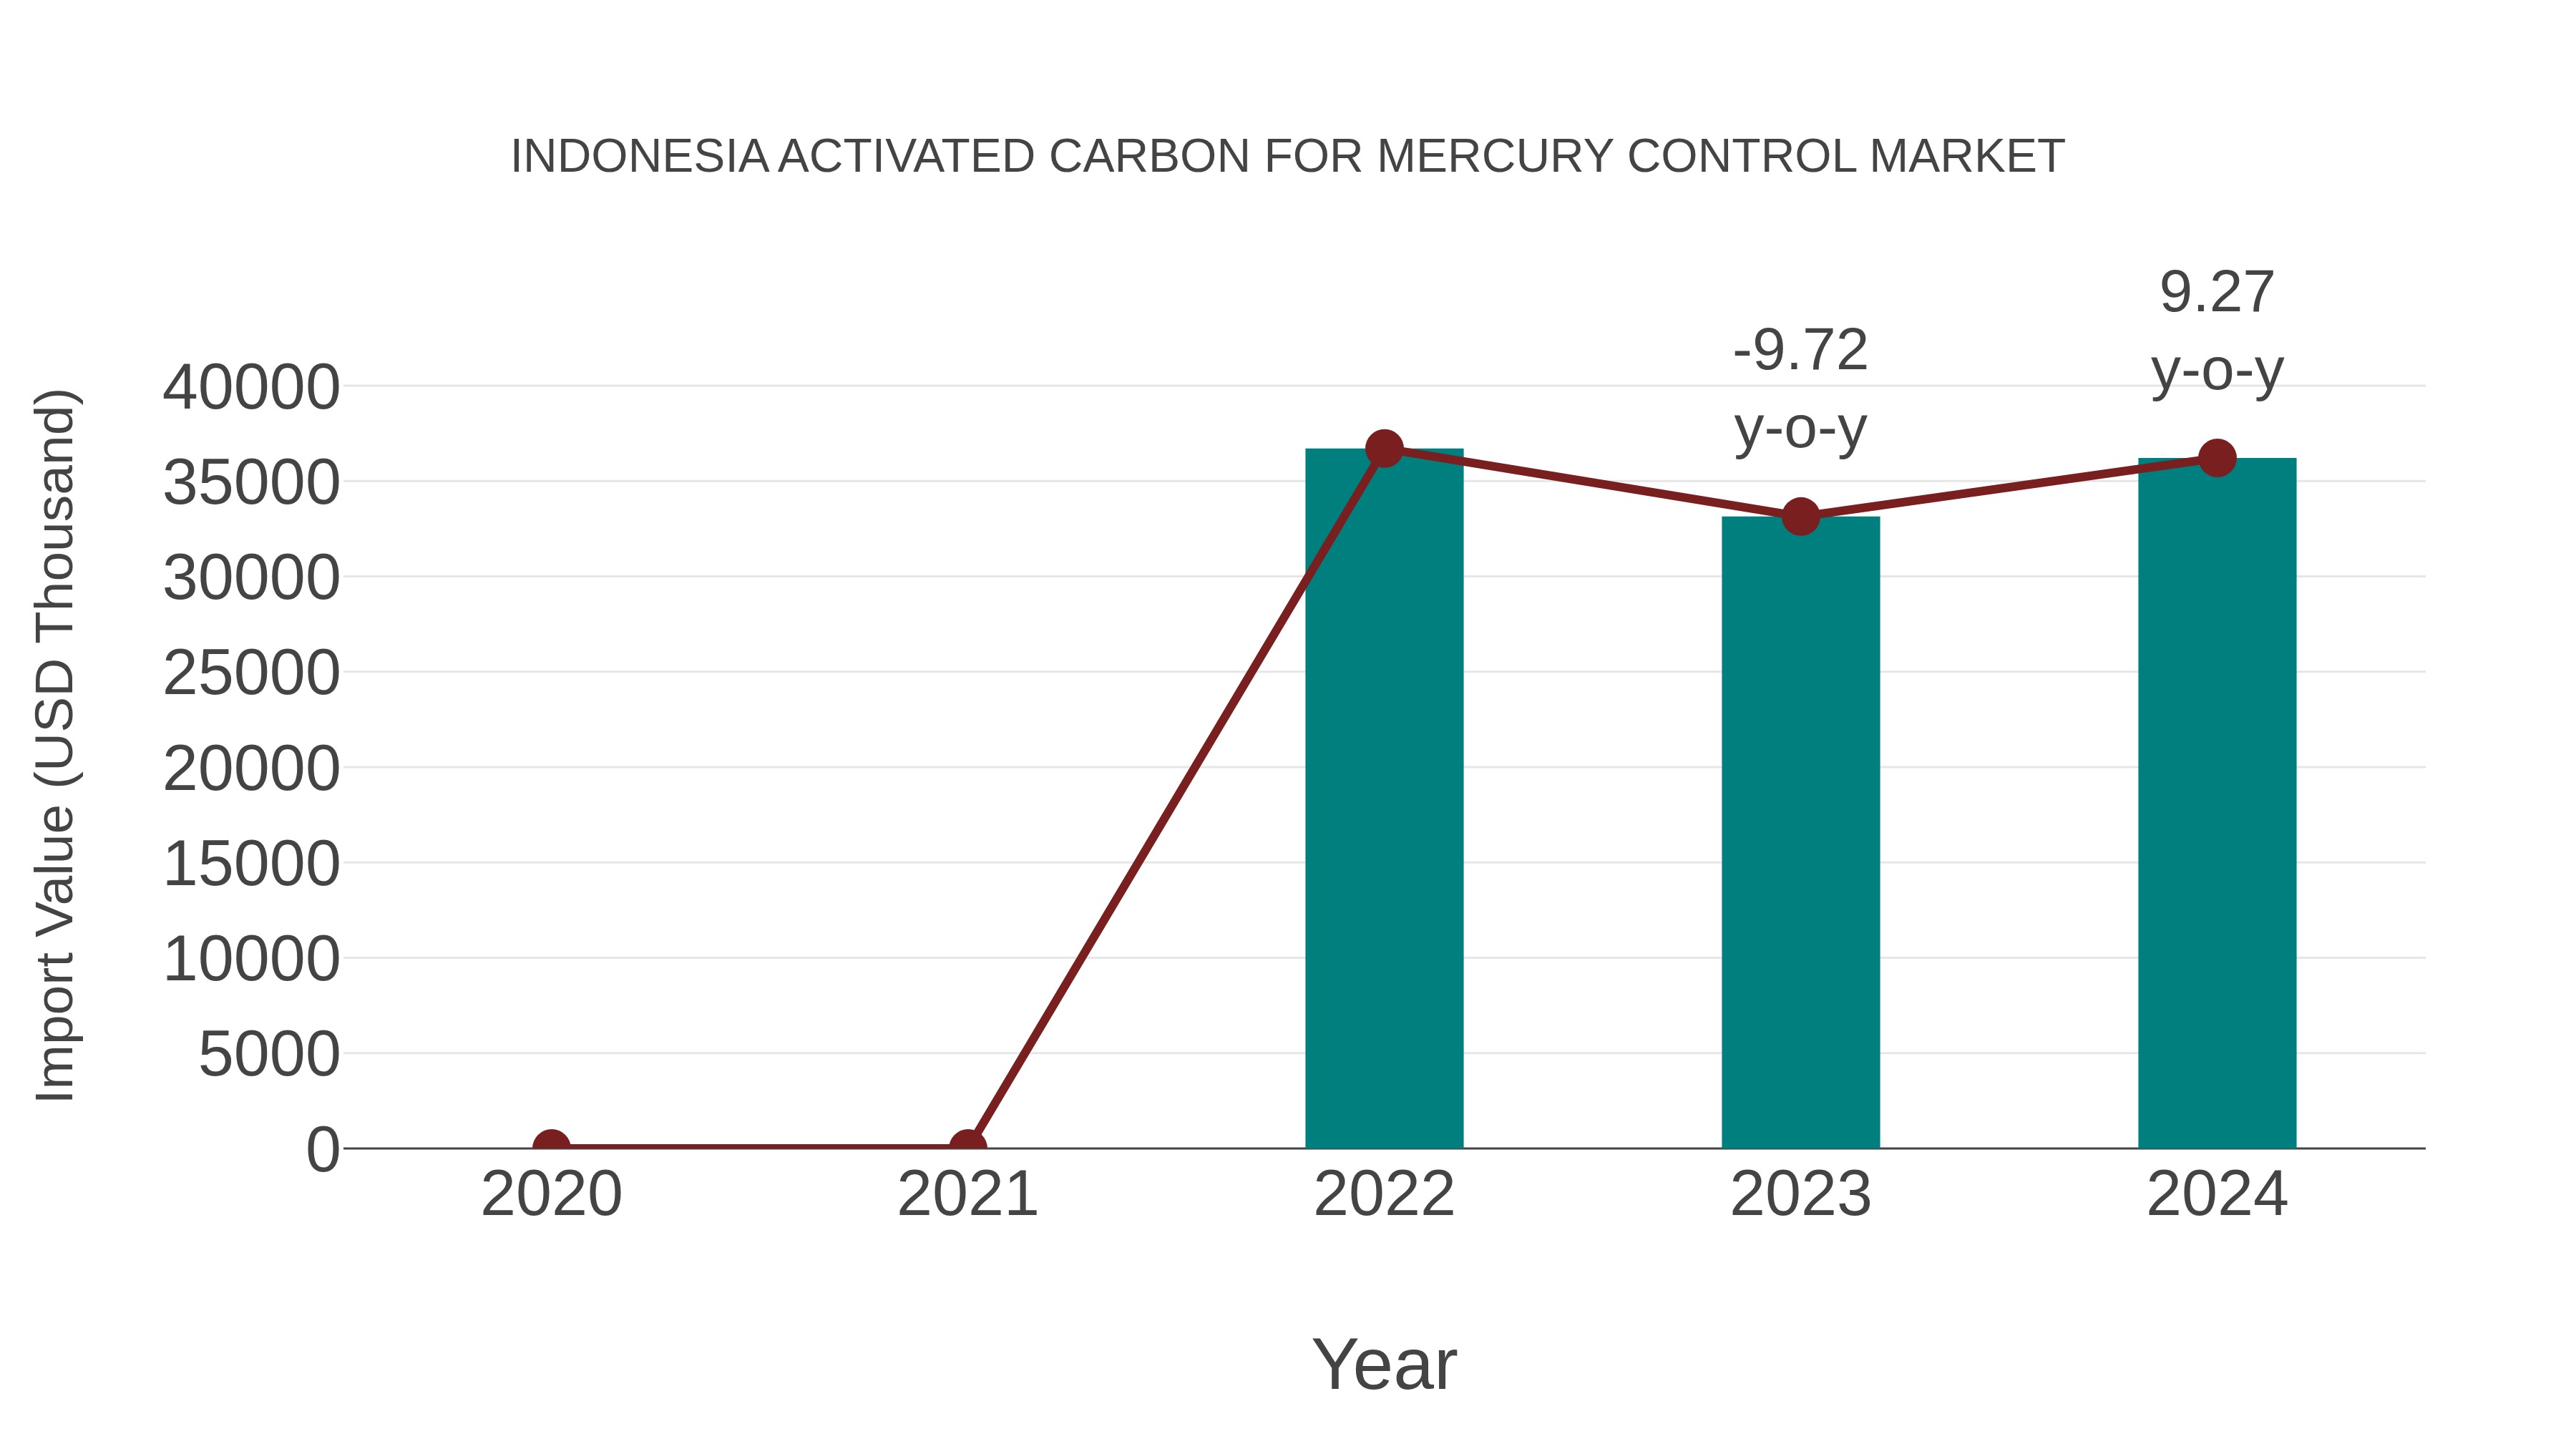
Indonesia Activated Carbon for Mercury Control Market: Import Trend Analysis
In the Indonesia activated carbon for mercury control market, the import trend saw a 9.27% growth rate from 2023 to 2024, with a compound annual growth rate (CAGR) of -0.68% for the period of 2020-2024. This decline in CAGR could be attributed to shifts in demand dynamics or changes in trade policies affecting market stability.
Indonesia Activated Carbon for Mercury Control Market Overview
Indonesia`s market for activated carbon for mercury control has seen a surge in demand, primarily attributed to the country`s efforts to mitigate environmental pollution. Activated carbon plays a crucial role in removing mercury emissions from various industrial processes, making it an indispensable component in environmental protection initiatives.
Drivers of the Market
The market for activated carbon for mercury control is driven by environmental regulations aimed at reducing mercury emissions from various industries, especially coal-fired power plants. As Indonesia seeks to improve air quality and meet international emissions standards, the demand for activated carbon for mercury control is expected to rise.
Challenges of the Market
One of the primary challenges facing the activated carbon for mercury control market in Indonesia is the need for advanced technology and expertise. Developing and deploying efficient mercury control solutions requires specialized knowledge and resources. Furthermore, cost considerations and the need for continuous research and development can strain the market`s growth.
COVID-19 Impacts on the Market
The Indonesia activated carbon market for mercury control saw increased relevance during the COVID-19 pandemic, as air quality and emissions control became significant concerns. The adoption of activated carbon for mercury removal in industries like coal-fired power plants and waste incineration facilities was influenced by environmental regulations and public health priorities.
Key Players of the Makret
Notable companies in the activated carbon for mercury control market in Indonesia include PT. Intinusa Selareksa, PT. Barindo Bintang Perkasa, and PT. Fajar Mas Murni.
Key Highlights of the Report:
- Indonesia Activated Carbon for Mercury Control Market Outlook
- Market Size of Indonesia Activated Carbon for Mercury Control Market, 2025
- Forecast of Indonesia Activated Carbon for Mercury Control Market, 2032
- Historical Data and Forecast of Indonesia Activated Carbon for Mercury Control Revenues & Volume for the Period 2022-2032F
- Indonesia Activated Carbon for Mercury Control Market Trend Evolution
- Indonesia Activated Carbon for Mercury Control Market Drivers and Challenges
- Indonesia Activated Carbon for Mercury Control Price Trends
- Indonesia Activated Carbon for Mercury Control Porter's Five Forces
- Indonesia Activated Carbon for Mercury Control Industry Life Cycle
- Historical Data and Forecast of Indonesia Activated Carbon for Mercury Control Market Revenues & Volume By Application for the Period 2022-2032F
- Historical Data and Forecast of Indonesia Activated Carbon for Mercury Control Market Revenues & Volume By Coal Burning for the Period 2022-2032F
- Historical Data and Forecast of Indonesia Activated Carbon for Mercury Control Market Revenues & Volume By Gold Mining for the Period 2022-2032F
- Historical Data and Forecast of Indonesia Activated Carbon for Mercury Control Market Revenues & Volume By Cement Production for the Period 2022-2032F
- Historical Data and Forecast of Indonesia Activated Carbon for Mercury Control Market Revenues & Volume By Ferrous & Non-Ferrous Metals for the Period 2022-2032F
- Historical Data and Forecast of Indonesia Activated Carbon for Mercury Control Market Revenues & Volume By Oil & Gas Burning for the Period 2022-2032F
- Historical Data and Forecast of Indonesia Activated Carbon for Mercury Control Market Revenues & Volume By Oil Refining for the Period 2022-2032F
- Historical Data and Forecast of Indonesia Activated Carbon for Mercury Control Market Revenues & Volume By Others for the Period 2022-2032F
- Indonesia Activated Carbon for Mercury Control Import Export Trade Statistics
- Market Opportunity Assessment By Application
- Indonesia Activated Carbon for Mercury Control Top Companies Market Share
- Indonesia Activated Carbon for Mercury Control Competitive Benchmarking By Technical and Operational Parameters
- Indonesia Activated Carbon for Mercury Control Company Profiles
- Indonesia Activated Carbon for Mercury Control Key Strategic Recommendations
Indonesia Activated Carbon for Mercury Control Market (2026-2032): FAQs
6Wresearch actively monitors the Indonesia Activated Carbon for Mercury Control Market and publishes its comprehensive annual report, highlighting emerging trends, growth drivers, revenue analysis, and forecast outlook. Our insights help businesses to make data-backed strategic decisions with ongoing market dynamics. Our analysts track relevent industries related to the Indonesia Activated Carbon for Mercury Control Market, allowing our clients with actionable intelligence and reliable forecasts tailored to emerging regional needs.
Yes, we provide customisation as per your requirements. To learn more, feel free to contact us on sales@6wresearch.com
1 Executive Summary |
2 Introduction |
2.1 Key Highlights of the Report |
2.2 Report Description |
2.3 Market Scope & Segmentation |
2.4 Research Methodology |
2.5 Assumptions |
3 Indonesia Activated Carbon for Mercury Control Market Overview |
3.1 Indonesia Country Macro Economic Indicators |
3.2 Indonesia Activated Carbon for Mercury Control Market Revenues & Volume, 2022 & 2032F |
3.3 Indonesia Activated Carbon for Mercury Control Market - Industry Life Cycle |
3.4 Indonesia Activated Carbon for Mercury Control Market - Porter's Five Forces |
3.5 Indonesia Activated Carbon for Mercury Control Market Revenues & Volume Share, By Application, 2022 & 2032F |
4 Indonesia Activated Carbon for Mercury Control Market Dynamics |
4.1 Impact Analysis |
4.2 Market Drivers |
4.2.1 Stringent environmental regulations in Indonesia promoting the use of activated carbon for mercury control. |
4.2.2 Increasing industrial activities leading to higher mercury emissions and the need for mercury control solutions. |
4.2.3 Growing awareness among industries about the harmful effects of mercury pollution and the importance of using activated carbon for control purposes. |
4.3 Market Restraints |
4.3.1 High initial investment costs associated with setting up activated carbon systems for mercury control. |
4.3.2 Limited availability of high-quality activated carbon products in the market. |
4.3.3 Lack of skilled professionals for the proper installation and maintenance of activated carbon systems. |
5 Indonesia Activated Carbon for Mercury Control Market Trends |
6 Indonesia Activated Carbon for Mercury Control Market, By Types |
6.1 Indonesia Activated Carbon for Mercury Control Market, By Application |
6.1.1 Overview and Analysis |
6.1.2 Indonesia Activated Carbon for Mercury Control Market Revenues & Volume, By Application, 2022-2032F |
6.1.3 Indonesia Activated Carbon for Mercury Control Market Revenues & Volume, By Coal Burning, 2022-2032F |
6.1.4 Indonesia Activated Carbon for Mercury Control Market Revenues & Volume, By Gold Mining, 2022-2032F |
6.1.5 Indonesia Activated Carbon for Mercury Control Market Revenues & Volume, By Cement Production, 2022-2032F |
6.1.6 Indonesia Activated Carbon for Mercury Control Market Revenues & Volume, By Ferrous & Non-Ferrous Metals, 2022-2032F |
6.1.7 Indonesia Activated Carbon for Mercury Control Market Revenues & Volume, By Oil & Gas Burning, 2022-2032F |
6.1.8 Indonesia Activated Carbon for Mercury Control Market Revenues & Volume, By Oil Refining , 2022-2032F |
7 Indonesia Activated Carbon for Mercury Control Market Import-Export Trade Statistics |
7.1 Indonesia Activated Carbon for Mercury Control Market Export to Major Countries |
7.2 Indonesia Activated Carbon for Mercury Control Market Imports from Major Countries |
8 Indonesia Activated Carbon for Mercury Control Market Key Performance Indicators |
8.1 Efficiency of activated carbon systems in reducing mercury emissions. |
8.2 Number of industries adopting activated carbon technology for mercury control. |
8.3 Rate of technological advancements in activated carbon products for improved mercury capture efficiency. |
8.4 Compliance rate of industries with mercury emission regulations in Indonesia. |
8.5 Investment in research and development for enhancing the performance of activated carbon for mercury control. |
9 Indonesia Activated Carbon for Mercury Control Market - Opportunity Assessment |
9.1 Indonesia Activated Carbon for Mercury Control Market Opportunity Assessment, By Application, 2022 & 2032F |
10 Indonesia Activated Carbon for Mercury Control Market - Competitive Landscape |
10.1 Indonesia Activated Carbon for Mercury Control Market Revenue Share, By Companies, 2025 |
10.2 Indonesia Activated Carbon for Mercury Control Market Competitive Benchmarking, By Operating and Technical Parameters |
11 Company Profiles |
12 Recommendations |
13 Disclaimer |
Global Go To Market Strategy - 2030
Export potential enables firms to identify high-growth global markets with greater confidence by combining advanced trade intelligence with a structured quantitative methodology. The framework analyzes emerging demand trends and country-level import patterns while integrating macroeconomic and trade datasets such as GDP and population forecasts, bilateral import–export flows, tariff structures, elasticity differentials between developed and developing economies, geographic distance, and import demand projections. Using weighted trade values from 2020–2024 as the base period to project country-to-country export potential for 2030, these inputs are operationalized through calculated drivers such as gravity model parameters, tariff impact factors, and projected GDP per-capita growth. Through an analysis of hidden potentials, demand hotspots, and market conditions that are most favorable to success, this method enables firms to focus on target countries, maximize returns, and global expansion with data, backed by accuracy.
By factoring in the projected importer demand gap that is currently unmet and could be potential opportunity, it identifies the potential for the Exporter (Country) among 190 countries, against the general trade analysis, which identifies the biggest importer or exporter.
To discover high-growth global markets and optimize your business strategy:
Click Here
Pricing
- Single User License$ 1,995
- Department License$ 2,400
- Site License$ 3,120
- Global License$ 3,795

Leadership Perspectives from Industry Events
Search
Thought Leadership and Analyst Meet


Our Clients
6WResearch In News
- India Export Attractiveness Tracker 2026
- India Air Conditioner Market Set for Strong Rebound in 2026 After Weather-Led Correction and GST-Driven Recovery: 6Wresearch
- ADAS in India: How Automatic Emergency Braking, Blind Spot Detection & Driver Monitoring are Transforming Road Safety
- Doha a strategic location for EV manufacturing hub: IPA Qatar
- Demand for luxury TVs surging in the GCC, says Samsung
- Empowering Growth: The Thriving Journey of Bangladesh’s Cable Industry
Latest Reports
- Nicaragua RPG Gaming Market (2026-2032)
- New Zealand RPG Gaming Market (2026-2032)
- Netherlands RPG Gaming Market (2026-2032)
- Nauru RPG Gaming Market (2026-2032)
- Namibia RPG Gaming Market (2026-2032)
- Mozambique RPG Gaming Market (2026-2032)
- Montenegro RPG Gaming Market (2026-2032)
- Mongolia RPG Gaming Market (2026-2032)
- Monaco RPG Gaming Market (2026-2032)
- Micronesia RPG Gaming Market (2026-2032)
Industry Events and Analyst Meet

EV India Expo 2026

HIMTEX 2026

India Refining Summit 2026

India EV Show 2026

EV tech India Expo 2026
Whitepaper
- Middle East & Africa Commercial Security Market Click here to view more.
- Middle East & Africa Fire Safety Systems & Equipment Market Click here to view more.
- GCC Drone Market Click here to view more.
- Middle East Lighting Fixture Market Click here to view more.
- GCC Physical & Perimeter Security Market Click here to view more.