Indonesia Artificial Limbs Market (2026-2032) | Companies, Value, Forecast, Outlook, Trends, Size & Revenue, Share, Competitive Landscape, Segmentation, Analysis, Growth, Industry
Market Forecast By Type (Lower Extremity, Upper Extremity, Compression Therapy), By Technology (Body Powered or Cable Operated, Cosmetic Prosthetics, Myoelectric or Electrically powered, Others), By Material (Titanium, Plastics, Others), By End User (Hospitals, Orthopaedic Clinics, Ambulatory Surgical Centres, Rehabilitation Centres, Prosthetic Clinics) And Competitive Landscape
| Product Code: ETC7558675 | Publication Date: Sep 2024 | Updated Date: Feb 2026 | Product Type: Market Research Report | |
| Publisher: 6Wresearch | Author: Vasudha | No. of Pages: 75 | No. of Figures: 35 | No. of Tables: 20 |
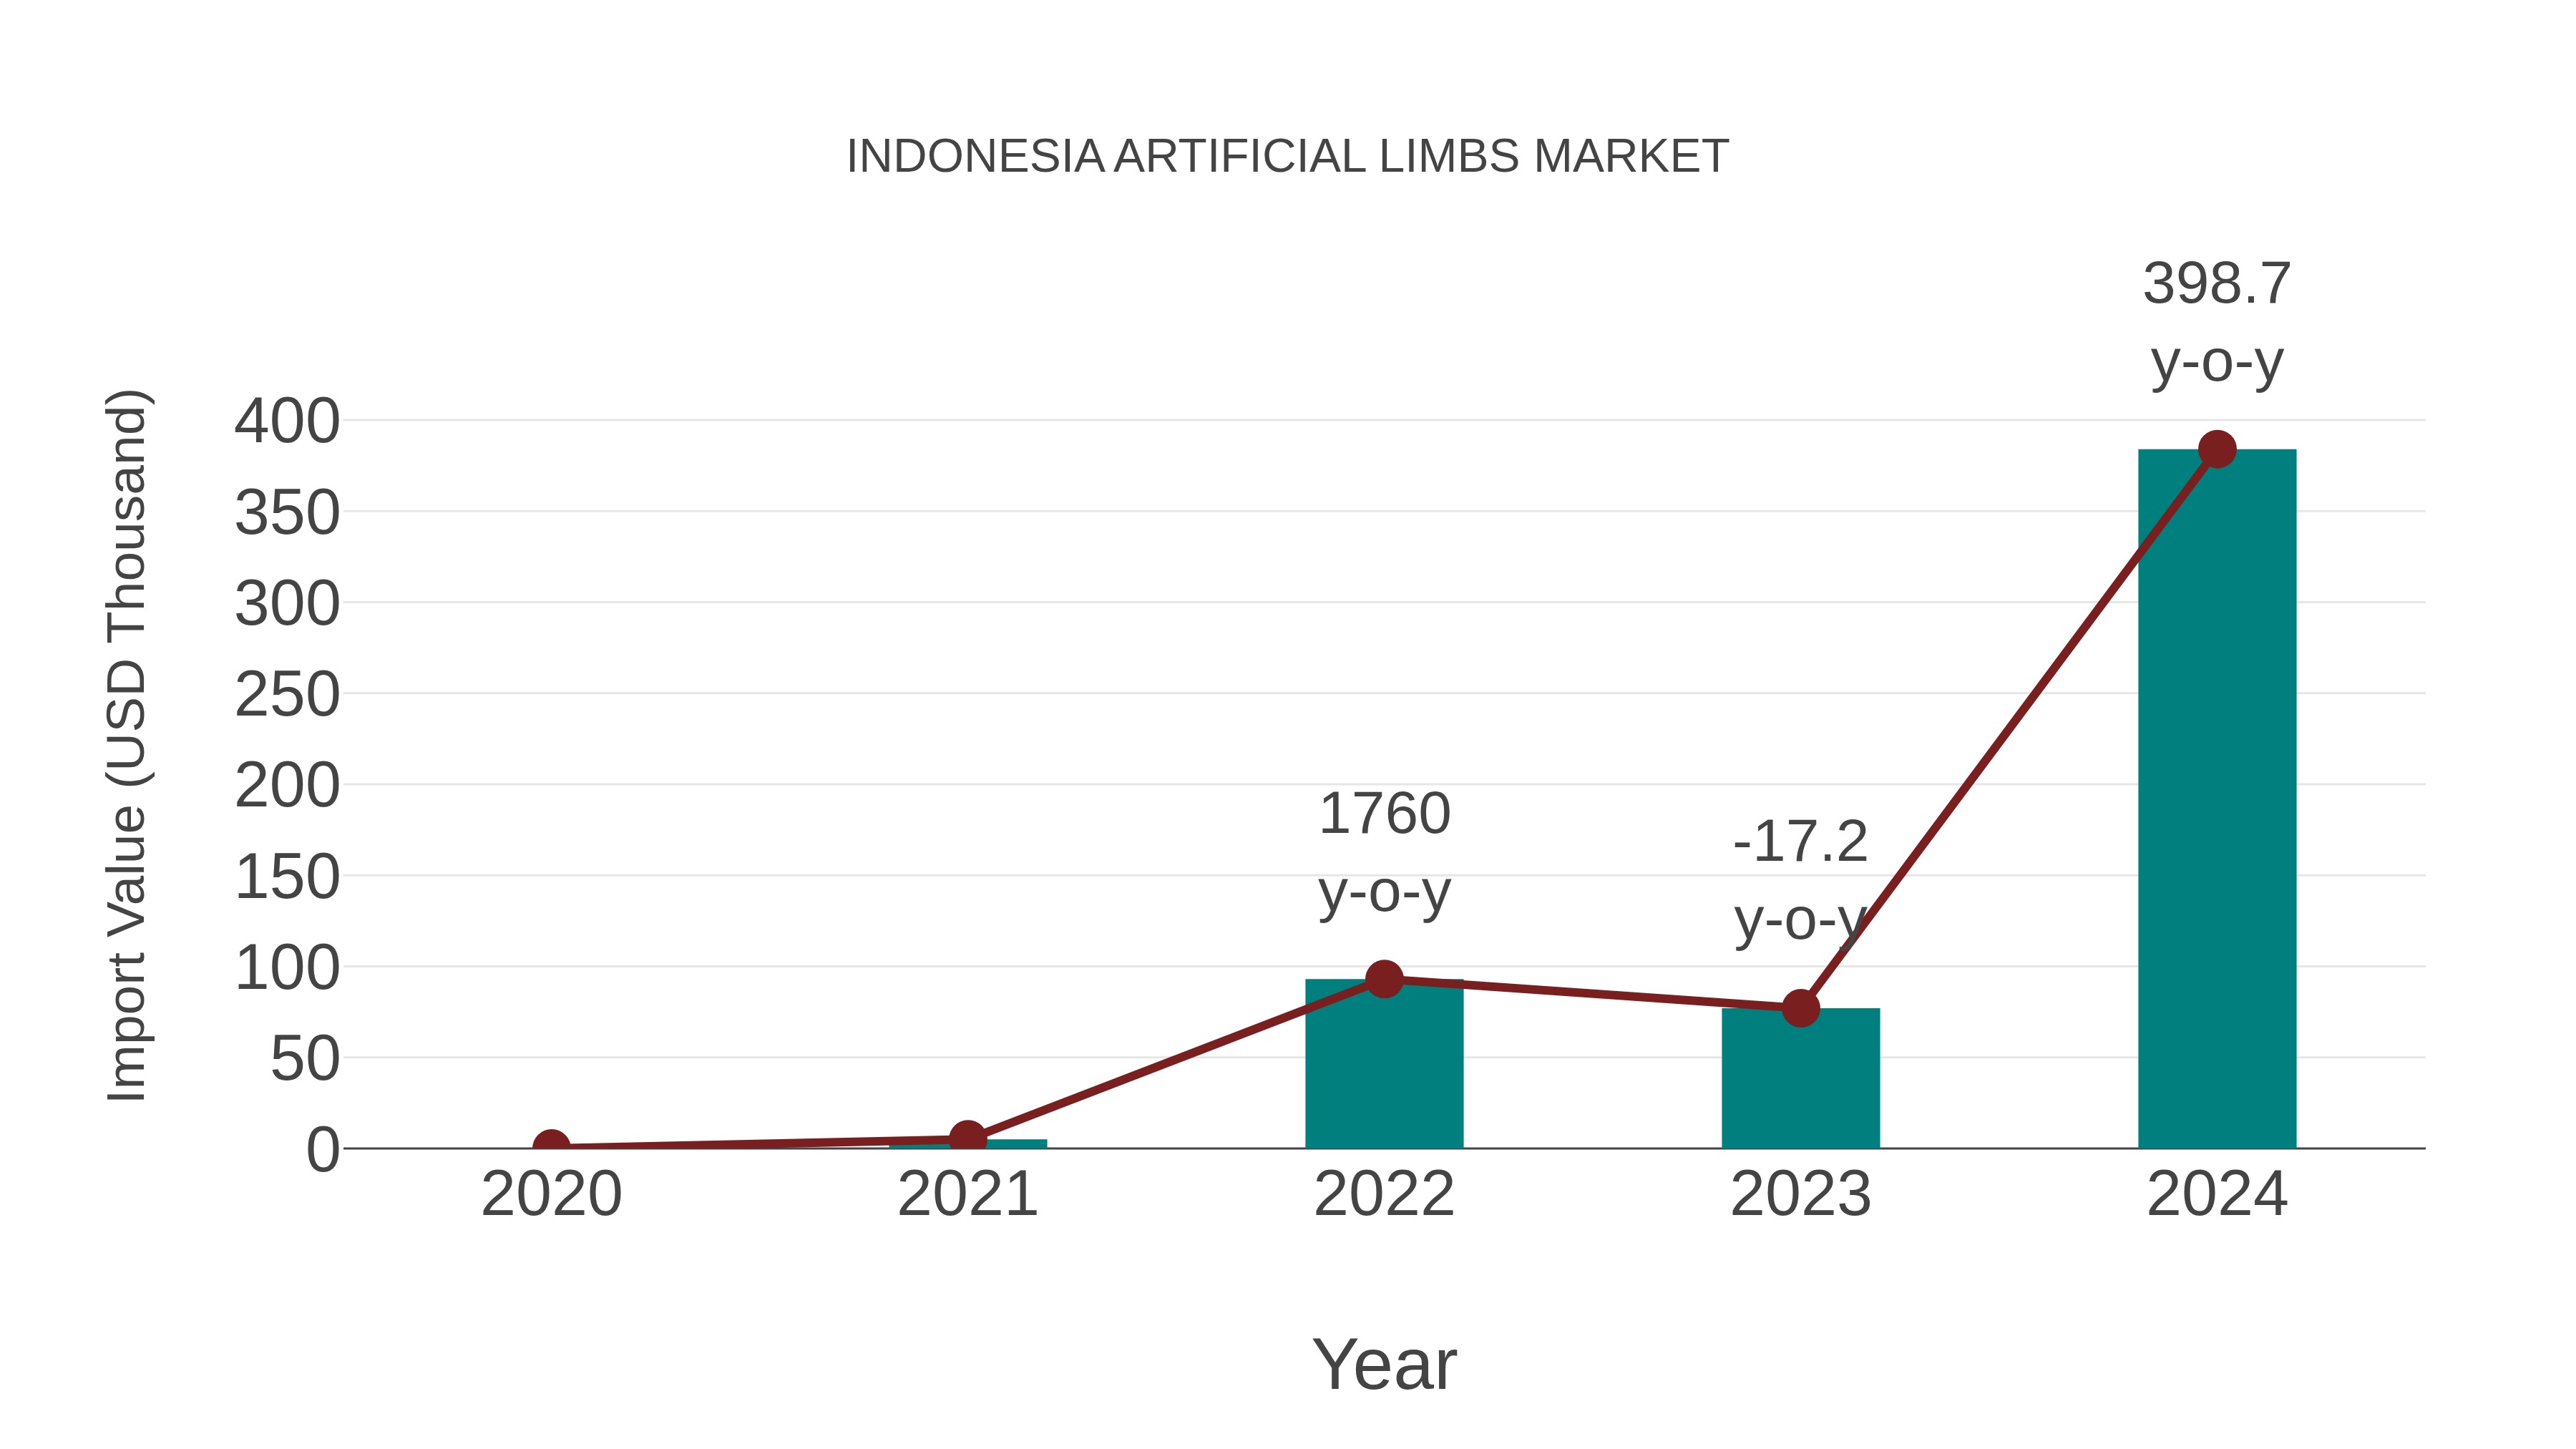
Indonesia Artificial Limbs Market: Import Trend Analysis
Indonesia`s import trend for artificial limbs in 2024 showed significant growth, with a remarkable increase of 398.7% compared to the previous year. The compound annual growth rate (CAGR) from 2020 to 2024 stood at an impressive 325.06%. This surge in imports can be attributed to a notable shift in demand towards advanced prosthetic technologies, indicating a potential market expansion and increased accessibility to innovative artificial limb solutions within Indonesia.
Key Highlights of the Report:
- Indonesia Artificial Limbs Market Outlook
- Market Size of Indonesia Artificial Limbs Market, 2025
- Forecast of Indonesia Artificial Limbs Market, 2032
- Historical Data and Forecast of Indonesia Artificial Limbs Revenues & Volume for the Period 2022-2032F
- Indonesia Artificial Limbs Market Trend Evolution
- Indonesia Artificial Limbs Market Drivers and Challenges
- Indonesia Artificial Limbs Price Trends
- Indonesia Artificial Limbs Porter's Five Forces
- Indonesia Artificial Limbs Industry Life Cycle
- Historical Data and Forecast of Indonesia Artificial Limbs Market Revenues & Volume By Type for the Period 2022-2032F
- Historical Data and Forecast of Indonesia Artificial Limbs Market Revenues & Volume By Lower Extremity for the Period 2022-2032F
- Historical Data and Forecast of Indonesia Artificial Limbs Market Revenues & Volume By Upper Extremity for the Period 2022-2032F
- Historical Data and Forecast of Indonesia Artificial Limbs Market Revenues & Volume By Compression Therapy for the Period 2022-2032F
- Historical Data and Forecast of Indonesia Artificial Limbs Market Revenues & Volume By Technology for the Period 2022-2032F
- Historical Data and Forecast of Indonesia Artificial Limbs Market Revenues & Volume By Body Powered or Cable Operated for the Period 2022-2032F
- Historical Data and Forecast of Indonesia Artificial Limbs Market Revenues & Volume By Cosmetic Prosthetics for the Period 2022-2032F
- Historical Data and Forecast of Indonesia Artificial Limbs Market Revenues & Volume By Myoelectric or Electrically powered for the Period 2022-2032F
- Historical Data and Forecast of Indonesia Artificial Limbs Market Revenues & Volume By Others for the Period 2022-2032F
- Historical Data and Forecast of Indonesia Artificial Limbs Market Revenues & Volume By Material for the Period 2022-2032F
- Historical Data and Forecast of Indonesia Artificial Limbs Market Revenues & Volume By Titanium for the Period 2022-2032F
- Historical Data and Forecast of Indonesia Artificial Limbs Market Revenues & Volume By Plastics for the Period 2022-2032F
- Historical Data and Forecast of Indonesia Artificial Limbs Market Revenues & Volume By Others for the Period 2022-2032F
- Historical Data and Forecast of Indonesia Artificial Limbs Market Revenues & Volume By End User for the Period 2022-2032F
- Historical Data and Forecast of Indonesia Artificial Limbs Market Revenues & Volume By Hospitals for the Period 2022-2032F
- Historical Data and Forecast of Indonesia Artificial Limbs Market Revenues & Volume By Orthopaedic Clinics for the Period 2022-2032F
- Historical Data and Forecast of Indonesia Artificial Limbs Market Revenues & Volume By Ambulatory Surgical Centres for the Period 2022-2032F
- Historical Data and Forecast of Indonesia Artificial Limbs Market Revenues & Volume By Rehabilitation Centres for the Period 2022-2032F
- Historical Data and Forecast of Indonesia Artificial Limbs Market Revenues & Volume By Prosthetic Clinics for the Period 2022-2032F
- Indonesia Artificial Limbs Import Export Trade Statistics
- Market Opportunity Assessment By Type
- Market Opportunity Assessment By Technology
- Market Opportunity Assessment By Material
- Market Opportunity Assessment By End User
- Indonesia Artificial Limbs Top Companies Market Share
- Indonesia Artificial Limbs Competitive Benchmarking By Technical and Operational Parameters
- Indonesia Artificial Limbs Company Profiles
- Indonesia Artificial Limbs Key Strategic Recommendations
Frequently Asked Questions About the Market Study (FAQs):
6Wresearch actively monitors the Indonesia Artificial Limbs Market and publishes its comprehensive annual report, highlighting emerging trends, growth drivers, revenue analysis, and forecast outlook. Our insights help businesses to make data-backed strategic decisions with ongoing market dynamics. Our analysts track relevent industries related to the Indonesia Artificial Limbs Market, allowing our clients with actionable intelligence and reliable forecasts tailored to emerging regional needs.
Yes, we provide customisation as per your requirements. To learn more, feel free to contact us on sales@6wresearch.com
1 Executive Summary |
2 Introduction |
2.1 Key Highlights of the Report |
2.2 Report Description |
2.3 Market Scope & Segmentation |
2.4 Research Methodology |
2.5 Assumptions |
3 Indonesia Artificial Limbs Market Overview |
3.1 Indonesia Country Macro Economic Indicators |
3.2 Indonesia Artificial Limbs Market Revenues & Volume, 2022 & 2032F |
3.3 Indonesia Artificial Limbs Market - Industry Life Cycle |
3.4 Indonesia Artificial Limbs Market - Porter's Five Forces |
3.5 Indonesia Artificial Limbs Market Revenues & Volume Share, By Type, 2022 & 2032F |
3.6 Indonesia Artificial Limbs Market Revenues & Volume Share, By Technology, 2022 & 2032F |
3.7 Indonesia Artificial Limbs Market Revenues & Volume Share, By Material, 2022 & 2032F |
3.8 Indonesia Artificial Limbs Market Revenues & Volume Share, By End User, 2022 & 2032F |
4 Indonesia Artificial Limbs Market Dynamics |
4.1 Impact Analysis |
4.2 Market Drivers |
4.2.1 Increasing prevalence of limb disabilities and amputations in Indonesia due to factors like accidents, diseases, and congenital conditions. |
4.2.2 Technological advancements in artificial limb design and materials, leading to more functional and comfortable prosthetic solutions. |
4.2.3 Growing awareness and acceptance of artificial limbs among the Indonesian population, reducing stigma and increasing demand for these products. |
4.3 Market Restraints |
4.3.1 High costs associated with advanced artificial limbs, limiting accessibility for lower-income individuals. |
4.3.2 Lack of skilled professionals and facilities for fitting and customization of artificial limbs in certain regions of Indonesia. |
4.3.3 Limited insurance coverage and reimbursement policies for artificial limbs, hindering affordability for many patients. |
5 Indonesia Artificial Limbs Market Trends |
6 Indonesia Artificial Limbs Market, By Types |
6.1 Indonesia Artificial Limbs Market, By Type |
6.1.1 Overview and Analysis |
6.1.2 Indonesia Artificial Limbs Market Revenues & Volume, By Type, 2022-2032F |
6.1.3 Indonesia Artificial Limbs Market Revenues & Volume, By Lower Extremity, 2022-2032F |
6.1.4 Indonesia Artificial Limbs Market Revenues & Volume, By Upper Extremity, 2022-2032F |
6.1.5 Indonesia Artificial Limbs Market Revenues & Volume, By Compression Therapy, 2022-2032F |
6.2 Indonesia Artificial Limbs Market, By Technology |
6.2.1 Overview and Analysis |
6.2.2 Indonesia Artificial Limbs Market Revenues & Volume, By Body Powered or Cable Operated, 2022-2032F |
6.2.3 Indonesia Artificial Limbs Market Revenues & Volume, By Cosmetic Prosthetics, 2022-2032F |
6.2.4 Indonesia Artificial Limbs Market Revenues & Volume, By Myoelectric or Electrically powered, 2022-2032F |
6.2.5 Indonesia Artificial Limbs Market Revenues & Volume, By Others, 2022-2032F |
6.3 Indonesia Artificial Limbs Market, By Material |
6.3.1 Overview and Analysis |
6.3.2 Indonesia Artificial Limbs Market Revenues & Volume, By Titanium, 2022-2032F |
6.3.3 Indonesia Artificial Limbs Market Revenues & Volume, By Plastics, 2022-2032F |
6.3.4 Indonesia Artificial Limbs Market Revenues & Volume, By Others, 2022-2032F |
6.4 Indonesia Artificial Limbs Market, By End User |
6.4.1 Overview and Analysis |
6.4.2 Indonesia Artificial Limbs Market Revenues & Volume, By Hospitals, 2022-2032F |
6.4.3 Indonesia Artificial Limbs Market Revenues & Volume, By Orthopaedic Clinics, 2022-2032F |
6.4.4 Indonesia Artificial Limbs Market Revenues & Volume, By Ambulatory Surgical Centres, 2022-2032F |
6.4.5 Indonesia Artificial Limbs Market Revenues & Volume, By Rehabilitation Centres, 2022-2032F |
6.4.6 Indonesia Artificial Limbs Market Revenues & Volume, By Prosthetic Clinics, 2022-2032F |
7 Indonesia Artificial Limbs Market Import-Export Trade Statistics |
7.1 Indonesia Artificial Limbs Market Export to Major Countries |
7.2 Indonesia Artificial Limbs Market Imports from Major Countries |
8 Indonesia Artificial Limbs Market Key Performance Indicators |
8.1 Average waiting time for artificial limb fitting and customization. |
8.2 Number of facilities offering specialized services for artificial limb fittings across different regions in Indonesia. |
8.3 Percentage of individuals with limb disabilities using artificial limbs to improve mobility and quality of life. |
9 Indonesia Artificial Limbs Market - Opportunity Assessment |
9.1 Indonesia Artificial Limbs Market Opportunity Assessment, By Type, 2022 & 2032F |
9.2 Indonesia Artificial Limbs Market Opportunity Assessment, By Technology, 2022 & 2032F |
9.3 Indonesia Artificial Limbs Market Opportunity Assessment, By Material, 2022 & 2032F |
9.4 Indonesia Artificial Limbs Market Opportunity Assessment, By End User, 2022 & 2032F |
10 Indonesia Artificial Limbs Market - Competitive Landscape |
10.1 Indonesia Artificial Limbs Market Revenue Share, By Companies, 2025 |
10.2 Indonesia Artificial Limbs Market Competitive Benchmarking, By Operating and Technical Parameters |
11 Company Profiles |
12 Recommendations |
13 Disclaimer |
Global Go To Market Strategy - 2030
Export potential enables firms to identify high-growth global markets with greater confidence by combining advanced trade intelligence with a structured quantitative methodology. The framework analyzes emerging demand trends and country-level import patterns while integrating macroeconomic and trade datasets such as GDP and population forecasts, bilateral import–export flows, tariff structures, elasticity differentials between developed and developing economies, geographic distance, and import demand projections. Using weighted trade values from 2020–2024 as the base period to project country-to-country export potential for 2030, these inputs are operationalized through calculated drivers such as gravity model parameters, tariff impact factors, and projected GDP per-capita growth. Through an analysis of hidden potentials, demand hotspots, and market conditions that are most favorable to success, this method enables firms to focus on target countries, maximize returns, and global expansion with data, backed by accuracy.
By factoring in the projected importer demand gap that is currently unmet and could be potential opportunity, it identifies the potential for the Exporter (Country) among 190 countries, against the general trade analysis, which identifies the biggest importer or exporter.
To discover high-growth global markets and optimize your business strategy:
Click Here
Pricing
- Single User License$ 1,995
- Department License$ 2,400
- Site License$ 3,120
- Global License$ 3,795

Leadership Perspectives from Industry Events
Search
Thought Leadership and Analyst Meet


Our Clients
6WResearch In News
- Doha a strategic location for EV manufacturing hub: IPA Qatar
- Demand for luxury TVs surging in the GCC, says Samsung
- Empowering Growth: The Thriving Journey of Bangladesh’s Cable Industry
- Demand for luxury TVs surging in the GCC, says Samsung
- Video call with a traditional healer? Once unthinkable, it’s now common in South Africa
- Intelligent Buildings To Smooth GCC’s Path To Net Zero
Latest Reports
- New Zealand Aseptic Manufacturing Market (2026-2032)
- Netherlands Aseptic Manufacturing Market (2026-2032)
- Nauru Aseptic Manufacturing Market (2026-2032)
- Namibia Aseptic Manufacturing Market (2026-2032)
- Mozambique Aseptic Manufacturing Market (2026-2032)
- Montenegro Aseptic Manufacturing Market (2026-2032)
- Mongolia Aseptic Manufacturing Market (2026-2032)
- Monaco Aseptic Manufacturing Market (2026-2032)
- Micronesia Aseptic Manufacturing Market (2026-2032)
- Mauritius Aseptic Manufacturing Market (2026-2032)
Industry Events and Analyst Meet

HIMTEX 2026

India Refining Summit 2026

India EV Show 2026

EV tech India Expo 2026

Auto Tech Asia 2026
Whitepaper
- Middle East & Africa Commercial Security Market Click here to view more.
- Middle East & Africa Fire Safety Systems & Equipment Market Click here to view more.
- GCC Drone Market Click here to view more.
- Middle East Lighting Fixture Market Click here to view more.
- GCC Physical & Perimeter Security Market Click here to view more.