Indonesia Brush Motor Market (2026-2032) Outlook | Industry, Forecast, Size, Value, Trends, Share, Growth, Revenue, Companies & Analysis
Market Forecast By Component (Stator, Rotor / Armature, Brushes, Commutator), By Type (Permanent Magnet, Shunt - Wound, Series - Wound, Compound Wound (Shunt + Series)), By Output Power (Less than 750W o/p, Between 750W and 75kW o/p, Between 75kW and 375kW o/p, Greater than 375kW o/p), By Industry (Aerospace, Automation, Broadcast, HVAC, Material handling, Medical, Oil and Gas, Power and Energy), By Sales Channel (OEM, Aftermarket) And Competitive Landscape
| Product Code: ETC250708 | Publication Date: Aug 2023 | Updated Date: Mar 2026 | Product Type: Market Research Report | |
| Publisher: 6Wresearch | Author: Ravi Bhandari | No. of Pages: 75 | No. of Figures: 35 | No. of Tables: 20 |
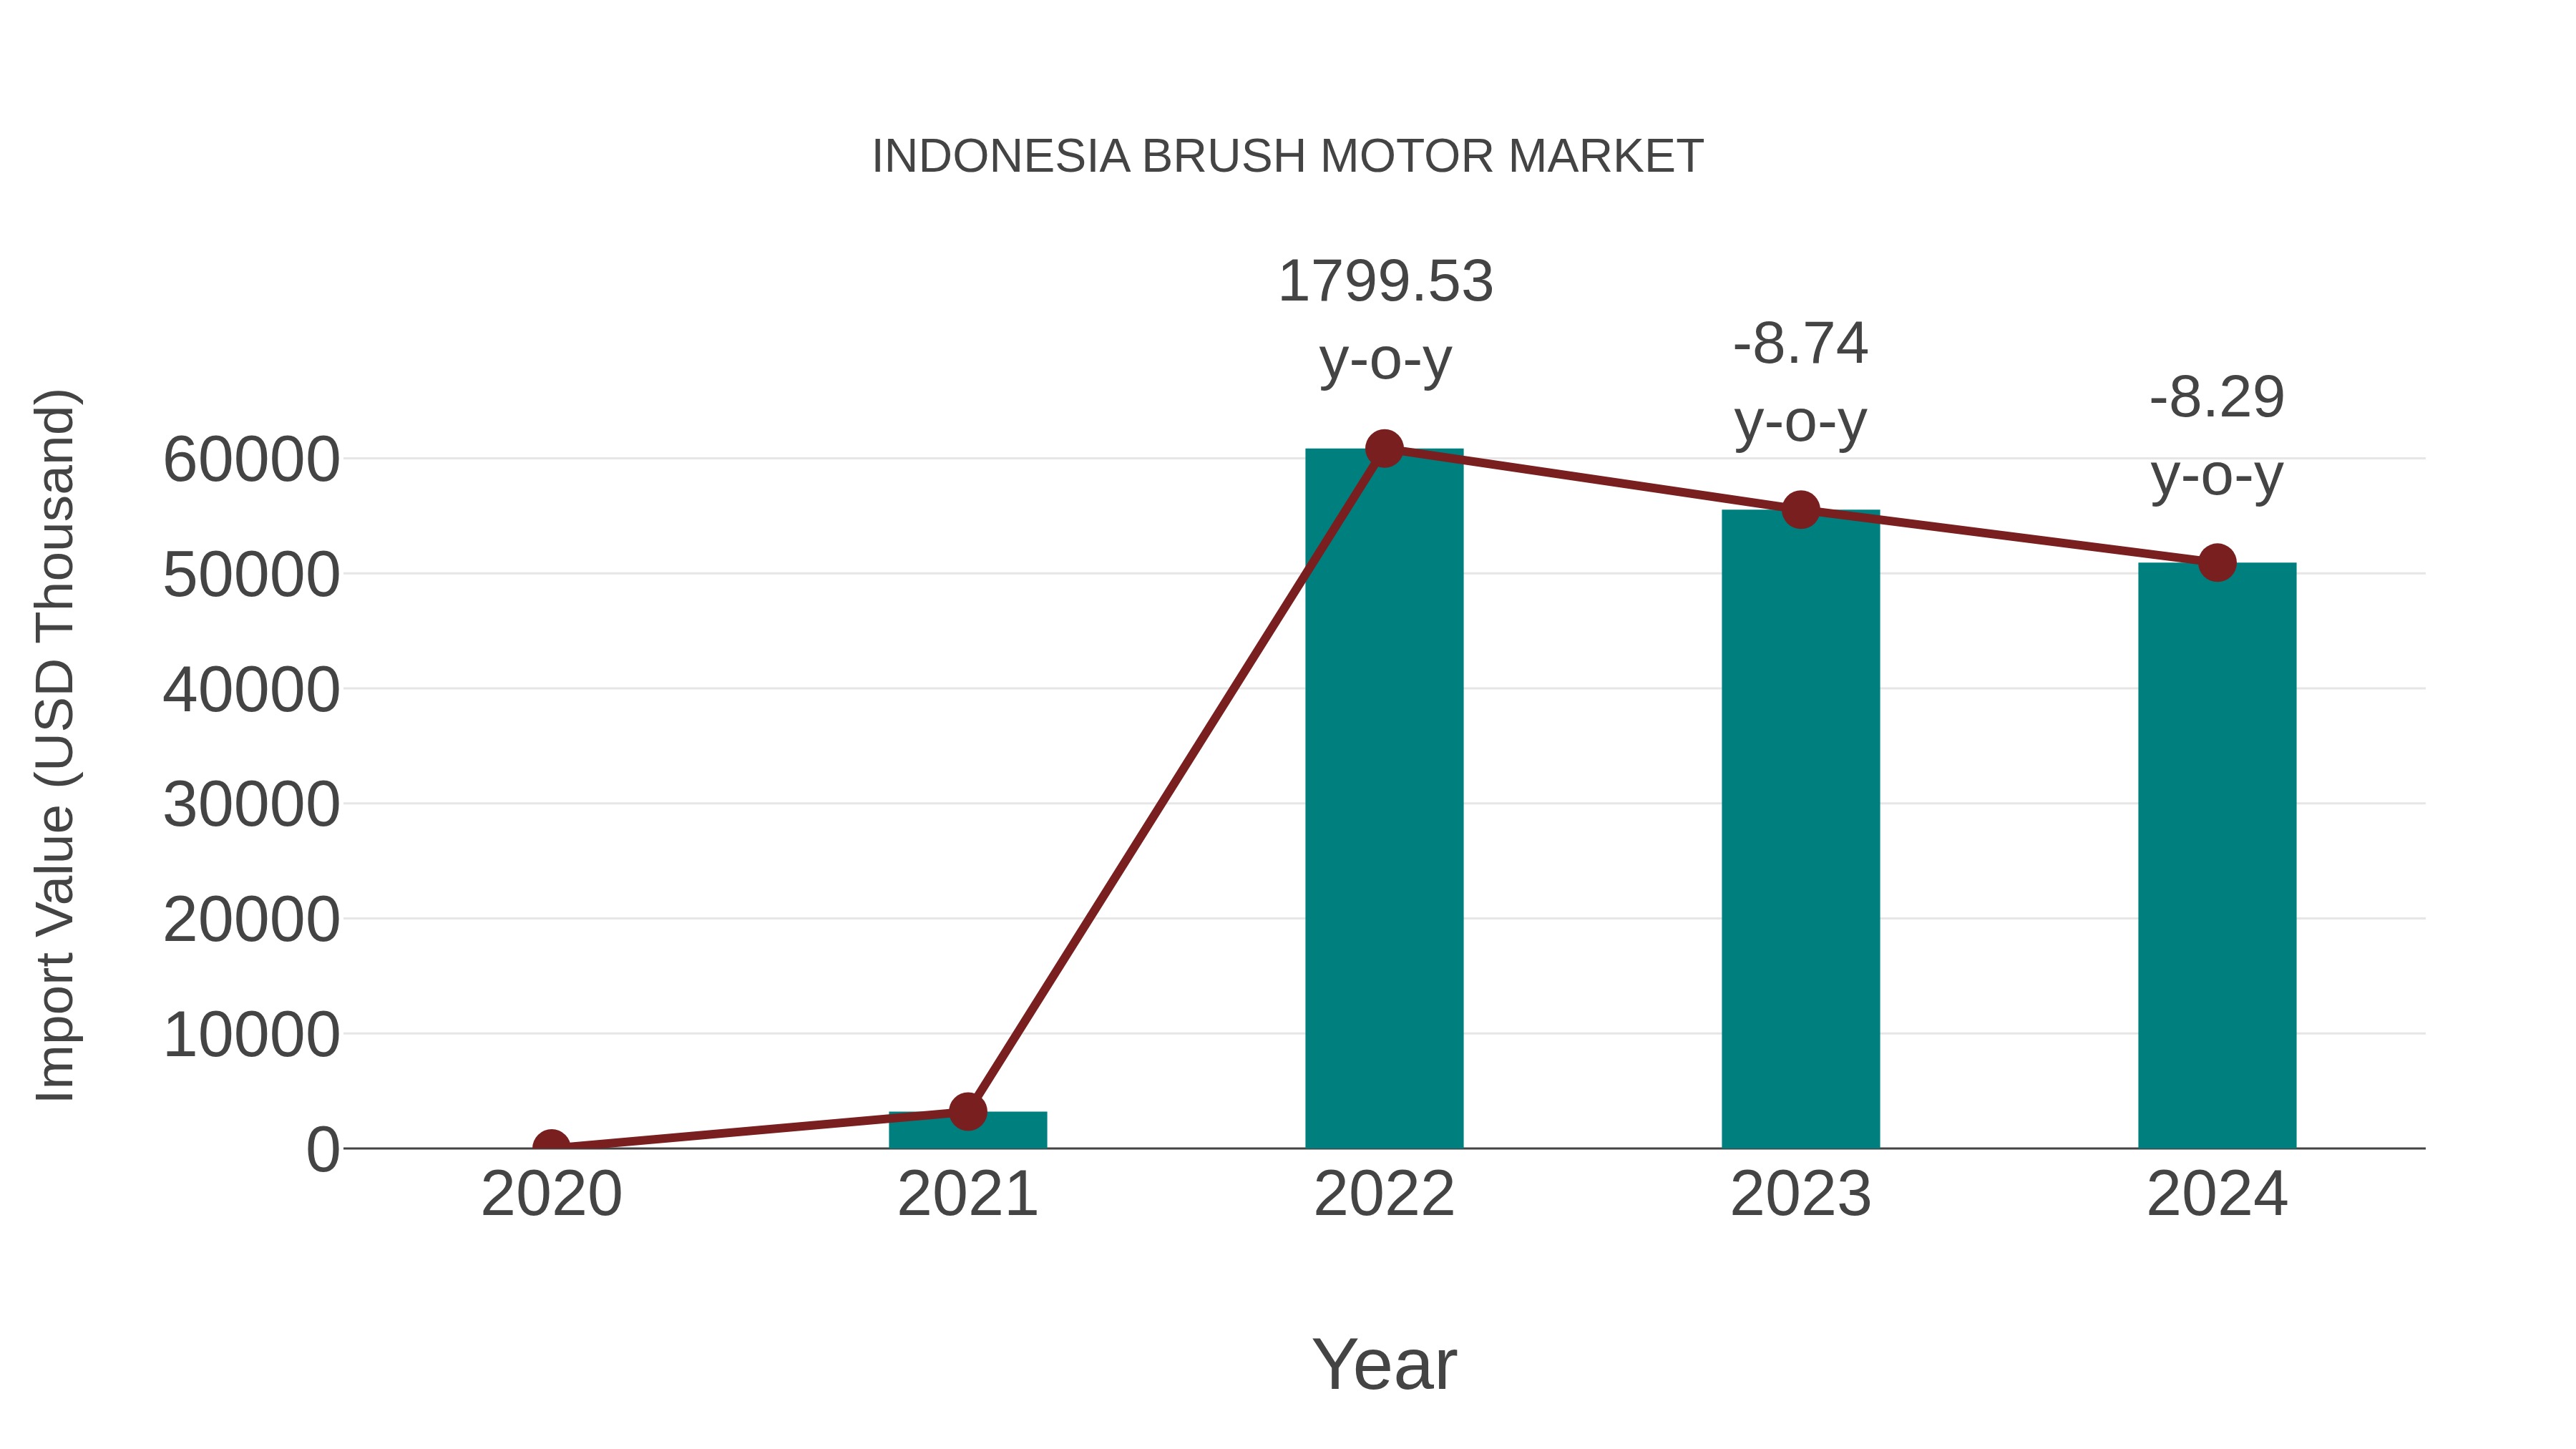
Indonesia Brush Motor Market: Import Trend Analysis
In the Indonesia brush motor market, the import trend experienced a decline from 2023 to 2024, with a growth rate of -8.29%. However, the compound annual growth rate (CAGR) for the period 2020-2024 stood at a robust 151.44%. This decline in import momentum in 2024 could be attributed to a temporary demand shift or a recalibration in trade policies affecting the market`s stability.
Indonesia Brush Motor Market Synopsis
In parallel, the brush motor market in Indonesia has experienced substantial growth, mainly attributed to the expanding automotive and electronics sectors. The increasing production of electric vehicles and consumer electronics has driven the demand for brush motors. Additionally, government initiatives to promote the adoption of electric vehicles and advancements in motor technology are expected to further boost the market in the coming years.
Drivers of the Market
The brush motor market in Indonesia is anticipated to experience significant expansion owing to the increasing adoption of electric vehicles and household appliances. The demand for brush motors is likely to surge due to their applications in various industries, such as automotive, electronics, and manufacturing.
Challenges of the Market
However, the brush motor market faces challenges related to technology advancements. As brushless motors gain popularity for their efficiency and reduced maintenance needs, traditional brush motors may face competition. Companies in the industry need to innovate and adapt to new trends to remain competitive.
COVID-19 Impact on the Market
The brush motor market in Indonesia is influenced by various industries, including automotive, electronics, and household appliances. Brush motors have been widely used in various applications due to their simplicity and cost-effectiveness. The market is expected to grow in line with the development of these industries. However, the market might have faced challenges due to the pandemic, leading to supply chain disruptions and a slowdown in industrial activities.
Key Highlights of the Report:
- Indonesia Brush Motor Market Outlook
- Market Size of Indonesia Brush Motor Market, 2025
- Forecast of Indonesia Brush Motor Market, 2032
- Historical Data and Forecast of Indonesia Brush Motor Revenues & Volume for the Period 2022-2032F
- Indonesia Brush Motor Market Trend Evolution
- Indonesia Brush Motor Market Drivers and Challenges
- Indonesia Brush Motor Price Trends
- Indonesia Brush Motor Porter's Five Forces
- Indonesia Brush Motor Industry Life Cycle
- Historical Data and Forecast of Indonesia Brush Motor Market Revenues & Volume By Component for the Period 2022-2032F
- Historical Data and Forecast of Indonesia Brush Motor Market Revenues & Volume By Stator for the Period 2022-2032F
- Historical Data and Forecast of Indonesia Brush Motor Market Revenues & Volume By Rotor / Armature for the Period 2022-2032F
- Historical Data and Forecast of Indonesia Brush Motor Market Revenues & Volume By Brushes for the Period 2022-2032F
- Historical Data and Forecast of Indonesia Brush Motor Market Revenues & Volume By Commutator for the Period 2022-2032F
- Historical Data and Forecast of Indonesia Brush Motor Market Revenues & Volume By Type for the Period 2022-2032F
- Historical Data and Forecast of Indonesia Brush Motor Market Revenues & Volume By Permanent Magnet for the Period 2022-2032F
- Historical Data and Forecast of Indonesia Brush Motor Market Revenues & Volume By Shunt - Wound for the Period 2022-2032F
- Historical Data and Forecast of Indonesia Brush Motor Market Revenues & Volume By Series - Wound for the Period 2022-2032F
- Historical Data and Forecast of Indonesia Brush Motor Market Revenues & Volume By Compound Wound (Shunt + Series) for the Period 2022-2032F
- Historical Data and Forecast of Indonesia Brush Motor Market Revenues & Volume By Output Power for the Period 2022-2032F
- Historical Data and Forecast of Indonesia Brush Motor Market Revenues & Volume By Less than 750W o/p for the Period 2022-2032F
- Historical Data and Forecast of Indonesia Brush Motor Market Revenues & Volume By Between 750W and 75kW o/p for the Period 2022-2032F
- Historical Data and Forecast of Indonesia Brush Motor Market Revenues & Volume By Between 75kW and 375kW o/p for the Period 2022-2032F
- Historical Data and Forecast of Indonesia Brush Motor Market Revenues & Volume By Greater than 375kW o/p for the Period 2022-2032F
- Historical Data and Forecast of Indonesia Brush Motor Market Revenues & Volume By Industry for the Period 2022-2032F
- Historical Data and Forecast of Indonesia Brush Motor Market Revenues & Volume By Aerospace for the Period 2022-2032F
- Historical Data and Forecast of Indonesia Brush Motor Market Revenues & Volume By Automation for the Period 2022-2032F
- Historical Data and Forecast of Indonesia Brush Motor Market Revenues & Volume By Broadcast for the Period 2022-2032F
- Historical Data and Forecast of Indonesia Brush Motor Market Revenues & Volume By HVAC for the Period 2022-2032F
- Historical Data and Forecast of Indonesia Brush Motor Market Revenues & Volume By Material handling for the Period 2022-2032F
- Historical Data and Forecast of Indonesia Brush Motor Market Revenues & Volume By Medical for the Period 2022-2032F
- Historical Data and Forecast of Indonesia Brush Motor Market Revenues & Volume By Oil and Gas for the Period 2022-2032F
- Historical Data and Forecast of Indonesia Brush Motor Market Revenues & Volume By Power and Energy for the Period 2022-2032F
- Historical Data and Forecast of Indonesia Brush Motor Market Revenues & Volume By Sales Channel for the Period 2022-2032F
- Historical Data and Forecast of Indonesia Brush Motor Market Revenues & Volume By OEM for the Period 2022-2032F
- Historical Data and Forecast of Indonesia Brush Motor Market Revenues & Volume By Aftermarket for the Period 2022-2032F
- Indonesia Brush Motor Import Export Trade Statistics
- Market Opportunity Assessment By Component
- Market Opportunity Assessment By Type
- Market Opportunity Assessment By Output Power
- Market Opportunity Assessment By Industry
- Market Opportunity Assessment By Sales Channel
- Indonesia Brush Motor Top Companies Market Share
- Indonesia Brush Motor Competitive Benchmarking By Technical and Operational Parameters
- Indonesia Brush Motor Company Profiles
- Indonesia Brush Motor Key Strategic Recommendations
Indonesia Brush Motor Market (2026-2032): FAQs
6Wresearch actively monitors the Indonesia Brush Motor Market and publishes its comprehensive annual report, highlighting emerging trends, growth drivers, revenue analysis, and forecast outlook. Our insights help businesses to make data-backed strategic decisions with ongoing market dynamics. Our analysts track relevent industries related to the Indonesia Brush Motor Market, allowing our clients with actionable intelligence and reliable forecasts tailored to emerging regional needs.
Yes, we provide customisation as per your requirements. To learn more, feel free to contact us on sales@6wresearch.com
1 Executive Summary |
2 Introduction |
2.1 Key Highlights of the Report |
2.2 Report Description |
2.3 Market Scope & Segmentation |
2.4 Research Methodology |
2.5 Assumptions |
3 Indonesia Brush Motor Market Overview |
3.1 Indonesia Country Macro Economic Indicators |
3.2 Indonesia Brush Motor Market Revenues & Volume, 2022 & 2032F |
3.3 Indonesia Brush Motor Market - Industry Life Cycle |
3.4 Indonesia Brush Motor Market - Porter's Five Forces |
3.5 Indonesia Brush Motor Market Revenues & Volume Share, By Component, 2022 & 2032F |
3.6 Indonesia Brush Motor Market Revenues & Volume Share, By Type, 2022 & 2032F |
3.7 Indonesia Brush Motor Market Revenues & Volume Share, By Output Power, 2022 & 2032F |
3.8 Indonesia Brush Motor Market Revenues & Volume Share, By Industry, 2022 & 2032F |
3.9 Indonesia Brush Motor Market Revenues & Volume Share, By Sales Channel, 2022 & 2032F |
4 Indonesia Brush Motor Market Dynamics |
4.1 Impact Analysis |
4.2 Market Drivers |
4.2.1 Increasing demand for household appliances and automotive applications using brush motors |
4.2.2 Growth in the construction and manufacturing industries in Indonesia leading to higher demand for brush motors |
4.2.3 Technological advancements in brush motor design and efficiency |
4.3 Market Restraints |
4.3.1 Competition from brushless motors which are more efficient and have longer lifespan |
4.3.2 Fluctuations in raw material prices affecting the production cost of brush motors |
4.3.3 Regulatory challenges and environmental concerns related to the use of brush motors |
5 Indonesia Brush Motor Market Trends |
6 Indonesia Brush Motor Market, By Types |
6.1 Indonesia Brush Motor Market, By Component |
6.1.1 Overview and Analysis |
6.1.2 Indonesia Brush Motor Market Revenues & Volume, By Component, 2022-2032F |
6.1.3 Indonesia Brush Motor Market Revenues & Volume, By Stator, 2022-2032F |
6.1.4 Indonesia Brush Motor Market Revenues & Volume, By Rotor / Armature, 2022-2032F |
6.1.5 Indonesia Brush Motor Market Revenues & Volume, By Brushes, 2022-2032F |
6.1.6 Indonesia Brush Motor Market Revenues & Volume, By Commutator, 2022-2032F |
6.2 Indonesia Brush Motor Market, By Type |
6.2.1 Overview and Analysis |
6.2.2 Indonesia Brush Motor Market Revenues & Volume, By Permanent Magnet, 2022-2032F |
6.2.3 Indonesia Brush Motor Market Revenues & Volume, By Shunt - Wound, 2022-2032F |
6.2.4 Indonesia Brush Motor Market Revenues & Volume, By Series - Wound, 2022-2032F |
6.2.5 Indonesia Brush Motor Market Revenues & Volume, By Compound Wound (Shunt + Series), 2022-2032F |
6.3 Indonesia Brush Motor Market, By Output Power |
6.3.1 Overview and Analysis |
6.3.2 Indonesia Brush Motor Market Revenues & Volume, By Less than 750W o/p, 2022-2032F |
6.3.3 Indonesia Brush Motor Market Revenues & Volume, By Between 750W and 75kW o/p, 2022-2032F |
6.3.4 Indonesia Brush Motor Market Revenues & Volume, By Between 75kW and 375kW o/p, 2022-2032F |
6.3.5 Indonesia Brush Motor Market Revenues & Volume, By Greater than 375kW o/p, 2022-2032F |
6.4 Indonesia Brush Motor Market, By Industry |
6.4.1 Overview and Analysis |
6.4.2 Indonesia Brush Motor Market Revenues & Volume, By Aerospace, 2022-2032F |
6.4.3 Indonesia Brush Motor Market Revenues & Volume, By Automation, 2022-2032F |
6.4.4 Indonesia Brush Motor Market Revenues & Volume, By Broadcast, 2022-2032F |
6.4.5 Indonesia Brush Motor Market Revenues & Volume, By HVAC, 2022-2032F |
6.4.6 Indonesia Brush Motor Market Revenues & Volume, By Material handling, 2022-2032F |
6.4.7 Indonesia Brush Motor Market Revenues & Volume, By Medical, 2022-2032F |
6.4.8 Indonesia Brush Motor Market Revenues & Volume, By Power and Energy, 2022-2032F |
6.4.9 Indonesia Brush Motor Market Revenues & Volume, By Power and Energy, 2022-2032F |
6.5 Indonesia Brush Motor Market, By Sales Channel |
6.5.1 Overview and Analysis |
6.5.2 Indonesia Brush Motor Market Revenues & Volume, By OEM, 2022-2032F |
6.5.3 Indonesia Brush Motor Market Revenues & Volume, By Aftermarket, 2022-2032F |
7 Indonesia Brush Motor Market Import-Export Trade Statistics |
7.1 Indonesia Brush Motor Market Export to Major Countries |
7.2 Indonesia Brush Motor Market Imports from Major Countries |
8 Indonesia Brush Motor Market Key Performance Indicators |
8.1 Average selling price (ASP) of brush motors |
8.2 Number of new product innovations or patents in brush motor technology |
8.3 Adoption rate of brush motors in emerging industries like renewable energy or robotics |
9 Indonesia Brush Motor Market - Opportunity Assessment |
9.1 Indonesia Brush Motor Market Opportunity Assessment, By Component, 2022 & 2032F |
9.2 Indonesia Brush Motor Market Opportunity Assessment, By Type, 2022 & 2032F |
9.3 Indonesia Brush Motor Market Opportunity Assessment, By Output Power, 2022 & 2032F |
9.4 Indonesia Brush Motor Market Opportunity Assessment, By Industry, 2022 & 2032F |
9.5 Indonesia Brush Motor Market Opportunity Assessment, By Sales Channel, 2022 & 2032F |
10 Indonesia Brush Motor Market - Competitive Landscape |
10.1 Indonesia Brush Motor Market Revenue Share, By Companies, 2025 |
10.2 Indonesia Brush Motor Market Competitive Benchmarking, By Operating and Technical Parameters |
11 Company Profiles |
12 Recommendations |
13 Disclaimer |
Global Go To Market Strategy - 2030
Export potential enables firms to identify high-growth global markets with greater confidence by combining advanced trade intelligence with a structured quantitative methodology. The framework analyzes emerging demand trends and country-level import patterns while integrating macroeconomic and trade datasets such as GDP and population forecasts, bilateral import–export flows, tariff structures, elasticity differentials between developed and developing economies, geographic distance, and import demand projections. Using weighted trade values from 2020–2024 as the base period to project country-to-country export potential for 2030, these inputs are operationalized through calculated drivers such as gravity model parameters, tariff impact factors, and projected GDP per-capita growth. Through an analysis of hidden potentials, demand hotspots, and market conditions that are most favorable to success, this method enables firms to focus on target countries, maximize returns, and global expansion with data, backed by accuracy.
By factoring in the projected importer demand gap that is currently unmet and could be potential opportunity, it identifies the potential for the Exporter (Country) among 190 countries, against the general trade analysis, which identifies the biggest importer or exporter.
To discover high-growth global markets and optimize your business strategy:
Click Here
Pricing
- Single User License$ 1,995
- Department License$ 2,400
- Site License$ 3,120
- Global License$ 3,795

Leadership Perspectives from Industry Events
Search
Thought Leadership and Analyst Meet


Our Clients
6WResearch In News
- India Export Attractiveness Tracker 2026
- India Air Conditioner Market Set for Strong Rebound in 2026 After Weather-Led Correction and GST-Driven Recovery: 6Wresearch
- ADAS in India: How Automatic Emergency Braking, Blind Spot Detection & Driver Monitoring are Transforming Road Safety
- Doha a strategic location for EV manufacturing hub: IPA Qatar
- Demand for luxury TVs surging in the GCC, says Samsung
- Empowering Growth: The Thriving Journey of Bangladesh’s Cable Industry
Latest Reports
- Nicaragua RPG Gaming Market (2026-2032)
- New Zealand RPG Gaming Market (2026-2032)
- Netherlands RPG Gaming Market (2026-2032)
- Nauru RPG Gaming Market (2026-2032)
- Namibia RPG Gaming Market (2026-2032)
- Mozambique RPG Gaming Market (2026-2032)
- Montenegro RPG Gaming Market (2026-2032)
- Mongolia RPG Gaming Market (2026-2032)
- Monaco RPG Gaming Market (2026-2032)
- Micronesia RPG Gaming Market (2026-2032)
Industry Events and Analyst Meet

EV India Expo 2026

HIMTEX 2026

India Refining Summit 2026

India EV Show 2026

EV tech India Expo 2026
Whitepaper
- Middle East & Africa Commercial Security Market Click here to view more.
- Middle East & Africa Fire Safety Systems & Equipment Market Click here to view more.
- GCC Drone Market Click here to view more.
- Middle East Lighting Fixture Market Click here to view more.
- GCC Physical & Perimeter Security Market Click here to view more.