Indonesia Chemotherapy Market (2026-2032) | Share, Trends, Size, Revenue, Value, Growth, Outlook, Forecast, Industry, Analysis & Companies
Market Forecast By Drug Class (Alkylating Agents, Mitotic Inhibitors, Antimetabolites, Topoisomerase Inhibitors, Antitumor Antibiotic), By Indication (Lung Cancer, Breast Cancer, Colorectal Cancer, Prostate Cancer, Stomach Cancer, Lymphoma, Leukemia, Ovarian Cancer), By Route of Drug Administration (Intravenous, Oral, Subcutaneous, Intra-Muscular, Intravesicular, Topical, Intraperitoneal, Intraventricular/Intrathecal), By End-Users (Specialty Centers, Hospitals & Clinics) And Competitive Landscape
| Product Code: ETC044948 | Publication Date: Jul 2023 | Updated Date: Jun 2026 | Product Type: Report | |
| Publisher: 6Wresearch | Author: Ravi Bhandari | No. of Pages: 70 | No. of Figures: 35 | No. of Tables: 5 |
Indonesia Chemotherapy Market Summary
The indonesia chemotherapy market was estimated at USD 261 Million in 2025 and is projected to reach USD 346 Million by 2032, growing at a CAGR of 5.6% from 2026 to 2032.
Indonesia Chemotherapy Market Growth Rate Analysis (2021-2032)
The chemotherapy market in Indonesia initially faced a decline of 0.7% in 2021, primarily due to pandemic-related disruptions that hampered healthcare access and delayed cancer treatments. However, a significant rebound began in 2022, with growth of 4.3% as healthcare facilities reopened and increased investments in cancer care infrastructure were observed. This upward trend continued with 5.2% growth in 2023, driven by heightened consumer demand for advanced treatment options and the introduction of innovative therapies. Looking ahead, the market is projected to maintain a robust pace of growth, with 5.3% in 2024 and subsequent years benefiting from ongoing digitalization in healthcare and broadening insurance coverage for chemotherapy treatments.
Indonesia Chemotherapy Market Year-wise Growth Rate and Key Drivers
This graph highlights how the Indonesia Chemotherapy Market has steadily grown over the past five years, supported by major growth factors.
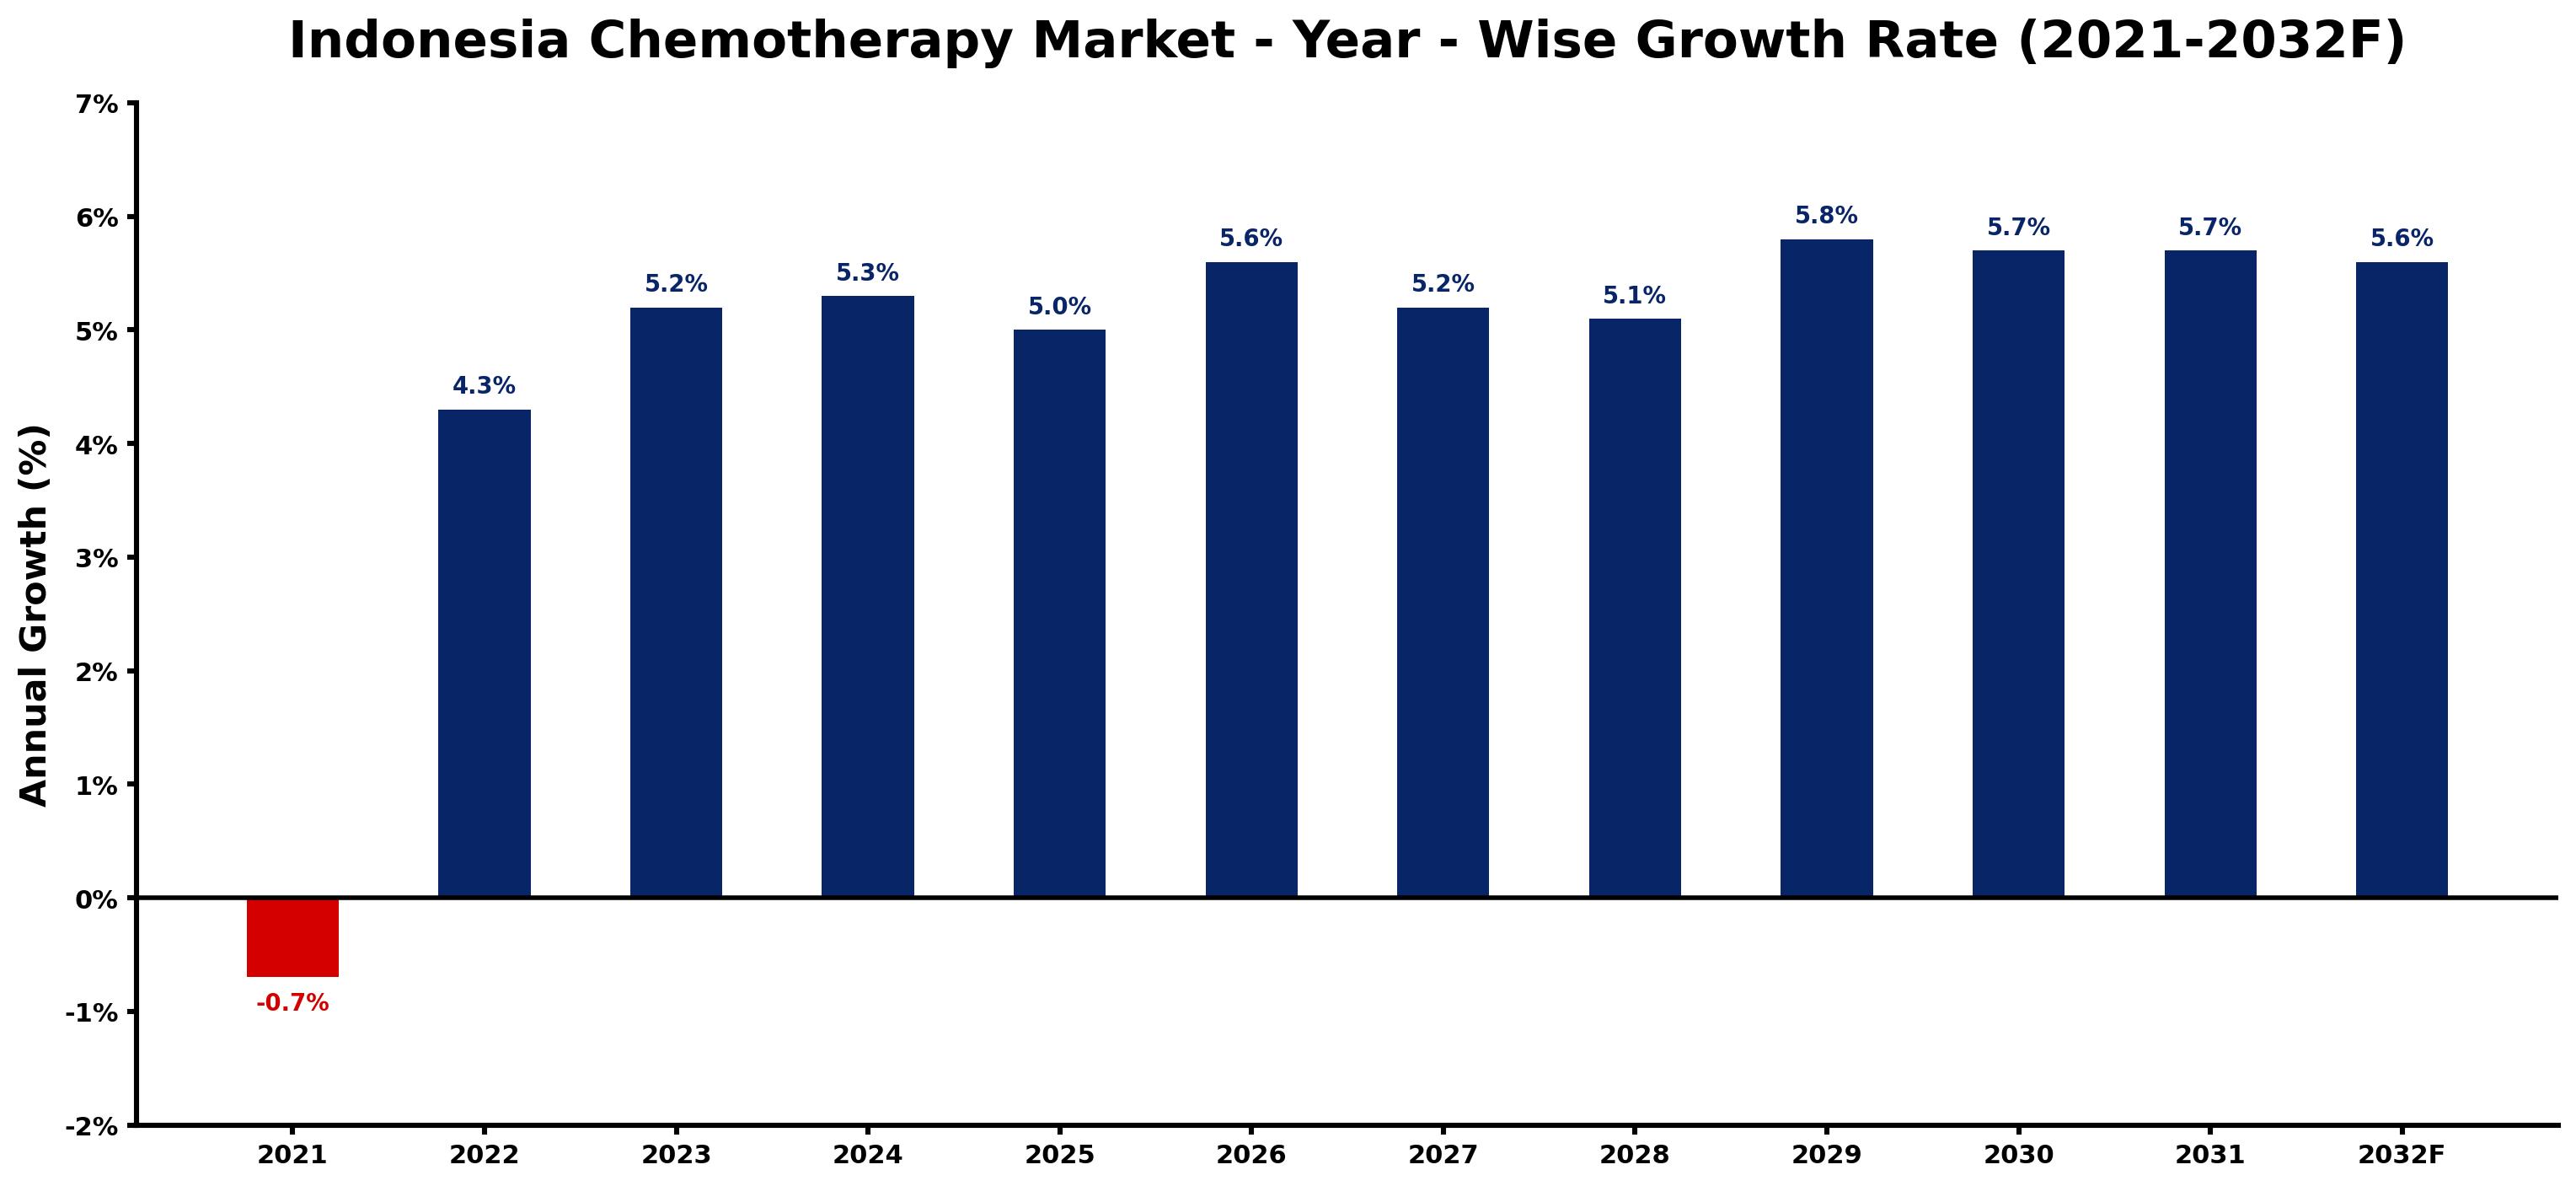
The table below presents the year wise growth rates along with the key drivers influencing the market
| Year | Growth Rate | Major Drivers |
| 2021 | -0.7% | Heightened public concern over chemotherapy side effects diminished patient enrollment in treatment programs. |
| 2022 | 4.3% | Pharmaceutical companies intensified research on chemotherapy drugs targeting specific cancers in Indonesia. |
| 2023 | 5.2% | A surge in public-private partnerships aimed at enhancing healthcare infrastructure accessibility emerged. |
| 2024 | 5.3% | Rising cancer incidences prompted healthcare providers to expand chemotherapy service offerings significantly. |
| 2025 | 5.0% | Patient education programs increased knowledge about chemotherapy effectiveness and related options. |
| 2026 | 5.6% | New healthcare policies emphasized affordability, improving chemotherapy access for low-income populations. |
| 2027 | 5.2% | Telemedicine platforms became crucial for consultation and follow-up in chemotherapy treatments. |
| 2028 | 5.1% | Local manufacturing initiatives reduced chemotherapy drug costs while ensuring consistent supply chains. |
| 2029 | 5.8% | Integration of digital health technologies streamlined patient tracking and treatment management processes. |
| 2030 | 5.7% | Research collaborations with international institutions advanced the development of novel therapies. |
| 2031 | 5.7% | Growing emphasis on personalized medicine shifted the chemotherapy landscape toward customized treatments. |
| 2032 | 5.6% | Healthcare collaborations enhanced multidisciplinary approaches, creating comprehensive cancer treatment centers. |
Note - Market size estimations and growth projections presented in this report are based on 6Wresearch's advanced forecasting approach, validated with industry datasets as of June 2026.
Indonesia Chemotherapy Market Synopsis
The Indonesia Chemotherapy Market is projected to reach 5.6% and witness significant growth during the forecast period (2026-2032). This anticipated growth is primarily driven by the increasing incidence of cancer cases, the rise in government initiatives towards enhancing healthcare services, and substantial investments in research and development activities. Additionally, the availability of cost-effective generic drugs is expected to contribute to an expanding market landscape. However, challenges such as high costs associated with advanced treatment options and strict government regulations may pose potential restraints on market growth.
Indonesia Chemotherapy Market Growth Drivers
The growth of the Indonesia Chemotherapy Market can be attributed to several key factors:
- The increasing prevalence of cancer in Indonesia necessitates effective chemotherapy treatments, propelling demand across various patient demographics.
- Government initiatives focused on healthcare improvement, including cancer awareness programs and preventive measures, are contributing to a more favorable market environment.
- Major investments in R&D by companies aiming to innovate treatment protocols are leading to advanced therapies, enhancing patient outcomes.
- The influx of multinational corporations into the Indonesian healthcare market is expected to enhance the availability of chemotherapy drugs, making them more accessible and affordable.
- Growth in the number of healthcare facilities and oncology centers across Indonesia supports increased patient access to chemotherapy treatments.
Indonesia Chemotherapy Market Challenges and Restraints
Despite the positive outlook, the Indonesia Chemotherapy Market faces certain challenges that could hinder its expansion:
- High costs associated with advanced chemotherapy treatments may limit the accessibility for lower-income segments of the population, creating disparities in treatment availability.
- Stringent government regulations surrounding drug approvals and market entry can pose significant hurdles for new entrants in the chemotherapy sector.
- Limited public awareness regarding cancer treatments and prevention in certain regions may affect the early detection and treatment uptake of chemotherapy.
- The variability in healthcare infrastructure across urban and rural areas may contribute to unequal access to chemotherapy services.
- Potential shortages of trained healthcare professionals in oncology could affect the quality of care and treatment delivery for chemotherapy patients.
Indonesia Chemotherapy Market Investment Opportunities
The Indonesia Chemotherapy Market offers various investment opportunities that can foster growth and development:
- Investors may consider partnerships with local manufacturers to address the growing demand for generic chemotherapy drugs, which are increasingly sought after for their lower costs.
- Development of biosimilars presents a unique opportunity for healthcare companies to cater to niche segments within the chemotherapy market.
- Strategic investments in oncology research and clinical trials are essential to advance new treatment methodologies and expand the current product offerings.
- Government-backed healthcare initiatives create avenues for public-private partnerships, promoting infrastructural development in oncology care.
- Leveraging technology in patient management systems can enhance treatment adherence and monitoring, improving overall patient experiences.
Indonesia Chemotherapy Market Government Investment and Initiatives
The Indonesian government has recognized the importance of addressing the cancer burden and is actively investing in initiatives aimed at improving the chemotherapy landscape:
- Public funding for cancer prevention and treatment programs is on the rise, contributing to early detection and increased healthcare accessibility.
- The government is implementing healthcare reforms that prioritize oncology services, aiming to reduce the incidence of late-stage cancer diagnoses.
- Policy frameworks are being established to streamline drug approval processes, thereby encouraging the entry of innovative chemotherapy products into the market.
- Capacity-building initiatives for oncology healthcare professionals are being launched to ensure a skilled workforce capable of delivering advanced care.
- Collaboration with international organizations and NGOs is fostering the development of comprehensive cancer care programs tailored to local needs.
Indonesia Chemotherapy Market Latest Developments (May 2025 - June 2026)
Recent developments within the Indonesia Chemotherapy Market indicate a dynamic industry landscape. The focus has been on the integration of advanced treatment protocols and enhanced patient support systems. A surge in local manufacturing capabilities has been observed, emphasizing the availability of cost-effective chemotherapy drugs in rural and underserved areas. The government has also taken steps to reinforce regulatory processes to expedite approvals for new therapies, thereby encouraging innovation. Initiatives aimed at public awareness and education on cancer prevention are being prioritized, ensuring that a broader segment of the population is informed about treatment options. Additionally, collaborations between local healthcare entities and international research organizations are paving the way for groundbreaking clinical trials and research advancements.
Indonesia Chemotherapy Market - Key Attractiveness of the Report
- 10 Years of Market Numbers
- Historical Data Starting from 2022 to 2025
- Base Year: 2025
- Forecast Data until 2032
- Key Performance Indicators Impacting the Market
- Major Upcoming Developments and Projects
Key Highlights of the Report:
- Indonesia Chemotherapy? Market Outlook
- Market Size of Indonesia Chemotherapy? Market, 2025
- Forecast of Indonesia Chemotherapy? Market, 2032F
- Historical Data and Forecast of Indonesia Chemotherapy? Revenues & Volume for the Period 2022-2032F
- Indonesia Chemotherapy? Market Trend Evolution
- Indonesia Chemotherapy? Market Drivers and Challenges
- Indonesia Chemotherapy? Price Trends
- Indonesia Chemotherapy? Porter's Five Forces
- Indonesia Chemotherapy? Industry Life Cycle
- Historical Data and Forecast of Indonesia Chemotherapy? Market Revenues & Volume By Drug Class for the Period 2022-2032F
- Historical Data and Forecast of Indonesia Chemotherapy? Market Revenues & Volume By Alkylating Agents for the Period 2022-2032F
- Historical Data and Forecast of Indonesia Chemotherapy? Market Revenues & Volume By Mitotic Inhibitors for the Period 2022-2032F
- Historical Data and Forecast of Indonesia Chemotherapy? Market Revenues & Volume By Antimetabolites for the Period 2022-2032F
- Historical Data and Forecast of Indonesia Chemotherapy? Market Revenues & Volume By Topoisomerase Inhibitors for the Period 2022-2032F
- Historical Data and Forecast of Indonesia Chemotherapy? Market Revenues & Volume By Antitumor Antibiotic for the Period 2022-2032F
- Historical Data and Forecast of Indonesia Chemotherapy? Market Revenues & Volume By Indication for the Period 2022-2032F
- Historical Data and Forecast of Indonesia Chemotherapy? Market Revenues & Volume By Lung Cancer for the Period 2022-2032F
- Historical Data and Forecast of Indonesia Chemotherapy? Market Revenues & Volume By Breast Cancer for the Period 2022-2032F
- Historical Data and Forecast of Indonesia Chemotherapy? Market Revenues & Volume By Colorectal Cancer for the Period 2022-2032F
- Historical Data and Forecast of Indonesia Chemotherapy? Market Revenues & Volume By Prostate Cancer for the Period 2022-2032F
- Historical Data and Forecast of Indonesia Chemotherapy? Market Revenues & Volume By Stomach Cancer for the Period 2022-2032F
- Historical Data and Forecast of Indonesia Chemotherapy? Market Revenues & Volume By Lymphoma for the Period 2022-2032F
- Historical Data and Forecast of Indonesia Chemotherapy? Market Revenues & Volume By Leukemia for the Period 2022-2032F
- Historical Data and Forecast of Indonesia Chemotherapy? Market Revenues & Volume By Ovarian Cancer for the Period 2022-2032F
- Historical Data and Forecast of Indonesia Chemotherapy? Market Revenues & Volume By Route of Drug Administration for the Period 2022-2032F
- Historical Data and Forecast of Indonesia Chemotherapy? Market Revenues & Volume By Intravenous for the Period 2022-2032F
- Historical Data and Forecast of Indonesia Chemotherapy? Market Revenues & Volume By Oral for the Period 2022-2032F
- Historical Data and Forecast of Indonesia Chemotherapy? Market Revenues & Volume By Subcutaneous for the Period 2022-2032F
- Historical Data and Forecast of Indonesia Chemotherapy? Market Revenues & Volume By Intra-Muscular for the Period 2022-2032F
- Historical Data and Forecast of Indonesia Chemotherapy? Market Revenues & Volume By Intravesicular for the Period 2022-2032F
- Historical Data and Forecast of Indonesia Chemotherapy? Market Revenues & Volume By Topical for the Period 2022-2032F
- Historical Data and Forecast of Indonesia Chemotherapy? Market Revenues & Volume By Intraperitoneal for the Period 2022-2032F
- Historical Data and Forecast of Indonesia Chemotherapy? Market Revenues & Volume By Intraventricular/Intrathecal for the Period 2022-2032F
- Historical Data and Forecast of Indonesia Chemotherapy? Market Revenues & Volume By End-Users for the Period 2022-2032F
- Historical Data and Forecast of Indonesia Chemotherapy? Market Revenues & Volume By Specialty Centers for the Period 2022-2032F
- Historical Data and Forecast of Indonesia Chemotherapy? Market Revenues & Volume By Hospitals & Clinics for the Period 2022-2032F
- Indonesia Chemotherapy? Import Export Trade Statistics
- Market Opportunity Assessment By Drug Class
- Market Opportunity Assessment By Indication
- Market Opportunity Assessment By Route of Drug Administration
- Market Opportunity Assessment By End-Users
- Indonesia Chemotherapy? Top Companies Market Share
- Indonesia Chemotherapy? Competitive Benchmarking By Technical and Operational Parameters
- Indonesia Chemotherapy? Company Profiles
- Indonesia Chemotherapy? Key Strategic Recommendations
Frequently Asked Questions About the Market Study (FAQs):
Key drivers include the increased incidence of cancer, government healthcare initiatives, and investments in research and development.
Challenges include high treatment costs, stringent regulatory frameworks, and disparities in healthcare access across different regions.
The government is investing in public health initiatives, enhancing healthcare infrastructure, and streamlining drug approval processes to improve chemotherapy access.
Investment opportunities include partnerships with local manufacturers, advances in biosimilars, and development of clinical research initiatives.
6Wresearch actively monitors the Indonesia Chemotherapy Market and publishes its comprehensive annual report, highlighting emerging trends, growth drivers, revenue analysis, and forecast outlook. Our insights help businesses to make data-backed strategic decisions with ongoing market dynamics. Our analysts track relevent industries related to the Indonesia Chemotherapy Market, allowing our clients with actionable intelligence and reliable forecasts tailored to emerging regional needs.
Yes, we provide customisation as per your requirements. To learn more, feel free to contact us on sales@6wresearch.com
1 Executive Summary |
2 Introduction |
2.1 Key Highlights of the Report |
2.2 Report Description |
2.3 Market Scope & Segmentation |
2.4 Research Methodology |
2.5 Assumptions |
3 Indonesia Chemotherapy Market Overview |
3.1 Indonesia Country Macro Economic Indicators |
3.2 Indonesia Chemotherapy Market Revenues & Volume, 2022 & 2032F |
3.3 Indonesia Chemotherapy Market - Industry Life Cycle |
3.4 Indonesia Chemotherapy Market - Porter's Five Forces |
3.5 Indonesia Chemotherapy Market Revenues & Volume Share, By Drug Class, 2022 & 2032F |
3.6 Indonesia Chemotherapy Market Revenues & Volume Share, By Indication, 2022 & 2032F |
3.7 Indonesia Chemotherapy Market Revenues & Volume Share, By Route of Drug Administration, 2022 & 2032F |
3.8 Indonesia Chemotherapy Market Revenues & Volume Share, By End-Users, 2022 & 2032F |
4 Indonesia Chemotherapy Market Dynamics |
4.1 Impact Analysis |
4.2 Market Drivers |
4.3 Market Restraints |
5 Indonesia Chemotherapy Market Trends |
6 Indonesia Chemotherapy Market, By Types |
6.1 Indonesia Chemotherapy Market, By Drug Class |
6.1.1 Overview and Analysis |
6.1.2 Indonesia Chemotherapy Market Revenues & Volume, By Drug Class, 2022-2032F |
6.1.3 Indonesia Chemotherapy Market Revenues & Volume, By Alkylating Agents, 2022-2032F |
6.1.4 Indonesia Chemotherapy Market Revenues & Volume, By Mitotic Inhibitors, 2022-2032F |
6.1.5 Indonesia Chemotherapy Market Revenues & Volume, By Antimetabolites, 2022-2032F |
6.1.6 Indonesia Chemotherapy Market Revenues & Volume, By Topoisomerase Inhibitors, 2022-2032F |
6.1.7 Indonesia Chemotherapy Market Revenues & Volume, By Antitumor Antibiotic, 2022-2032F |
6.2 Indonesia Chemotherapy Market, By Indication |
6.2.1 Overview and Analysis |
6.2.2 Indonesia Chemotherapy Market Revenues & Volume, By Lung Cancer, 2022-2032F |
6.2.3 Indonesia Chemotherapy Market Revenues & Volume, By Breast Cancer, 2022-2032F |
6.2.4 Indonesia Chemotherapy Market Revenues & Volume, By Colorectal Cancer, 2022-2032F |
6.2.5 Indonesia Chemotherapy Market Revenues & Volume, By Prostate Cancer, 2022-2032F |
6.2.6 Indonesia Chemotherapy Market Revenues & Volume, By Stomach Cancer, 2022-2032F |
6.2.7 Indonesia Chemotherapy Market Revenues & Volume, By Lymphoma, 2022-2032F |
6.2.8 Indonesia Chemotherapy Market Revenues & Volume, By Ovarian Cancer, 2022-2032F |
6.2.9 Indonesia Chemotherapy Market Revenues & Volume, By Ovarian Cancer, 2022-2032F |
6.3 Indonesia Chemotherapy Market, By Route of Drug Administration |
6.3.1 Overview and Analysis |
6.3.2 Indonesia Chemotherapy Market Revenues & Volume, By Intravenous, 2022-2032F |
6.3.3 Indonesia Chemotherapy Market Revenues & Volume, By Oral, 2022-2032F |
6.3.4 Indonesia Chemotherapy Market Revenues & Volume, By Subcutaneous, 2022-2032F |
6.3.5 Indonesia Chemotherapy Market Revenues & Volume, By Intra-Muscular, 2022-2032F |
6.3.6 Indonesia Chemotherapy Market Revenues & Volume, By Intravesicular, 2022-2032F |
6.3.7 Indonesia Chemotherapy Market Revenues & Volume, By Topical, 2022-2032F |
6.3.8 Indonesia Chemotherapy Market Revenues & Volume, By Intraventricular/Intrathecal, 2022-2032F |
6.3.9 Indonesia Chemotherapy Market Revenues & Volume, By Intraventricular/Intrathecal, 2022-2032F |
6.4 Indonesia Chemotherapy Market, By End-Users |
6.4.1 Overview and Analysis |
6.4.2 Indonesia Chemotherapy Market Revenues & Volume, By Specialty Centers, 2022-2032F |
6.4.3 Indonesia Chemotherapy Market Revenues & Volume, By Hospitals & Clinics, 2022-2032F |
7 Indonesia Chemotherapy Market Import-Export Trade Statistics |
7.1 Indonesia Chemotherapy Market Export to Major Countries |
7.2 Indonesia Chemotherapy Market Imports from Major Countries |
8 Indonesia Chemotherapy Market Key Performance Indicators |
9 Indonesia Chemotherapy Market - Opportunity Assessment |
9.1 Indonesia Chemotherapy Market Opportunity Assessment, By Drug Class, 2022 & 2032F |
9.2 Indonesia Chemotherapy Market Opportunity Assessment, By Indication, 2022 & 2032F |
9.3 Indonesia Chemotherapy Market Opportunity Assessment, By Route of Drug Administration, 2022 & 2032F |
9.4 Indonesia Chemotherapy Market Opportunity Assessment, By End-Users, 2022 & 2032F |
10 Indonesia Chemotherapy Market - Competitive Landscape |
10.1 Indonesia Chemotherapy Market Revenue Share, By Companies, 2025 |
10.2 Indonesia Chemotherapy Market Competitive Benchmarking, By Operating and Technical Parameters |
11 Company Profiles |
12 Recommendations |
13 Disclaimer |
Global Go To Market Strategy - 2030
Export potential enables firms to identify high-growth global markets with greater confidence by combining advanced trade intelligence with a structured quantitative methodology. The framework analyzes emerging demand trends and country-level import patterns while integrating macroeconomic and trade datasets such as GDP and population forecasts, bilateral import–export flows, tariff structures, elasticity differentials between developed and developing economies, geographic distance, and import demand projections. Using weighted trade values from 2020–2024 as the base period to project country-to-country export potential for 2030, these inputs are operationalized through calculated drivers such as gravity model parameters, tariff impact factors, and projected GDP per-capita growth. Through an analysis of hidden potentials, demand hotspots, and market conditions that are most favorable to success, this method enables firms to focus on target countries, maximize returns, and global expansion with data, backed by accuracy.
By factoring in the projected importer demand gap that is currently unmet and could be potential opportunity, it identifies the potential for the Exporter (Country) among 190 countries, against the general trade analysis, which identifies the biggest importer or exporter.
To discover high-growth global markets and optimize your business strategy:
Click Here
Pricing
- Single User License$ 1,995
- Department License$ 2,400
- Site License$ 3,120
- Global License$ 3,795

Leadership Perspectives from Industry Events
Search
Thought Leadership and Analyst Meet


Our Clients
6WResearch In News
- India Air Conditioner Market Set for Strong Rebound in 2026 After Weather-Led Correction and GST-Driven Recovery: 6Wresearch
- ADAS in India: How Automatic Emergency Braking, Blind Spot Detection & Driver Monitoring are Transforming Road Safety
- Doha a strategic location for EV manufacturing hub: IPA Qatar
- Demand for luxury TVs surging in the GCC, says Samsung
- Empowering Growth: The Thriving Journey of Bangladesh’s Cable Industry
- Demand for luxury TVs surging in the GCC, says Samsung
Latest Reports
- Poland Fire Protection Systems Market (2026-2032)
- Cape Verde Portable Hand-Thrown Extinguisher Market (2026-2032)
- Canada Portable Hand-Thrown Extinguisher Market (2026-2032)
- Cameroon Portable Hand-Thrown Extinguisher Market (2026-2032)
- Burundi Portable Hand-Thrown Extinguisher Market (2026-2032)
- Burkina Faso Portable Hand-Thrown Extinguisher Market (2026-2032)
- Bulgaria Portable Hand-Thrown Extinguisher Market (2026-2032)
- Brunei Portable Hand-Thrown Extinguisher Market (2026-2032)
- Botswana Portable Hand-Thrown Extinguisher Market (2026-2032)
- Bosnia and Herzegovina Portable Hand-Thrown Extinguisher Market (2026-2032)
Industry Events and Analyst Meet

HIMTEX 2026

India Refining Summit 2026

India EV Show 2026

EV tech India Expo 2026

Auto Tech Asia 2026
Whitepaper
- Middle East & Africa Commercial Security Market Click here to view more.
- Middle East & Africa Fire Safety Systems & Equipment Market Click here to view more.
- GCC Drone Market Click here to view more.
- Middle East Lighting Fixture Market Click here to view more.
- GCC Physical & Perimeter Security Market Click here to view more.