Indonesia Chlor Alkali Market (2026-2032) Outlook | Industry, Size, Growth, Share, Trends, Value, Analysis, Companies, Revenue & Forecast
Market Forecast By Product (Caustic Soda, Chlorine, Soda Ash), By Production Process (Membrane Cell, Diaphragm Cell, Other Production Processes), By Application (Pulp and Paper, Organic Chemical, Inorganic Chemical, Soap and Detergent, Alumina, Textile, Other ) And Competitive Landscape
| Product Code: ETC193000 | Publication Date: Jul 2023 | Updated Date: Jun 2026 | Product Type: Market Research Report | |
| Publisher: 6Wresearch | Author: Ravi Bhandari | No. of Pages: 60 | No. of Figures: 40 | No. of Tables: 7 |
Indonesia Chlor Alkali Market Size, Share & Growth Rate
The Indonesia Chlor Alkali Market was estimated at USD 282 Million in 2025 and is projected to reach USD 373 Million by 2032, growing at a CAGR of 4.1% from 2026 to 2032. This growth trajectory is driven by increasing demand for chlorine derivatives across essential sectors such as food & beverage, water treatment, and the rapidly expanding palm oil industry. Additionally, a rising middle class with greater purchasing power is expected to further stimulate consumption in personal care products, which rely heavily on caustic soda and chlorine.
Indonesia Chlor Alkali Market Growth Rate Analysis (2021-2032)
In the Indonesia chlor alkali market, growth has rebounded from a slight decline of 0.5% in 2021, reflecting broader economic recovery and increased industrial activity. The market gained momentum with a 4.2% growth in 2022, further accelerating to 5.3% in 2023. This upward trend is fueled by rising consumer demand in sectors such as water treatment, textiles, and healthcare, alongside significant investments in infrastructure and technology. Projections for 2024 suggest a continued rise, with growth reaching 5.5%. As digitalization advances and energy transition initiatives gain traction, the chlor alkali sector is poised for sustained expansion, with anticipated growth rates stabilizing around 5% in the coming years.
Indonesia Chlor Alkali Market Year-wise Growth Rate and Key Drivers
This graph highlights how the Indonesia Chlor Alkali Market has steadily grown over the past five years, supported by major growth factors.
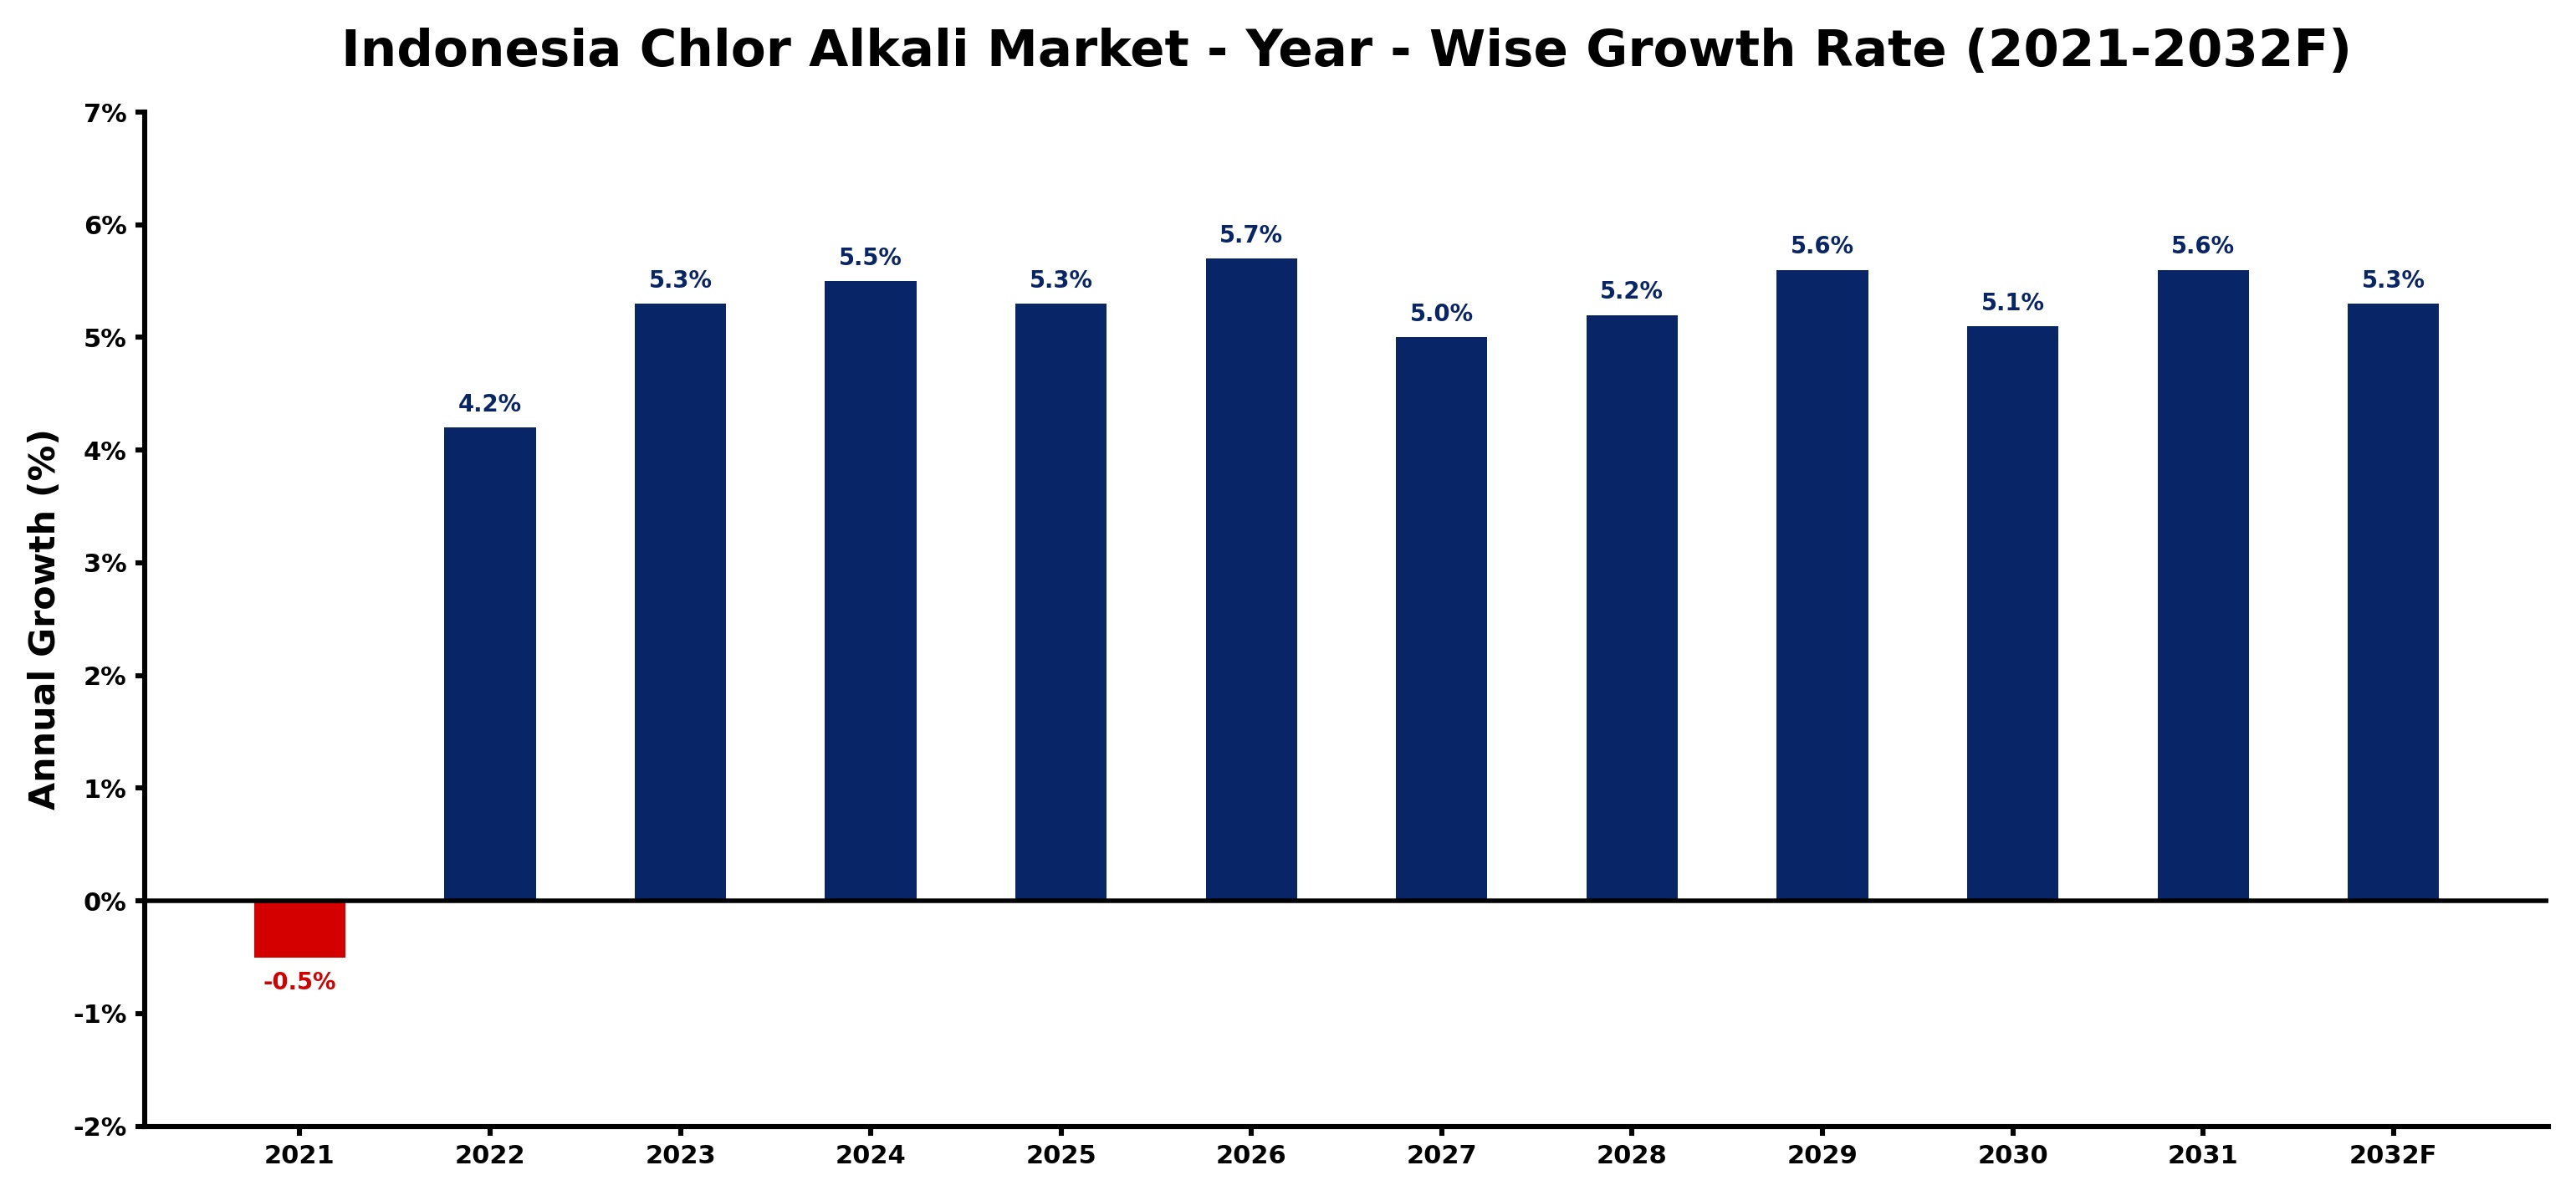
The table below presents the year‑wise growth rates along with the key drivers influencing the market
| Year | Growth Rate | Major Drivers |
| 2021 | -0.5% | Supply chain disruptions limited production |
| 2022 | 4.2% | Increased industrial demand for chemicals |
| 2023 | 5.3% | Infrastructure investments enhanced capacity |
| 2024 | 5.5% | Rising consumer demand for chlorine |
| 2025 | 5.3% | Technological advancements improved efficiency |
| 2026 | 5.7% | Environmental regulations spurred innovation |
| 2027 | 5.0% | Export opportunities expanded market reach |
| 2028 | 5.2% | Sustainability initiatives attracted investments |
| 2029 | 5.6% | Strategic partnerships enhanced distribution networks |
| 2030 | 5.1% | Market diversification increased resilience |
| 2031 | 5.6% | R&D investments fostered product innovation |
| 2032 | 5.3% | Growing applications in various industries |
Note - Market size estimations and growth projections presented in this report are based on 6Wresearch’s advanced forecasting approach, validated with industry datasets as of June 2026.
Indonesia Chlor Alkali Market Synopsis
The chlor alkali market in Indonesia is poised for significant development, spurred by robust industrial demands in key sectors. With the country being a major player in palm oil production, the need for caustic soda has become critical, further bolstering the market's growth prospects.
Recent trends indicate a growing reliance on chlorine derivatives in soap manufacturing, spurred by increasing disposable incomes and an expanding consumer base. Government initiatives to enhance industrial infrastructure and digital payment systems are also fostering favorable conditions for market expansion.
Indonesia Chlor Alkali Market Key Takeaways
- Significant CAGR of 4.1% anticipated from 2026 to 2032, reflecting rising industrial demand.
- High consumption rates driven by the food & beverage and palm oil sectors.
- Government-backed infrastructure development initiatives are positively influencing market dynamics.
- Technological advancements, particularly automation, are optimizing manufacturing processes.
- Increasing investment in production capacity aims to reduce import dependence and foster local supply chains.
Evaluation of Restraints in Indonesia Chlor Alkali Market
Despite the optimistic outlook, the Indonesia chlor alkali market faces certain challenges. The COVID-19 pandemic severely disrupted supply chains and reduced demand from critical sectors, notably the petrochemical industry. These factors have constrained production capacities and profit margins for major players. However, as Indonesia reopens and recovers economically, the market is expected to rebound, albeit with careful monitoring of potential future disruptions.
Indonesia Chlor Alkali Market Trends
Emerging trends in the Indonesia chlor alkali market include a notable shift toward sustainable practices and eco-friendly manufacturing methods. Companies are increasingly adopting automation technologies, enhancing operational efficiencies while minimizing their carbon footprint. Moreover, the soap manufacturing sector is witnessing a surge in demand for chlorine derivatives, driven by a growing emphasis on personal care products amid rising living standards.
Indonesia Chlor Alkali Market Opportunities
The market offers robust opportunities for investment, particularly in expanding production capacities to meet local demand. Additionally, the increasing focus on sustainable practices opens avenues for innovations in manufacturing processes. Collaborative ventures between the government and private sector can further catalyze development, enabling access to cutting-edge technologies and expanding product applications in various industries.
Government Initiatives in the Indonesia Chlor Alkali Market
The Indonesian government is actively promoting the development of industrial infrastructure, which is crucial for the chlor alkali sector. Various initiatives aimed at improving industrial policies, enhancing financial inclusivity, and fostering domestic investments are gaining traction. These efforts aim to create a conducive environment for growth in the chlor alkali market, thereby supporting both local manufacturers and international investors.
Future Insights of the Indonesia Chlor Alkali Market
Looking ahead to 2026-2032, the Indonesia chlor alkali market is expected to continue its upward trajectory, primarily driven by expanding end-user industries. Innovations in manufacturing, coupled with government support, will likely enhance production capabilities and sustainability practices. The anticipated growth in the middle class will further drive consumer demand for products relying on chlor alkali derivatives, reinforcing market prospects.
Indonesia Chlor Alkali Market Latest Developments (May 2025 - June 2026)
In recent months, the Indonesia chlor alkali market has seen a heightened focus on expanding production capacities. Many companies are investing in modernization initiatives, utilizing advanced technologies to streamline processes. Additionally, there has been an increase in collaborative efforts among industry players and government bodies to enhance regulatory frameworks and promote sustainable practices within the sector.
Indonesia Chlor Alkali Market - Key Attractiveness of the Report
- 10 Years of Market Numbers
- Historical Data Starting from 2022 to 2025
- Base Year: 2025
- Forecast Data until 2032
- Key Performance Indicators Impacting the Market
- Major Upcoming Developments and Projects
Key Highlights of the Report:
- Indonesia Chlor Alkali Market Outlook
- Market Size of Indonesia Chlor Alkali Market, 2025
- Forecast of Indonesia Chlor Alkali Market, 2032
- Historical Data and Forecast of Indonesia Chlor Alkali Revenues & Volume for the Period 2022-2032F
- Indonesia Chlor Alkali Market Trend Evolution
- Indonesia Chlor Alkali Market Drivers and Challenges
- Indonesia Chlor Alkali Price Trends
- Indonesia Chlor Alkali Porter's Five Forces
- Indonesia Chlor Alkali Industry Life Cycle
- Historical Data and Forecast of Indonesia Chlor Alkali Market Revenues & Volume By Product for the Period 2022-2032F
- Historical Data and Forecast of Indonesia Chlor Alkali Market Revenues & Volume By Caustic Soda for the Period 2022-2032F
- Historical Data and Forecast of Indonesia Chlor Alkali Market Revenues & Volume By Chlorine for the Period 2022-2032F
- Historical Data and Forecast of Indonesia Chlor Alkali Market Revenues & Volume By Soda Ash for the Period 2022-2032F
- Historical Data and Forecast of Indonesia Chlor Alkali Market Revenues & Volume By Production Process for the Period 2022-2032F
- Historical Data and Forecast of Indonesia Chlor Alkali Market Revenues & Volume By Membrane Cell for the Period 2022-2032F
- Historical Data and Forecast of Indonesia Chlor Alkali Market Revenues & Volume By Diaphragm Cell for the Period 2022-2032F
- Historical Data and Forecast of Indonesia Chlor Alkali Market Revenues & Volume By Other Production Processes for the Period 2022-2032F
- Historical Data and Forecast of Indonesia Chlor Alkali Market Revenues & Volume By Application for the Period 2022-2032F
- Historical Data and Forecast of Indonesia Chlor Alkali Market Revenues & Volume By Pulp and Paper for the Period 2022-2032F
- Historical Data and Forecast of Indonesia Chlor Alkali Market Revenues & Volume By Organic Chemical for the Period 2022-2032F
- Historical Data and Forecast of Indonesia Chlor Alkali Market Revenues & Volume By Inorganic Chemical for the Period 2022-2032F
- Historical Data and Forecast of Indonesia Chlor Alkali Market Revenues & Volume By Soap and Detergent for the Period 2022-2032F
- Historical Data and Forecast of Indonesia Chlor Alkali Market Revenues & Volume By Alumina for the Period 2022-2032F
- Historical Data and Forecast of Indonesia Chlor Alkali Market Revenues & Volume By Textile for the Period 2022-2032F
- Historical Data and Forecast of Indonesia Chlor Alkali Market Revenues & Volume By Other for the Period 2022-2032F
- Indonesia Chlor Alkali Import Export Trade Statistics
- Market Opportunity Assessment By Product
- Market Opportunity Assessment By Production Process
- Market Opportunity Assessment By Application
- Indonesia Chlor Alkali Top Companies Market Share
- Indonesia Chlor Alkali Competitive Benchmarking By Technical and Operational Parameters
- Indonesia Chlor Alkali Company Profiles
- Indonesia Chlor Alkali Key Strategic Recommendations
Indonesia Chlor Alkali Market - Frequently Asked Questions
The primary drivers include rising demand from the food & beverage and palm oil industries, increasing disposable incomes, and government support for industrial infrastructure development.
The market is expected to recover gradually as restrictions ease, driven by a resurgence in industrial demand and increased investments in production capacities.
The market is projected to reach USD 373 Million by 2032, following a CAGR of 4.1% from 2026 to 2032, indicating strong growth potential.
The largest consumers include the paper & pulp, food & beverage, and soap manufacturing industries, with significant demand driven by ongoing economic growth.
Companies are increasingly adopting automation and eco-friendly practices to enhance operational efficiencies and reduce environmental impacts in their manufacturing processes.
6Wresearch actively monitors the Indonesia Chlor Alkali Market and publishes its comprehensive annual report, highlighting emerging trends, growth drivers, revenue analysis, and forecast outlook. Our insights help businesses to make data-backed strategic decisions with ongoing market dynamics. Our analysts track relevent industries related to the Indonesia Chlor Alkali Market, allowing our clients with actionable intelligence and reliable forecasts tailored to emerging regional needs.
Yes, we provide customisation as per your requirements. To learn more, feel free to contact us on sales@6wresearch.com
1 Executive Summary |
2 Introduction |
2.1 Key Highlights of the Report |
2.2 Report Description |
2.3 Market Scope & Segmentation |
2.4 Research Methodology |
2.5 Assumptions |
3 Indonesia Chlor Alkali Market Overview |
3.1 Indonesia Country Macro Economic Indicators |
3.2 Indonesia Chlor Alkali Market Revenues & Volume, 2022 & 2032F |
3.3 Indonesia Chlor Alkali Market - Industry Life Cycle |
3.4 Indonesia Chlor Alkali Market - Porter's Five Forces |
3.5 Indonesia Chlor Alkali Market Revenues & Volume Share, By Product, 2022 & 2032F |
3.6 Indonesia Chlor Alkali Market Revenues & Volume Share, By Production Process, 2022 & 2032F |
3.7 Indonesia Chlor Alkali Market Revenues & Volume Share, By Application, 2022 & 2032F |
4 Indonesia Chlor Alkali Market Dynamics |
4.1 Impact Analysis |
4.2 Market Drivers |
4.2.1 Growing demand for chlor alkali products in various industries such as pulp and paper, textile, and water treatment. |
4.2.2 Increasing government investments in infrastructure projects leading to higher demand for chlor alkali products. |
4.2.3 Rising population and urbanization driving the need for chlor alkali products in construction and consumer goods sectors. |
4.3 Market Restraints |
4.3.1 Fluctuating prices of raw materials like salt and electricity impacting the production costs of chlor alkali products. |
4.3.2 Environmental concerns and regulations regarding the disposal of chlor alkali by-products. |
4.3.3 Intense competition in the market leading to pricing pressures and margin challenges. |
5 Indonesia Chlor Alkali Market Trends |
6 Indonesia Chlor Alkali Market, By Types |
6.1 Indonesia Chlor Alkali Market, By Product |
6.1.1 Overview and Analysis |
6.1.2 Indonesia Chlor Alkali Market Revenues & Volume, By Product, 2022-2032F |
6.1.3 Indonesia Chlor Alkali Market Revenues & Volume, By Caustic Soda, 2022-2032F |
6.1.4 Indonesia Chlor Alkali Market Revenues & Volume, By Chlorine, 2022-2032F |
6.1.5 Indonesia Chlor Alkali Market Revenues & Volume, By Soda Ash, 2022-2032F |
6.2 Indonesia Chlor Alkali Market, By Production Process |
6.2.1 Overview and Analysis |
6.2.2 Indonesia Chlor Alkali Market Revenues & Volume, By Membrane Cell, 2022-2032F |
6.2.3 Indonesia Chlor Alkali Market Revenues & Volume, By Diaphragm Cell, 2022-2032F |
6.2.4 Indonesia Chlor Alkali Market Revenues & Volume, By Other Production Processes, 2022-2032F |
6.3 Indonesia Chlor Alkali Market, By Application |
6.3.1 Overview and Analysis |
6.3.2 Indonesia Chlor Alkali Market Revenues & Volume, By Pulp and Paper, 2022-2032F |
6.3.3 Indonesia Chlor Alkali Market Revenues & Volume, By Organic Chemical, 2022-2032F |
6.3.4 Indonesia Chlor Alkali Market Revenues & Volume, By Inorganic Chemical, 2022-2032F |
6.3.5 Indonesia Chlor Alkali Market Revenues & Volume, By Soap and Detergent, 2022-2032F |
6.3.6 Indonesia Chlor Alkali Market Revenues & Volume, By Alumina, 2022-2032F |
6.3.7 Indonesia Chlor Alkali Market Revenues & Volume, By Textile, 2022-2032F |
7 Indonesia Chlor Alkali Market Import-Export Trade Statistics |
7.1 Indonesia Chlor Alkali Market Export to Major Countries |
7.2 Indonesia Chlor Alkali Market Imports from Major Countries |
8 Indonesia Chlor Alkali Market Key Performance Indicators |
8.1 Capacity utilization rate of chlor alkali plants in Indonesia. |
8.2 Export/import volume of chlor alkali products. |
8.3 Adoption rate of sustainable production practices in chlor alkali manufacturing. |
8.4 Research and development investment in new chlor alkali technologies. |
8.5 Number of new applications and industries using chlor alkali products. |
9 Indonesia Chlor Alkali Market - Opportunity Assessment |
9.1 Indonesia Chlor Alkali Market Opportunity Assessment, By Product, 2022 & 2032F |
9.2 Indonesia Chlor Alkali Market Opportunity Assessment, By Production Process, 2022 & 2032F |
9.3 Indonesia Chlor Alkali Market Opportunity Assessment, By Application, 2022 & 2032F |
10 Indonesia Chlor Alkali Market - Competitive Landscape |
10.1 Indonesia Chlor Alkali Market Revenue Share, By Companies, 2025 |
10.2 Indonesia Chlor Alkali Market Competitive Benchmarking, By Operating and Technical Parameters |
11 Company Profiles |
12 Recommendations |
13 Disclaimer |
Global Go To Market Strategy - 2030
Export potential enables firms to identify high-growth global markets with greater confidence by combining advanced trade intelligence with a structured quantitative methodology. The framework analyzes emerging demand trends and country-level import patterns while integrating macroeconomic and trade datasets such as GDP and population forecasts, bilateral import–export flows, tariff structures, elasticity differentials between developed and developing economies, geographic distance, and import demand projections. Using weighted trade values from 2020–2024 as the base period to project country-to-country export potential for 2030, these inputs are operationalized through calculated drivers such as gravity model parameters, tariff impact factors, and projected GDP per-capita growth. Through an analysis of hidden potentials, demand hotspots, and market conditions that are most favorable to success, this method enables firms to focus on target countries, maximize returns, and global expansion with data, backed by accuracy.
By factoring in the projected importer demand gap that is currently unmet and could be potential opportunity, it identifies the potential for the Exporter (Country) among 190 countries, against the general trade analysis, which identifies the biggest importer or exporter.
To discover high-growth global markets and optimize your business strategy:
Click Here
Pricing
- Single User License$ 1,995
- Department License$ 2,400
- Site License$ 3,120
- Global License$ 3,795

Leadership Perspectives from Industry Events
Search
Thought Leadership and Analyst Meet


Our Clients
6WResearch In News
- India Air Conditioner Market Set for Strong Rebound in 2026 After Weather-Led Correction and GST-Driven Recovery: 6Wresearch
- ADAS in India: How Automatic Emergency Braking, Blind Spot Detection & Driver Monitoring are Transforming Road Safety
- Doha a strategic location for EV manufacturing hub: IPA Qatar
- Demand for luxury TVs surging in the GCC, says Samsung
- Empowering Growth: The Thriving Journey of Bangladesh’s Cable Industry
- Demand for luxury TVs surging in the GCC, says Samsung
Latest Reports
- Nicaragua RPG Gaming Market (2026-2032)
- New Zealand RPG Gaming Market (2026-2032)
- Netherlands RPG Gaming Market (2026-2032)
- Nauru RPG Gaming Market (2026-2032)
- Namibia RPG Gaming Market (2026-2032)
- Mozambique RPG Gaming Market (2026-2032)
- Montenegro RPG Gaming Market (2026-2032)
- Mongolia RPG Gaming Market (2026-2032)
- Monaco RPG Gaming Market (2026-2032)
- Micronesia RPG Gaming Market (2026-2032)
Industry Events and Analyst Meet

HIMTEX 2026

India Refining Summit 2026

India EV Show 2026

EV tech India Expo 2026

Auto Tech Asia 2026
Whitepaper
- Middle East & Africa Commercial Security Market Click here to view more.
- Middle East & Africa Fire Safety Systems & Equipment Market Click here to view more.
- GCC Drone Market Click here to view more.
- Middle East Lighting Fixture Market Click here to view more.
- GCC Physical & Perimeter Security Market Click here to view more.