Myanmar Chlor Alkali Market (2026-2032) Outlook | Share, Trends, Size, Analysis, Forecast, Companies, Industry, Value, Revenue, Growth
Market Forecast By Product (Caustic Soda, Chlorine, Soda Ash), By Production Process (Membrane Cell, Diaphragm Cell, Other Production Processes), By Application (Pulp and Paper, Organic Chemical, Inorganic Chemical, Soap and Detergent, Alumina, Textile, Other ) And Competitive Landscape
| Product Code: ETC193006 | Publication Date: May 2022 | Updated Date: Jun 2026 | Product Type: Market Research Report | |
| Publisher: 6Wresearch | Author: Ravi Bhandari | No. of Pages: 60 | No. of Figures: 40 | No. of Tables: 7 |
Myanmar Chlor Alkali Market Size, Share & Growth Rate
The Myanmar Chlor Alkali Market was estimated at USD 400 Million in 2025 and is projected to reach USD 527 Million by 2032, growing at a CAGR of 4.0% from 2026 to 2032. This growth trajectory is predominantly fueled by the rising demand for caustic soda and chlorine across various sectors, including water treatment, textiles, and chemical manufacturing. As Myanmar advances its industrial infrastructure and urbanization efforts, the chlor alkali market is poised for significant expansion.
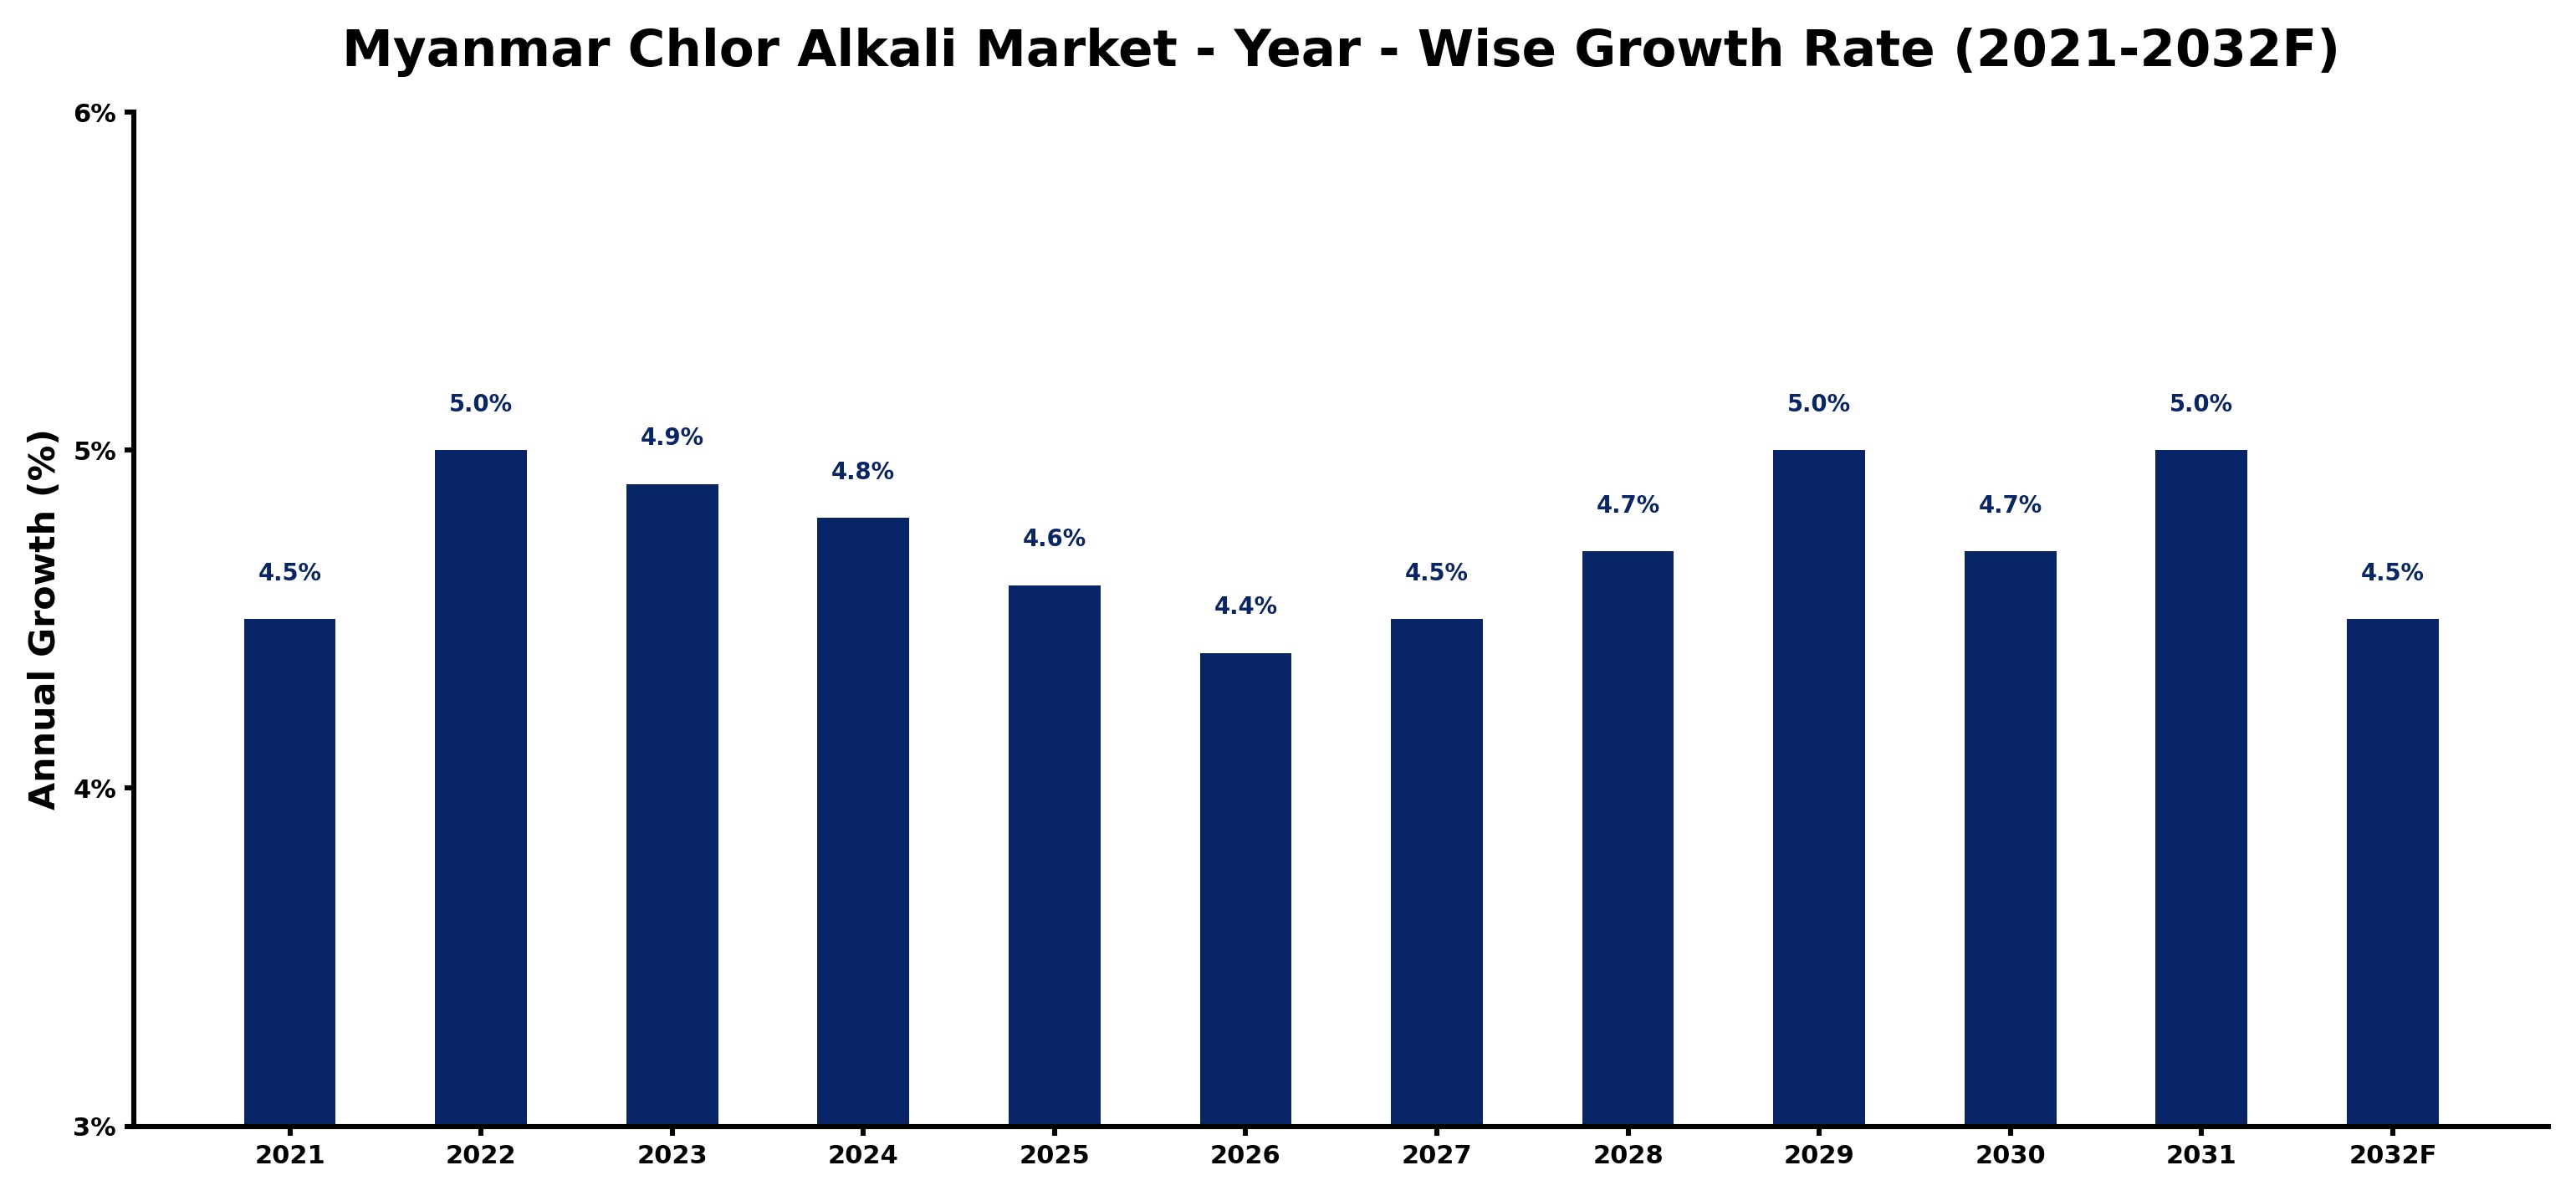
Myanmar Chlor Alkali Market Growth Rate Analysis (2021-2032)
The Myanmar chlor alkali market has exhibited a stable growth trend, with annual growth rates fluctuating between 4.4% and 5.0% from 2021 through 2032. Notably, growth peaked at 5.0% in 2022 and 2029, driven by increased consumer demand for chemicals fueled by expanding industrial activities and infrastructure projects. However, slight declines to 4.4% in 2026 and 4.5% in 2032 can be attributed to market saturation and external economic pressures. Advances in digitalization and energy transition initiatives are expected to bolster investment in the sector, fostering growth momentum. The steady increase in infrastructure development further underlines the positive sentiment surrounding the market’s prospects.
Myanmar Chlor Alkali Market Year-wise Growth Rate and Key Drivers
This graph highlights how the Myanmar Chlor Alkali Market has steadily grown over the past five years, supported by major growth factors.
The table below presents the year‑wise growth rates along with the key drivers influencing the market
| Year | Growth Rate | Major Drivers |
| 2021 | 4.5% | Increased industrial demand for chemicals |
| 2022 | 5.0% | Infrastructure development spurred production |
| 2023 | 4.9% | Export opportunities expanded significantly |
| 2024 | 4.8% | Technological advancements improved efficiency |
| 2025 | 4.6% | Regulatory support enhanced market stability |
| 2026 | 4.4% | Rising consumer awareness of applications |
| 2027 | 4.5% | Investment in renewable energy sources |
| 2028 | 4.7% | Growing demand for water treatment |
| 2029 | 5.0% | Chemical manufacturing capacity increased |
| 2030 | 4.7% | Sustainability initiatives drove innovation |
| 2031 | 5.0% | Partnerships with global suppliers formed |
| 2032 | 4.5% | Market diversification strategies implemented |
Note - Market size estimations and growth projections presented in this report are based on 6Wresearch’s advanced forecasting approach, validated with industry datasets as of June 2026.
Myanmar Chlor Alkali Market Synopsis
The demand for chlorine and caustic soda is witnessing a notable increase in Myanmar, particularly driven by the burgeoning paper and pulp industry. This sector’s growth not only demands these chemicals for production but also signals the broader economic development taking place in the region.
Additionally, the need for effective water treatment solutions is pushing manufacturers to enhance their production capabilities of chlor alkali products. As urban areas continue to expand, ensuring access to clean water becomes imperative, further solidifying the market’s significance in the country.
Myanmar Chlor Alkali Market Key Takeaways
- The market is experiencing robust growth due to industrialization and urbanization trends.
- Environmental regulations are prompting shifts toward more sustainable production practices.
- Key sectors such as textiles and water treatment are primary consumers of chlor alkali products.
- Investment in modern production technologies is becoming essential for market participants.
- Government regulations play a crucial role in shaping market operations and standards.
Evaluation of Restraints in Myanmar Chlor Alkali Market
The Myanmar chlor alkali market faces several restraints that could impact its growth trajectory. Environmental concerns regarding the production processes present a significant challenge, particularly concerning the disposal of by-products like chlorine gas and wastewater. These issues prompt regulatory scrutiny and necessitate compliance with increasingly stringent environmental standards. Furthermore, fluctuations in raw material prices and energy costs introduce another layer of complexity, potentially affecting manufacturers' profitability and production stability.
Myanmar Chlor Alkali Market Trends
Several trends are currently shaping the Myanmar chlor alkali market landscape. A marked shift towards sustainable production practices is emerging as manufacturers seek to minimize their environmental footprint. There is also an increasing adoption of advanced technologies aimed at improving production efficiency and product quality. Moreover, the demand for innovative applications of chlorine in the health and sanitation sectors is expanding, driven by growing public health awareness.
Myanmar Chlor Alkali Market Opportunities
Investment opportunities abound within the Myanmar chlor alkali market, particularly in establishing modern production facilities that incorporate energy-efficient technologies. Additionally, sectors such as water treatment and textile production offer avenues for growth, as the demand for high-quality chlor alkali products continues to rise. With increasing government focus on infrastructure development, collaboration between public and private sectors can further enhance market capabilities and create new growth pathways.
Government Initiatives in the Myanmar Chlor Alkali Market
The Myanmar government has implemented various initiatives aimed at regulating the chlor alkali market to ensure safety and environmental sustainability. Policies that encompass production, storage, and transportation standards are critical in maintaining industry integrity. Furthermore, incentives for adopting cleaner technologies and investing in waste management solutions demonstrate the government’s commitment to fostering a sustainable industrial environment.
Future Insights of the Myanmar Chlor Alkali Market
Looking ahead to 2026-2032, the Myanmar chlor alkali market is expected to evolve significantly, propelled by ongoing industrial growth and modernization efforts. The integration of advanced production technologies will likely enhance output efficiency while addressing environmental concerns. As market participants adapt to regulatory changes, an emphasis on sustainable practices will be crucial. The increasing reliance on chlor alkali products in various applications hints at a vibrant future, signaling ample opportunities for investment and development.
Myanmar Chlor Alkali Market Latest Developments (May 2025 - June 2026)
Recent developments in the Myanmar chlor alkali market indicate a heightened focus on upgrading production facilities to meet both domestic and international standards. Many manufacturers are actively exploring partnerships to enhance technology transfer and improve production efficiencies. Furthermore, there is a notable increase in regulatory efforts aimed at promoting environmentally sustainable practices within the industry, marking a pivotal shift towards accountability and cleaner production methodologies.
Myanmar Chlor Alkali Market - Key Attractiveness of the Report
- 10 Years of Market Numbers
- Historical Data Starting from 2022 to 2025
- Base Year: 2025
- Forecast Data until 2032
- Key Performance Indicators Impacting the Market
- Major Upcoming Developments and Projects
Key Highlights of the Report:
- Myanmar Chlor Alkali Market Outlook
- Market Size of Myanmar Chlor Alkali Market, 2025
- Forecast of Myanmar Chlor Alkali Market, 2032
- Historical Data and Forecast of Myanmar Chlor Alkali Revenues & Volume for the Period 2022-2032F
- Myanmar Chlor Alkali Market Trend Evolution
- Myanmar Chlor Alkali Market Drivers and Challenges
- Myanmar Chlor Alkali Price Trends
- Myanmar Chlor Alkali Porter's Five Forces
- Myanmar Chlor Alkali Industry Life Cycle
- Historical Data and Forecast of Myanmar Chlor Alkali Market Revenues & Volume By Product for the Period 2022-2032F
- Historical Data and Forecast of Myanmar Chlor Alkali Market Revenues & Volume By Caustic Soda for the Period 2022-2032F
- Historical Data and Forecast of Myanmar Chlor Alkali Market Revenues & Volume By Chlorine for the Period 2022-2032F
- Historical Data and Forecast of Myanmar Chlor Alkali Market Revenues & Volume By Soda Ash for the Period 2022-2032F
- Historical Data and Forecast of Myanmar Chlor Alkali Market Revenues & Volume By Production Process for the Period 2022-2032F
- Historical Data and Forecast of Myanmar Chlor Alkali Market Revenues & Volume By Membrane Cell for the Period 2022-2032F
- Historical Data and Forecast of Myanmar Chlor Alkali Market Revenues & Volume By Diaphragm Cell for the Period 2022-2032F
- Historical Data and Forecast of Myanmar Chlor Alkali Market Revenues & Volume By Other Production Processes for the Period 2022-2032F
- Historical Data and Forecast of Myanmar Chlor Alkali Market Revenues & Volume By Application for the Period 2022-2032F
- Historical Data and Forecast of Myanmar Chlor Alkali Market Revenues & Volume By Pulp and Paper for the Period 2022-2032F
- Historical Data and Forecast of Myanmar Chlor Alkali Market Revenues & Volume By Organic Chemical for the Period 2022-2032F
- Historical Data and Forecast of Myanmar Chlor Alkali Market Revenues & Volume By Inorganic Chemical for the Period 2022-2032F
- Historical Data and Forecast of Myanmar Chlor Alkali Market Revenues & Volume By Soap and Detergent for the Period 2022-2032F
- Historical Data and Forecast of Myanmar Chlor Alkali Market Revenues & Volume By Alumina for the Period 2022-2032F
- Historical Data and Forecast of Myanmar Chlor Alkali Market Revenues & Volume By Textile for the Period 2022-2032F
- Historical Data and Forecast of Myanmar Chlor Alkali Market Revenues & Volume By Other for the Period 2022-2032F
- Myanmar Chlor Alkali Import Export Trade Statistics
- Market Opportunity Assessment By Product
- Market Opportunity Assessment By Production Process
- Market Opportunity Assessment By Application
- Myanmar Chlor Alkali Top Companies Market Share
- Myanmar Chlor Alkali Competitive Benchmarking By Technical and Operational Parameters
- Myanmar Chlor Alkali Company Profiles
- Myanmar Chlor Alkali Key Strategic Recommendations
Myanmar Chlor Alkali Market - Frequently Asked Questions
The market is projected to grow at a CAGR of 4.0% from 2026 to 2032, reaching USD 527 Million by 2032 from an estimated USD 400 Million in 2025.
Key industries utilizing chlor alkali products include water treatment, pulp and paper, textiles, and various chemical manufacturing processes, reflecting the diverse applications of these essential chemicals.
Environmental regulations are increasingly shaping production methods and encouraging manufacturers to adopt cleaner technologies to minimize pollution and waste management issues.
Opportunities are abundant, especially in modernizing production facilities and tapping into the expanding sectors of water treatment and textile manufacturing as demand for quality chlor alkali products rises.
Notable trends include a shift towards sustainable production practices, increased investment in technology, and a growing demand for chlor alkali applications in health and sanitation.
The government is implementing regulatory frameworks to ensure safety and sustainability in production, along with incentives for adopting eco-friendly technologies, thereby fostering a conducive environment for growth in the sector.
6Wresearch actively monitors the Myanmar Chlor Alkali Market and publishes its comprehensive annual report, highlighting emerging trends, growth drivers, revenue analysis, and forecast outlook. Our insights help businesses to make data-backed strategic decisions with ongoing market dynamics. Our analysts track relevent industries related to the Myanmar Chlor Alkali Market, allowing our clients with actionable intelligence and reliable forecasts tailored to emerging regional needs.
Yes, we provide customisation as per your requirements. To learn more, feel free to contact us on sales@6wresearch.com
1 Executive Summary |
2 Introduction |
2.1 Key Highlights of the Report |
2.2 Report Description |
2.3 Market Scope & Segmentation |
2.4 Research Methodology |
2.5 Assumptions |
3 Myanmar Chlor Alkali Market Overview |
3.1 Myanmar Country Macro Economic Indicators |
3.2 Myanmar Chlor Alkali Market Revenues & Volume, 2022 & 2032F |
3.3 Myanmar Chlor Alkali Market - Industry Life Cycle |
3.4 Myanmar Chlor Alkali Market - Porter's Five Forces |
3.5 Myanmar Chlor Alkali Market Revenues & Volume Share, By Product, 2022 & 2032F |
3.6 Myanmar Chlor Alkali Market Revenues & Volume Share, By Production Process, 2022 & 2032F |
3.7 Myanmar Chlor Alkali Market Revenues & Volume Share, By Application, 2022 & 2032F |
4 Myanmar Chlor Alkali Market Dynamics |
4.1 Impact Analysis |
4.2 Market Drivers |
4.2.1 Growing demand for chlor alkali products in industries such as textiles, paper pulp, and water treatment in Myanmar. |
4.2.2 Increasing government initiatives promoting the use of chlor alkali products for water treatment and sanitation. |
4.2.3 Rising investments in infrastructure projects driving the demand for chlor alkali products in construction and manufacturing sectors. |
4.3 Market Restraints |
4.3.1 Fluctuating prices of raw materials such as salt and electricity impacting the production costs of chlor alkali products. |
4.3.2 Lack of advanced technology and infrastructure hindering the efficient production and distribution of chlor alkali products in Myanmar. |
4.3.3 Environmental regulations and concerns regarding the disposal of chlor alkali by-products affecting the market growth. |
5 Myanmar Chlor Alkali Market Trends |
6 Myanmar Chlor Alkali Market, By Types |
6.1 Myanmar Chlor Alkali Market, By Product |
6.1.1 Overview and Analysis |
6.1.2 Myanmar Chlor Alkali Market Revenues & Volume, By Product, 2022-2032F |
6.1.3 Myanmar Chlor Alkali Market Revenues & Volume, By Caustic Soda, 2022-2032F |
6.1.4 Myanmar Chlor Alkali Market Revenues & Volume, By Chlorine, 2022-2032F |
6.1.5 Myanmar Chlor Alkali Market Revenues & Volume, By Soda Ash, 2022-2032F |
6.2 Myanmar Chlor Alkali Market, By Production Process |
6.2.1 Overview and Analysis |
6.2.2 Myanmar Chlor Alkali Market Revenues & Volume, By Membrane Cell, 2022-2032F |
6.2.3 Myanmar Chlor Alkali Market Revenues & Volume, By Diaphragm Cell, 2022-2032F |
6.2.4 Myanmar Chlor Alkali Market Revenues & Volume, By Other Production Processes, 2022-2032F |
6.3 Myanmar Chlor Alkali Market, By Application |
6.3.1 Overview and Analysis |
6.3.2 Myanmar Chlor Alkali Market Revenues & Volume, By Pulp and Paper, 2022-2032F |
6.3.3 Myanmar Chlor Alkali Market Revenues & Volume, By Organic Chemical, 2022-2032F |
6.3.4 Myanmar Chlor Alkali Market Revenues & Volume, By Inorganic Chemical, 2022-2032F |
6.3.5 Myanmar Chlor Alkali Market Revenues & Volume, By Soap and Detergent, 2022-2032F |
6.3.6 Myanmar Chlor Alkali Market Revenues & Volume, By Alumina, 2022-2032F |
6.3.7 Myanmar Chlor Alkali Market Revenues & Volume, By Textile, 2022-2032F |
7 Myanmar Chlor Alkali Market Import-Export Trade Statistics |
7.1 Myanmar Chlor Alkali Market Export to Major Countries |
7.2 Myanmar Chlor Alkali Market Imports from Major Countries |
8 Myanmar Chlor Alkali Market Key Performance Indicators |
8.1 Energy efficiency of chlor alkali production processes. |
8.2 Percentage of market penetration in key industries. |
8.3 Compliance with environmental regulations regarding the disposal of chlor alkali waste. |
8.4 Adoption rate of advanced technology in chlor alkali production processes. |
9 Myanmar Chlor Alkali Market - Opportunity Assessment |
9.1 Myanmar Chlor Alkali Market Opportunity Assessment, By Product, 2022 & 2032F |
9.2 Myanmar Chlor Alkali Market Opportunity Assessment, By Production Process, 2022 & 2032F |
9.3 Myanmar Chlor Alkali Market Opportunity Assessment, By Application, 2022 & 2032F |
10 Myanmar Chlor Alkali Market - Competitive Landscape |
10.1 Myanmar Chlor Alkali Market Revenue Share, By Companies, 2025 |
10.2 Myanmar Chlor Alkali Market Competitive Benchmarking, By Operating and Technical Parameters |
11 Company Profiles |
12 Recommendations |
13 Disclaimer |
Global Go To Market Strategy - 2030
Export potential enables firms to identify high-growth global markets with greater confidence by combining advanced trade intelligence with a structured quantitative methodology. The framework analyzes emerging demand trends and country-level import patterns while integrating macroeconomic and trade datasets such as GDP and population forecasts, bilateral import–export flows, tariff structures, elasticity differentials between developed and developing economies, geographic distance, and import demand projections. Using weighted trade values from 2020–2024 as the base period to project country-to-country export potential for 2030, these inputs are operationalized through calculated drivers such as gravity model parameters, tariff impact factors, and projected GDP per-capita growth. Through an analysis of hidden potentials, demand hotspots, and market conditions that are most favorable to success, this method enables firms to focus on target countries, maximize returns, and global expansion with data, backed by accuracy.
By factoring in the projected importer demand gap that is currently unmet and could be potential opportunity, it identifies the potential for the Exporter (Country) among 190 countries, against the general trade analysis, which identifies the biggest importer or exporter.
To discover high-growth global markets and optimize your business strategy:
Click Here
Pricing
- Single User License$ 1,995
- Department License$ 2,400
- Site License$ 3,120
- Global License$ 3,795

Leadership Perspectives from Industry Events
Search
Thought Leadership and Analyst Meet


Our Clients
6WResearch In News
- India Air Conditioner Market Set for Strong Rebound in 2026 After Weather-Led Correction and GST-Driven Recovery: 6Wresearch
- ADAS in India: How Automatic Emergency Braking, Blind Spot Detection & Driver Monitoring are Transforming Road Safety
- Doha a strategic location for EV manufacturing hub: IPA Qatar
- Demand for luxury TVs surging in the GCC, says Samsung
- Empowering Growth: The Thriving Journey of Bangladesh’s Cable Industry
- Demand for luxury TVs surging in the GCC, says Samsung
Latest Reports
- Poland Fire Protection Systems Market (2026-2032)
- Cape Verde Portable Hand-Thrown Extinguisher Market (2026-2032)
- Canada Portable Hand-Thrown Extinguisher Market (2026-2032)
- Cameroon Portable Hand-Thrown Extinguisher Market (2026-2032)
- Burundi Portable Hand-Thrown Extinguisher Market (2026-2032)
- Burkina Faso Portable Hand-Thrown Extinguisher Market (2026-2032)
- Bulgaria Portable Hand-Thrown Extinguisher Market (2026-2032)
- Brunei Portable Hand-Thrown Extinguisher Market (2026-2032)
- Botswana Portable Hand-Thrown Extinguisher Market (2026-2032)
- Bosnia and Herzegovina Portable Hand-Thrown Extinguisher Market (2026-2032)
Industry Events and Analyst Meet

HIMTEX 2026

India Refining Summit 2026

India EV Show 2026

EV tech India Expo 2026

Auto Tech Asia 2026
Whitepaper
- Middle East & Africa Commercial Security Market Click here to view more.
- Middle East & Africa Fire Safety Systems & Equipment Market Click here to view more.
- GCC Drone Market Click here to view more.
- Middle East Lighting Fixture Market Click here to view more.
- GCC Physical & Perimeter Security Market Click here to view more.