Australia Chlor Alkali Market (2026-2032) Outlook | Companies, Size, Trends, Analysis, Value, Forecast, Share, Industry, Revenue, Growth
Market Forecast By Product (Caustic Soda, Chlorine, Soda Ash), By Production Process (Membrane Cell, Diaphragm Cell, Other Production Processes), By Application (Pulp and Paper, Organic Chemical, Inorganic Chemical, Soap and Detergent, Alumina, Textile, Other ) And Competitive Landscape
| Product Code: ETC193007 | Publication Date: May 2022 | Updated Date: Jun 2026 | Product Type: Market Research Report | |
| Publisher: 6Wresearch | Author: Ravi Bhandari | No. of Pages: 60 | No. of Figures: 40 | No. of Tables: 7 |
Australia Chlor Alkali Market Size, Share & Growth Rate
The Australia Chlor Alkali Market was estimated at USD 148 Million in 2025 and is projected to reach USD 174 Million by 2032, growing at a CAGR of 2.3% from 2026 to 2032. This growth trajectory is largely fueled by increasing industrial demand for chlorine and caustic soda across various sectors, including chemicals and water treatment. The rising construction activities in Australia further underpin the demand for these essential materials, creating a robust foundation for market expansion.
Australia Chlor Alkali Market Growth Rate Analysis (2021-2032)
The Australian chlor alkali market experienced a notable recovery following a challenging period, reflecting a growth rate of 5.3% in 2022 after a slight contraction of 0.5% in 2021. This resurgence can be attributed to increased industrial demand and significant investments in production capacity upgrades. The market maintained a solid growth trajectory with 5.0% in 2023, driven by heightened consumer demand and the transition to more sustainable energy practices. As we look ahead, growth is expected to stabilize around 2.6% to 2.8% from 2024 to 2032, influenced by technological advancements and government policies promoting eco-friendly production processes, ensuring the sector remains competitive and aligned with global sustainability goals.
Australia Chlor Alkali Market Year-wise Growth Rate and Key Drivers
This graph highlights how the Australia Chlor Alkali Market has steadily grown over the past five years, supported by major growth factors.
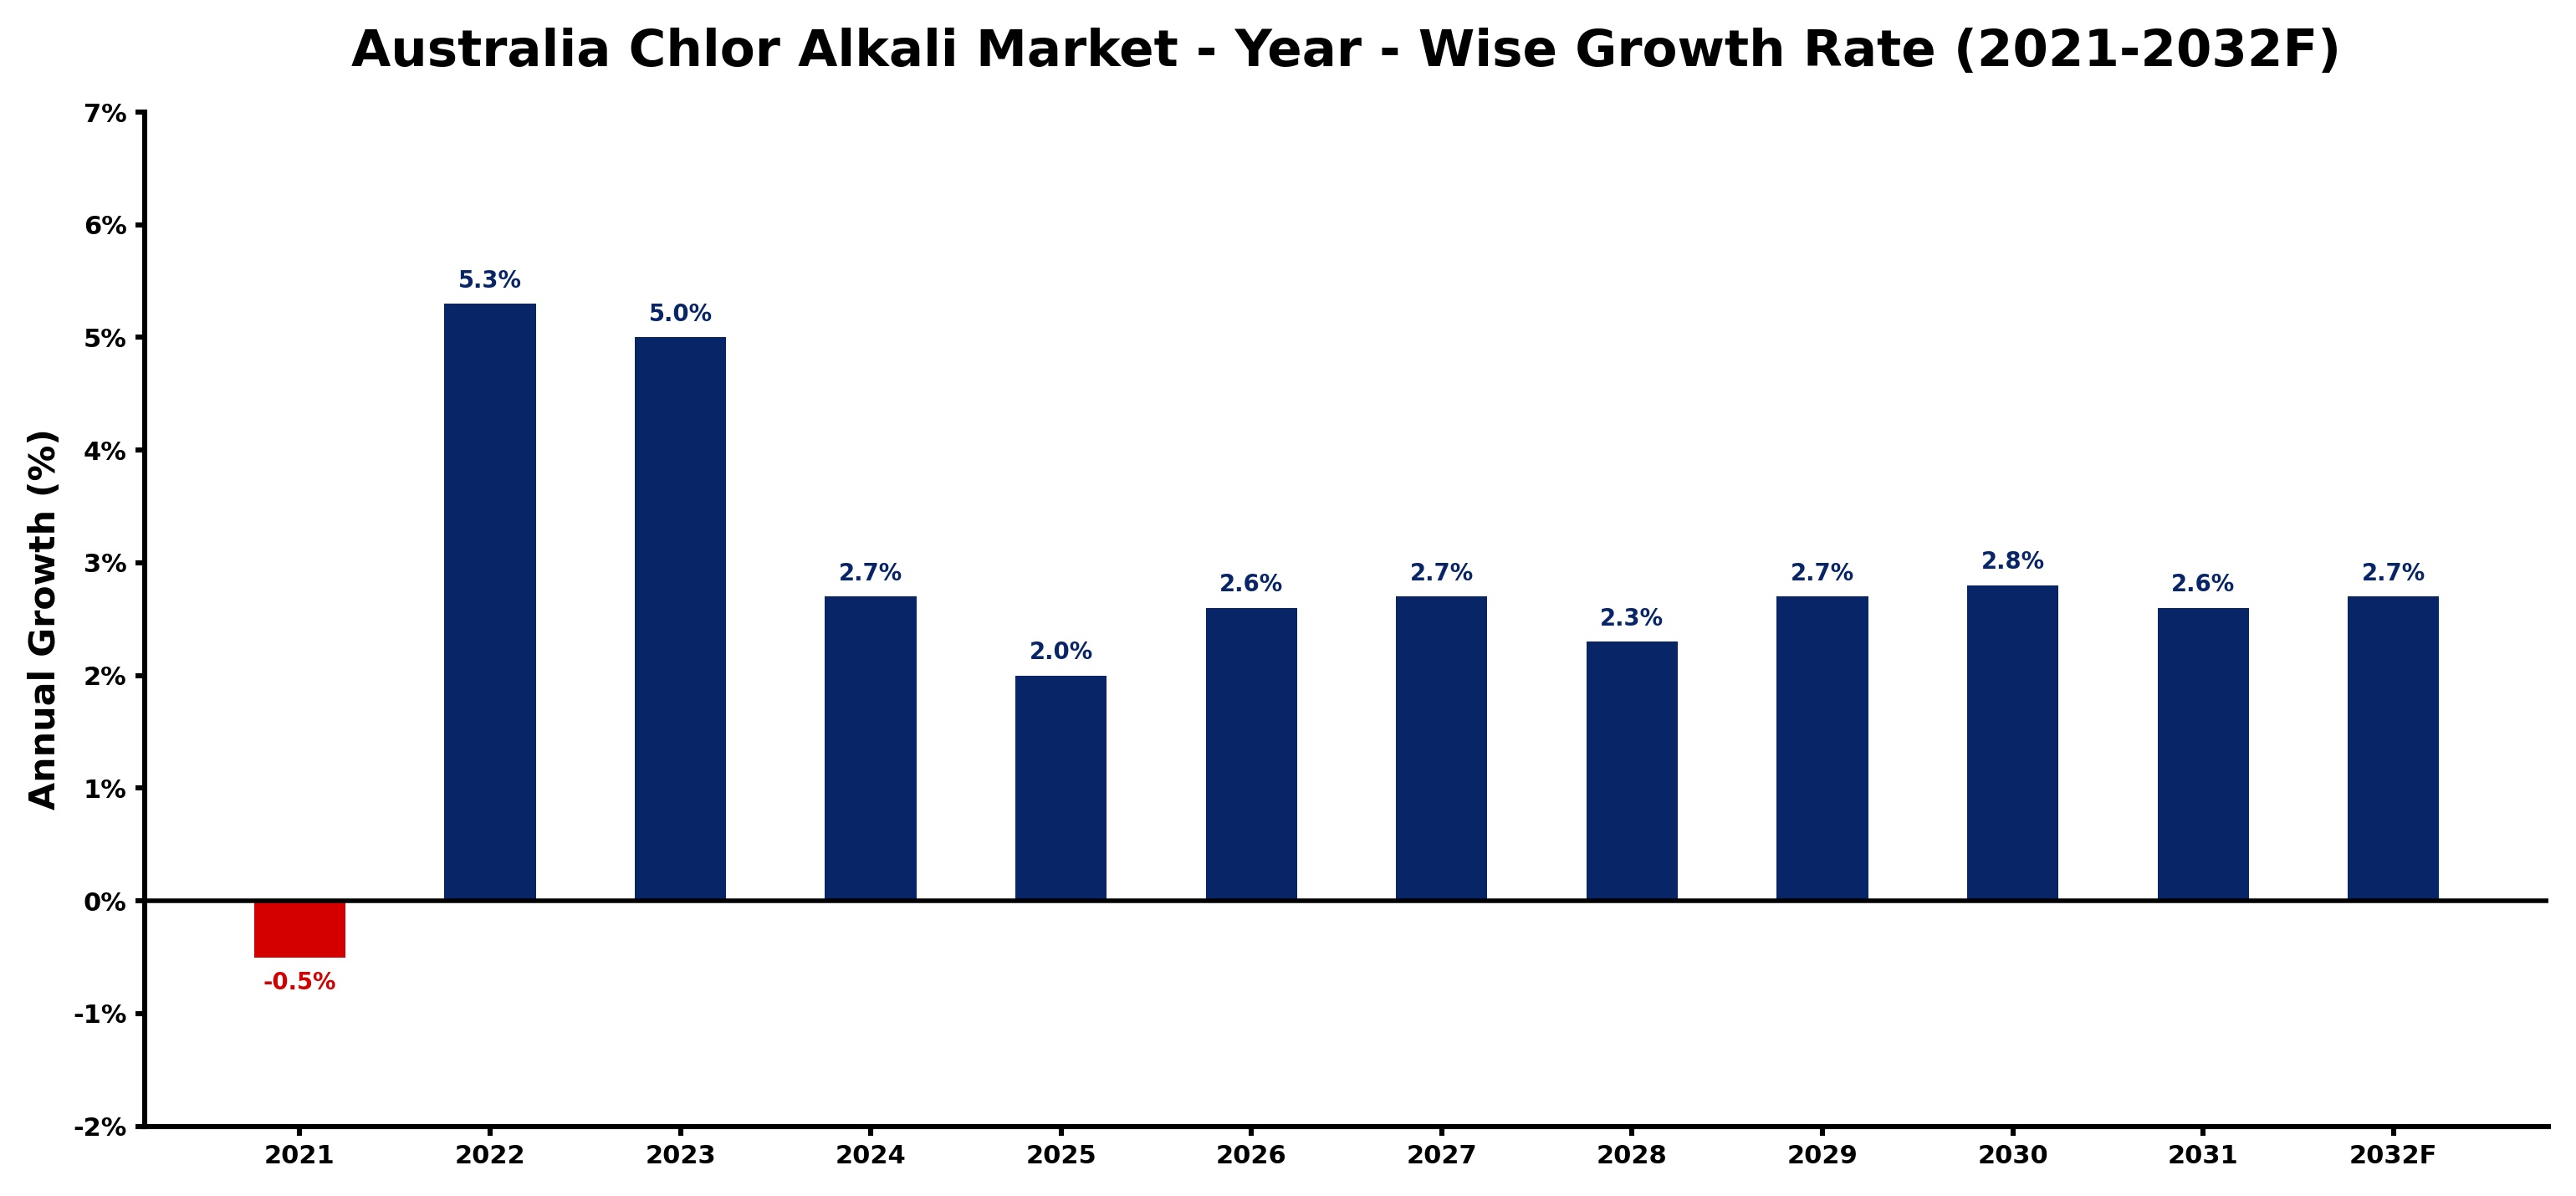
The table below presents the year‑wise growth rates along with the key drivers influencing the market
| Year | Growth Rate | Major Drivers |
| 2021 | -0.5% | Raw material prices pressured margins |
| 2022 | 5.3% | Industrial demand stimulated production |
| 2023 | 5.0% | Technological advancements enhanced efficiency |
| 2024 | 2.7% | Sustainability initiatives drove innovation |
| 2025 | 2.0% | Export opportunities expanded market reach |
| 2026 | 2.6% | Infrastructure investments supported growth |
| 2027 | 2.7% | Regulatory support encouraged development |
| 2028 | 2.3% | Increased applications broadened usage |
| 2029 | 2.7% | Strategic partnerships enhanced capabilities |
| 2030 | 2.8% | R&D investments fostered new products |
| 2031 | 2.6% | Consumer awareness promoted sustainability |
| 2032 | 2.7% | Market diversification opened new avenues |
Note - Market size estimations and growth projections presented in this report are based on 6Wresearch’s advanced forecasting approach, validated with industry datasets as of June 2026.
Australia Chlor Alkali Market Synopsis
Currently, the most significant force shaping the Australia Chlor Alkali Market is the surging demand for chlorine in the production of polyvinyl chloride (PVC) and chlorinated solvents. This upsurge is complemented by a heightened focus on environmental sustainability, compelling producers to adopt cleaner and more efficient production technologies.
Furthermore, regulatory policies promoting enhanced water treatment and wastewater management are driving demand for caustic soda and other chlor-alkali products. These trends not only contribute to market growth but also necessitate ongoing innovation within the sector to ensure compliance with environmental standards.
Australia Chlor Alkali Market Key Takeaways
- The Australia Chlor Alkali Market is anticipated to expand steadily, reaching USD 174 Million by 2032.
- Increasing industrial applications of chlorine and caustic soda are propelling market demand.
- Technological advancements in production methods are enhancing energy efficiency.
- Environmental regulations are influencing production processes and compliance standards.
- Construction and infrastructure development projects are creating new opportunities for market growth.
Evaluation of Restraints in Australia Chlor Alkali Market
Despite its positive growth trajectory, the Australia Chlor Alkali Market faces several restraints. One notable challenge is the management of stringent environmental regulations concerning chlorine emissions and brine disposal. Producers must navigate these regulations while maintaining operational efficiency, which can increase operational costs. Additionally, fluctuating energy prices can impact the profitability of chlor-alkali production, as energy consumption is significant during the electrolysis process. The competition from alternative chemical production methods and substitutes may also limit market growth by drawing away potential customers seeking more sustainable or cost-effective solutions.
Australia Chlor Alkali Market Trends
Key trends currently influencing the Australia Chlor Alkali Market include advancements in membrane cell technology that improve energy efficiency and reduce environmental impact. This technology enables producers to optimize their processes, minimizing resource consumption while maximizing output quality. Additionally, there is a growing emphasis on sustainable production practices, with companies increasingly adopting strategies that align with global sustainability goals. As awareness of environmental issues rises, the market is likely to see a shift toward eco-friendly alternatives and practices.
Australia Chlor Alkali Market Opportunities
The opportunities for growth in the Australia Chlor Alkali Market lie primarily in expanding applications for chlorine and caustic soda. The ongoing need for effective water treatment solutions presents a significant avenue for market participants, especially as water scarcity becomes a pressing global issue. Furthermore, the development of infrastructure in response to urbanization and population growth in Australia opens additional avenues for investment in chlor-alkali products. Companies that can innovate and adapt to changing market demands will find ample opportunities for growth and expansion.
Government Initiatives in the Australia Chlor Alkali Market
Australian government policies play a crucial role in regulating the chlor-alkali sector, focusing on environmental sustainability and workplace safety. Regulations concerning the production, storage, transportation, and disposal of hazardous chemicals are strictly enforced to mitigate environmental impacts. These policies not only ensure that manufacturers comply with safety standards but also promote investments in cleaner production technologies. Public funding initiatives aimed at enhancing wastewater management practices further contribute to the sector's development.
Future Insights of the Australia Chlor Alkali Market
Looking ahead to 2026-2032, the Australia Chlor Alkali Market is poised for steady growth fueled by ongoing industrial applications and technological advancements. The increasing integration of sustainable practices in production processes will likely shape the market landscape, driving efficiency and environmental compliance. Furthermore, the anticipated growth in the construction sector and water treatment initiatives will continue to bolster demand for chlorine and caustic soda, ensuring a robust market environment for the foreseeable future.
Australia Chlor Alkali Market Latest Developments (May 2025 - June 2026)
Recent developments in the Australia Chlor Alkali Market indicate a trend toward the adoption of advanced production technologies designed to enhance efficiency and reduce carbon footprints. Companies are increasingly investing in research and development to innovate new methodologies that align with environmental standards. Additionally, collaborations among stakeholders within the industry aim to establish best practices for sustainability and compliance with government regulations, enhancing the overall competitiveness of the market.
Australia Chlor Alkali Market - Key Attractiveness of the Report
- 10 Years of Market Numbers
- Historical Data Starting from 2022 to 2025
- Base Year: 2025
- Forecast Data until 2032
- Key Performance Indicators Impacting the Market
- Major Upcoming Developments and Projects
Key Highlights of the Report:
- Australia Chlor Alkali Market Outlook
- Market Size of Australia Chlor Alkali Market, 2025
- Forecast of Australia Chlor Alkali Market, 2032
- Historical Data and Forecast of Australia Chlor Alkali Revenues & Volume for the Period 2022-2032F
- Australia Chlor Alkali Market Trend Evolution
- Australia Chlor Alkali Market Drivers and Challenges
- Australia Chlor Alkali Price Trends
- Australia Chlor Alkali Porter's Five Forces
- Australia Chlor Alkali Industry Life Cycle
- Historical Data and Forecast of Australia Chlor Alkali Market Revenues & Volume By Product for the Period 2022-2032F
- Historical Data and Forecast of Australia Chlor Alkali Market Revenues & Volume By Caustic Soda for the Period 2022-2032F
- Historical Data and Forecast of Australia Chlor Alkali Market Revenues & Volume By Chlorine for the Period 2022-2032F
- Historical Data and Forecast of Australia Chlor Alkali Market Revenues & Volume By Soda Ash for the Period 2022-2032F
- Historical Data and Forecast of Australia Chlor Alkali Market Revenues & Volume By Production Process for the Period 2022-2032F
- Historical Data and Forecast of Australia Chlor Alkali Market Revenues & Volume By Membrane Cell for the Period 2022-2032F
- Historical Data and Forecast of Australia Chlor Alkali Market Revenues & Volume By Diaphragm Cell for the Period 2022-2032F
- Historical Data and Forecast of Australia Chlor Alkali Market Revenues & Volume By Other Production Processes for the Period 2022-2032F
- Historical Data and Forecast of Australia Chlor Alkali Market Revenues & Volume By Application for the Period 2022-2032F
- Historical Data and Forecast of Australia Chlor Alkali Market Revenues & Volume By Pulp and Paper for the Period 2022-2032F
- Historical Data and Forecast of Australia Chlor Alkali Market Revenues & Volume By Organic Chemical for the Period 2022-2032F
- Historical Data and Forecast of Australia Chlor Alkali Market Revenues & Volume By Inorganic Chemical for the Period 2022-2032F
- Historical Data and Forecast of Australia Chlor Alkali Market Revenues & Volume By Soap and Detergent for the Period 2022-2032F
- Historical Data and Forecast of Australia Chlor Alkali Market Revenues & Volume By Alumina for the Period 2022-2032F
- Historical Data and Forecast of Australia Chlor Alkali Market Revenues & Volume By Textile for the Period 2022-2032F
- Historical Data and Forecast of Australia Chlor Alkali Market Revenues & Volume By Other for the Period 2022-2032F
- Australia Chlor Alkali Import Export Trade Statistics
- Market Opportunity Assessment By Product
- Market Opportunity Assessment By Production Process
- Market Opportunity Assessment By Application
- Australia Chlor Alkali Top Companies Market Share
- Australia Chlor Alkali Competitive Benchmarking By Technical and Operational Parameters
- Australia Chlor Alkali Company Profiles
- Australia Chlor Alkali Key Strategic Recommendations
Australia Chlor Alkali Market - Frequently Asked Questions
The market is expected to grow primarily due to the increased demand for chlorine and caustic soda in sectors like chemicals, textiles, and water treatment, alongside technological advancements and government regulations supporting infrastructure development.
The Australia Chlor Alkali Market was estimated at USD 148 Million in 2025 and is projected to reach USD 174 Million by 2032, growing at a CAGR of 2.3% from 2026 to 2032, indicating a steady growth environment.
Government policies in Australia impose strict regulations to manage environmental impacts, thereby influencing operational processes within the chlor-alkali sector. Compliance is essential for sustainability and legal operations.
Advancements such as membrane cell technology are enhancing the energy efficiency of chlor-alkali production. These technologies not only reduce operational costs but also align with sustainability goals.
Chlor-alkali products are primarily utilized in chemical manufacturing, water treatment, and the production of PVC and textiles, contributing to their sustained demand across various industries.
6Wresearch actively monitors the Australia Chlor Alkali Market and publishes its comprehensive annual report, highlighting emerging trends, growth drivers, revenue analysis, and forecast outlook. Our insights help businesses to make data-backed strategic decisions with ongoing market dynamics. Our analysts track relevent industries related to the Australia Chlor Alkali Market, allowing our clients with actionable intelligence and reliable forecasts tailored to emerging regional needs.
Yes, we provide customisation as per your requirements. To learn more, feel free to contact us on sales@6wresearch.com
1 Executive Summary |
2 Introduction |
2.1 Key Highlights of the Report |
2.2 Report Description |
2.3 Market Scope & Segmentation |
2.4 Research Methodology |
2.5 Assumptions |
3 Australia Chlor Alkali Market Overview |
3.1 Australia Country Macro Economic Indicators |
3.2 Australia Chlor Alkali Market Revenues & Volume, 2022 & 2032F |
3.3 Australia Chlor Alkali Market - Industry Life Cycle |
3.4 Australia Chlor Alkali Market - Porter's Five Forces |
3.5 Australia Chlor Alkali Market Revenues & Volume Share, By Product, 2022 & 2032F |
3.6 Australia Chlor Alkali Market Revenues & Volume Share, By Production Process, 2022 & 2032F |
3.7 Australia Chlor Alkali Market Revenues & Volume Share, By Application, 2022 & 2032F |
4 Australia Chlor Alkali Market Dynamics |
4.1 Impact Analysis |
4.2 Market Drivers |
4.2.1 Increasing demand for chlorine and caustic soda in various industries such as water treatment, chemicals, and pulp paper |
4.2.2 Growth in construction and infrastructure development projects driving the demand for PVC, which uses chlor alkali products |
4.2.3 Favorable government regulations and policies promoting the use of chlor alkali products in water treatment and sanitation |
4.3 Market Restraints |
4.3.1 Volatility in raw material prices such as salt and electricity impacting the production cost of chlor alkali products |
4.3.2 Environmental concerns and regulations regarding the disposal of chlor alkali by-products |
4.3.3 Competition from alternative products or processes that may substitute the use of chlor alkali products in certain applications |
5 Australia Chlor Alkali Market Trends |
6 Australia Chlor Alkali Market, By Types |
6.1 Australia Chlor Alkali Market, By Product |
6.1.1 Overview and Analysis |
6.1.2 Australia Chlor Alkali Market Revenues & Volume, By Product, 2022-2032F |
6.1.3 Australia Chlor Alkali Market Revenues & Volume, By Caustic Soda, 2022-2032F |
6.1.4 Australia Chlor Alkali Market Revenues & Volume, By Chlorine, 2022-2032F |
6.1.5 Australia Chlor Alkali Market Revenues & Volume, By Soda Ash, 2022-2032F |
6.2 Australia Chlor Alkali Market, By Production Process |
6.2.1 Overview and Analysis |
6.2.2 Australia Chlor Alkali Market Revenues & Volume, By Membrane Cell, 2022-2032F |
6.2.3 Australia Chlor Alkali Market Revenues & Volume, By Diaphragm Cell, 2022-2032F |
6.2.4 Australia Chlor Alkali Market Revenues & Volume, By Other Production Processes, 2022-2032F |
6.3 Australia Chlor Alkali Market, By Application |
6.3.1 Overview and Analysis |
6.3.2 Australia Chlor Alkali Market Revenues & Volume, By Pulp and Paper, 2022-2032F |
6.3.3 Australia Chlor Alkali Market Revenues & Volume, By Organic Chemical, 2022-2032F |
6.3.4 Australia Chlor Alkali Market Revenues & Volume, By Inorganic Chemical, 2022-2032F |
6.3.5 Australia Chlor Alkali Market Revenues & Volume, By Soap and Detergent, 2022-2032F |
6.3.6 Australia Chlor Alkali Market Revenues & Volume, By Alumina, 2022-2032F |
6.3.7 Australia Chlor Alkali Market Revenues & Volume, By Textile, 2022-2032F |
7 Australia Chlor Alkali Market Import-Export Trade Statistics |
7.1 Australia Chlor Alkali Market Export to Major Countries |
7.2 Australia Chlor Alkali Market Imports from Major Countries |
8 Australia Chlor Alkali Market Key Performance Indicators |
8.1 Energy consumption per unit of chlor alkali production |
8.2 Percentage of chlor alkali products meeting quality standards |
8.3 Capacity utilization rate of chlor alkali production facilities |
8.4 Number of new applications or industries adopting chlor alkali products |
8.5 Investment in research and development for chlor alkali product innovation |
9 Australia Chlor Alkali Market - Opportunity Assessment |
9.1 Australia Chlor Alkali Market Opportunity Assessment, By Product, 2022 & 2032F |
9.2 Australia Chlor Alkali Market Opportunity Assessment, By Production Process, 2022 & 2032F |
9.3 Australia Chlor Alkali Market Opportunity Assessment, By Application, 2022 & 2032F |
10 Australia Chlor Alkali Market - Competitive Landscape |
10.1 Australia Chlor Alkali Market Revenue Share, By Companies, 2025 |
10.2 Australia Chlor Alkali Market Competitive Benchmarking, By Operating and Technical Parameters |
11 Company Profiles |
12 Recommendations |
13 Disclaimer |
Global Go To Market Strategy - 2030
Export potential enables firms to identify high-growth global markets with greater confidence by combining advanced trade intelligence with a structured quantitative methodology. The framework analyzes emerging demand trends and country-level import patterns while integrating macroeconomic and trade datasets such as GDP and population forecasts, bilateral import–export flows, tariff structures, elasticity differentials between developed and developing economies, geographic distance, and import demand projections. Using weighted trade values from 2020–2024 as the base period to project country-to-country export potential for 2030, these inputs are operationalized through calculated drivers such as gravity model parameters, tariff impact factors, and projected GDP per-capita growth. Through an analysis of hidden potentials, demand hotspots, and market conditions that are most favorable to success, this method enables firms to focus on target countries, maximize returns, and global expansion with data, backed by accuracy.
By factoring in the projected importer demand gap that is currently unmet and could be potential opportunity, it identifies the potential for the Exporter (Country) among 190 countries, against the general trade analysis, which identifies the biggest importer or exporter.
To discover high-growth global markets and optimize your business strategy:
Click Here
Pricing
- Single User License$ 1,995
- Department License$ 2,400
- Site License$ 3,120
- Global License$ 3,795

Leadership Perspectives from Industry Events
Search
Thought Leadership and Analyst Meet


Our Clients
6WResearch In News
- India Air Conditioner Market Set for Strong Rebound in 2026 After Weather-Led Correction and GST-Driven Recovery: 6Wresearch
- ADAS in India: How Automatic Emergency Braking, Blind Spot Detection & Driver Monitoring are Transforming Road Safety
- Doha a strategic location for EV manufacturing hub: IPA Qatar
- Demand for luxury TVs surging in the GCC, says Samsung
- Empowering Growth: The Thriving Journey of Bangladesh’s Cable Industry
- Demand for luxury TVs surging in the GCC, says Samsung
Latest Reports
- Poland Fire Protection Systems Market (2026-2032)
- Cape Verde Portable Hand-Thrown Extinguisher Market (2026-2032)
- Canada Portable Hand-Thrown Extinguisher Market (2026-2032)
- Cameroon Portable Hand-Thrown Extinguisher Market (2026-2032)
- Burundi Portable Hand-Thrown Extinguisher Market (2026-2032)
- Burkina Faso Portable Hand-Thrown Extinguisher Market (2026-2032)
- Bulgaria Portable Hand-Thrown Extinguisher Market (2026-2032)
- Brunei Portable Hand-Thrown Extinguisher Market (2026-2032)
- Botswana Portable Hand-Thrown Extinguisher Market (2026-2032)
- Bosnia and Herzegovina Portable Hand-Thrown Extinguisher Market (2026-2032)
Industry Events and Analyst Meet

HIMTEX 2026

India Refining Summit 2026

India EV Show 2026

EV tech India Expo 2026

Auto Tech Asia 2026
Whitepaper
- Middle East & Africa Commercial Security Market Click here to view more.
- Middle East & Africa Fire Safety Systems & Equipment Market Click here to view more.
- GCC Drone Market Click here to view more.
- Middle East Lighting Fixture Market Click here to view more.
- GCC Physical & Perimeter Security Market Click here to view more.