Indonesia Coffee Substitute Market (2026-2032) Outlook | Share, Companies, Trends, Industry, Size, Value, Analysis, Forecast, Revenue & Growth
Market Forecast By Nature (Organic, Conventional), By Packaging (Pouches, Cans, Aseptic Cartons), By Distribution Channel (Hypermarket/supermarket, Convenience Stores, Department Stores, Online Sales Channel) And Competitive Landscape
| Product Code: ETC218128 | Publication Date: Aug 2023 | Updated Date: Mar 2026 | Product Type: Market Research Report | |
| Publisher: 6Wresearch | Author: Ravi Bhandari | No. of Pages: 75 | No. of Figures: 35 | No. of Tables: 20 |
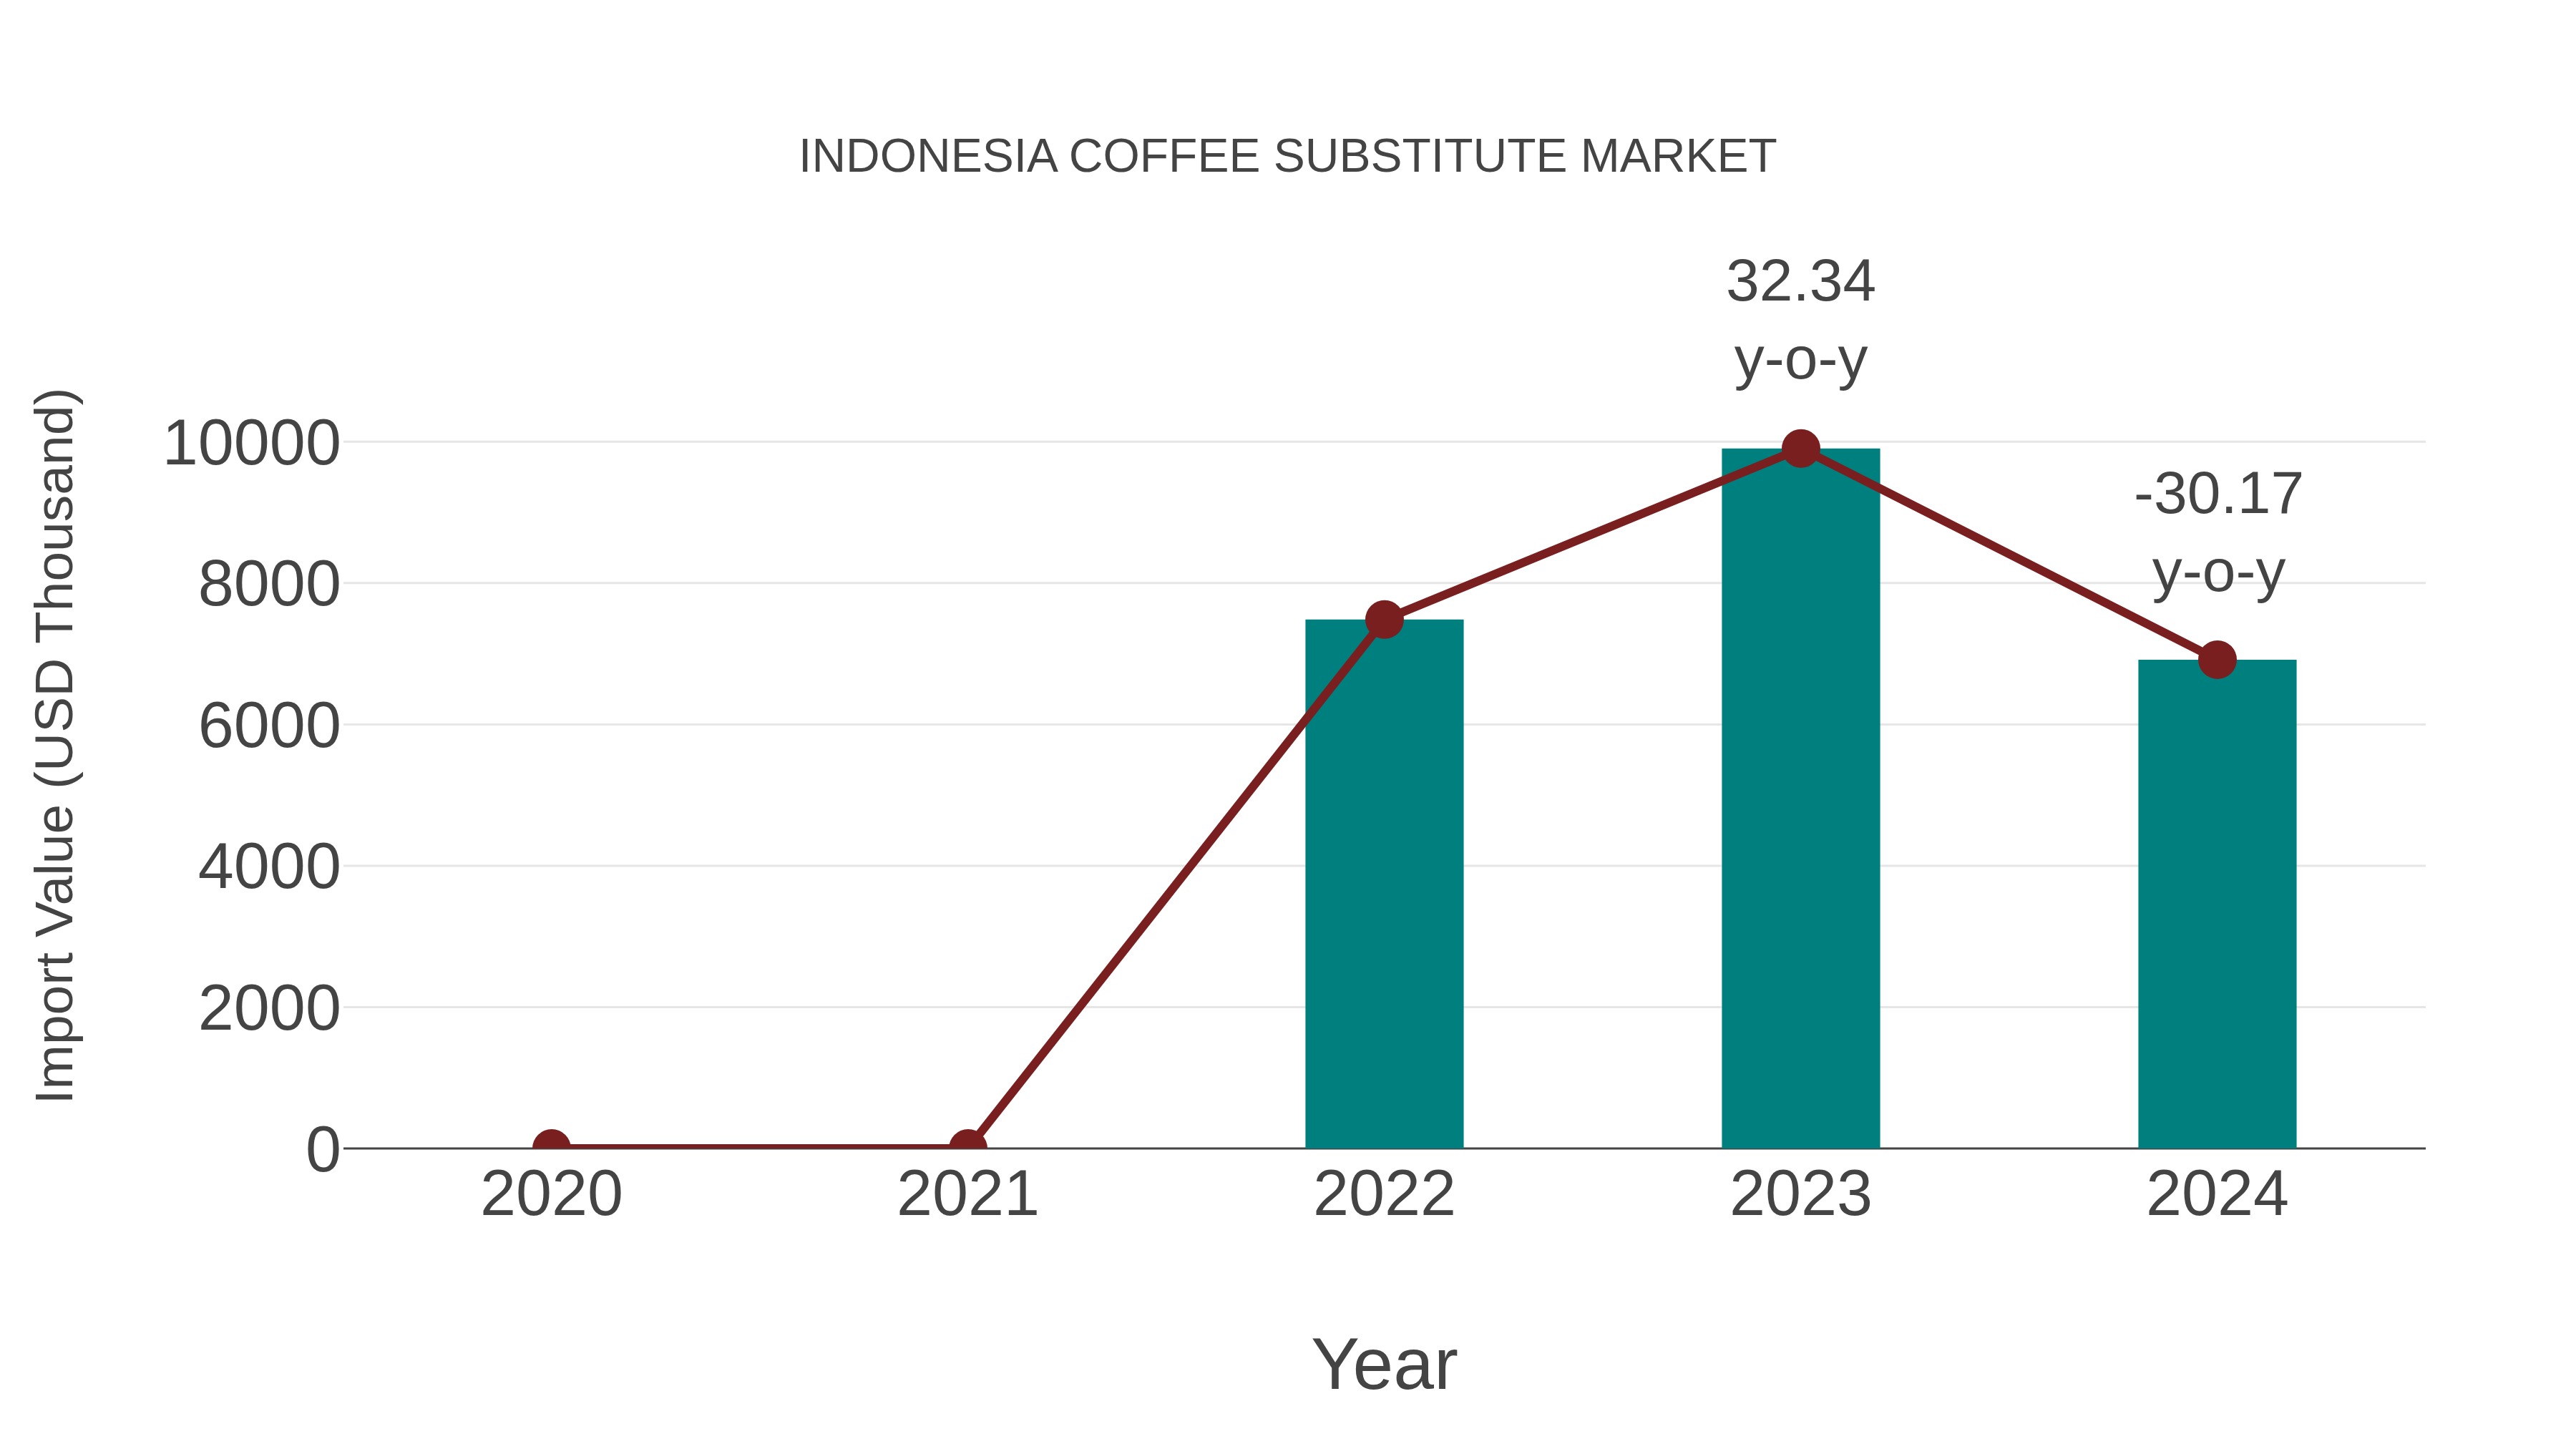
Indonesia Coffee Substitute Market: Import Trend Analysis
Indonesia`s import trend for the coffee substitute market experienced a decline, with a growth rate of -30.17% from 2023 to 2024 and a compound annual growth rate (CAGR) of -3.87% from 2020 to 2024. This negative momentum can be attributed to shifting consumer preferences towards authentic coffee products, impacting demand for substitutes.
Indonesia Coffee Substitute Market Synopsis
The coffee substitute market in Indonesia has gained traction, with an increasing number of consumers exploring alternatives to traditional coffee due to health reasons or taste preferences. The market offers a range of coffee substitutes, including chicory root, barley, and herbal infusions.
Drivers of the Market
The coffee substitute market in Indonesia is expected to witness substantial growth, driven by various factors. Coffee substitutes, such as chicory root, barley, and herbal blends, appeal to consumers seeking caffeine-free beverage options or those looking to explore different flavors. Additionally, the increasing health consciousness and the popularity of alternative beverages have further boosted the demand for coffee substitutes in Indonesia.
Challenges of the Market
The coffee substitute market in Indonesia faces challenges in convincing traditional coffee drinkers to switch to alternatives. Coffee has a strong cultural presence in Indonesia, and introducing substitutes requires innovative marketing strategies and highlighting unique benefits. Price sensitivity is another challenge in the coffee substitute market. Ensuring affordability without compromising on quality can be a significant factor in attracting consumers. Consumer education is vital, as many people may not be aware of the various coffee substitute options available. Manufacturers must promote the health benefits and caffeine-free nature of these alternatives.
COVID-19 Impact on the Market
The coffee substitute market in Indonesia might have experienced modest growth during the pandemic as health-conscious consumers sought alternative beverages. However, the overall market size could still be relatively small compared to traditional coffee products.
Key Highlights of the Report:
- Indonesia Coffee Substitute Market Outlook
- Market Size of Indonesia Coffee Substitute Market, 2025
- Forecast of Indonesia Coffee Substitute Market, 2032
- Historical Data and Forecast of Indonesia Coffee Substitute Revenues & Volume for the Period 2022-2032F
- Indonesia Coffee Substitute Market Trend Evolution
- Indonesia Coffee Substitute Market Drivers and Challenges
- Indonesia Coffee Substitute Price Trends
- Indonesia Coffee Substitute Porter's Five Forces
- Indonesia Coffee Substitute Industry Life Cycle
- Historical Data and Forecast of Indonesia Coffee Substitute Market Revenues & Volume By Nature for the Period 2022-2032F
- Historical Data and Forecast of Indonesia Coffee Substitute Market Revenues & Volume By Organic for the Period 2022-2032F
- Historical Data and Forecast of Indonesia Coffee Substitute Market Revenues & Volume By Conventional for the Period 2022-2032F
- Historical Data and Forecast of Indonesia Coffee Substitute Market Revenues & Volume By Packaging for the Period 2022-2032F
- Historical Data and Forecast of Indonesia Coffee Substitute Market Revenues & Volume By Pouches for the Period 2022-2032F
- Historical Data and Forecast of Indonesia Coffee Substitute Market Revenues & Volume By Cans for the Period 2022-2032F
- Historical Data and Forecast of Indonesia Coffee Substitute Market Revenues & Volume By Aseptic Cartons for the Period 2022-2032F
- Historical Data and Forecast of Indonesia Coffee Substitute Market Revenues & Volume By Distribution Channel for the Period 2022-2032F
- Historical Data and Forecast of Indonesia Coffee Substitute Market Revenues & Volume By Hypermarket/supermarket for the Period 2022-2032F
- Historical Data and Forecast of Indonesia Coffee Substitute Market Revenues & Volume By Convenience Stores for the Period 2022-2032F
- Historical Data and Forecast of Indonesia Coffee Substitute Market Revenues & Volume By Department Stores for the Period 2022-2032F
- Historical Data and Forecast of Indonesia Coffee Substitute Market Revenues & Volume By Online Sales Channel for the Period 2022-2032F
- Indonesia Coffee Substitute Import Export Trade Statistics
- Market Opportunity Assessment By Nature
- Market Opportunity Assessment By Packaging
- Market Opportunity Assessment By Distribution Channel
- Indonesia Coffee Substitute Top Companies Market Share
- Indonesia Coffee Substitute Competitive Benchmarking By Technical and Operational Parameters
- Indonesia Coffee Substitute Company Profiles
- Indonesia Coffee Substitute Key Strategic Recommendations
Indonesia Coffee Substitute Market (2026-2032): FAQs
6Wresearch actively monitors the Indonesia Coffee Substitute Market and publishes its comprehensive annual report, highlighting emerging trends, growth drivers, revenue analysis, and forecast outlook. Our insights help businesses to make data-backed strategic decisions with ongoing market dynamics. Our analysts track relevent industries related to the Indonesia Coffee Substitute Market, allowing our clients with actionable intelligence and reliable forecasts tailored to emerging regional needs.
Yes, we provide customisation as per your requirements. To learn more, feel free to contact us on sales@6wresearch.com
1 Executive Summary |
2 Introduction |
2.1 Key Highlights of the Report |
2.2 Report Description |
2.3 Market Scope & Segmentation |
2.4 Research Methodology |
2.5 Assumptions |
3 Indonesia Coffee Substitute Market Overview |
3.1 Indonesia Country Macro Economic Indicators |
3.2 Indonesia Coffee Substitute Market Revenues & Volume, 2022 & 2032F |
3.3 Indonesia Coffee Substitute Market - Industry Life Cycle |
3.4 Indonesia Coffee Substitute Market - Porter's Five Forces |
3.5 Indonesia Coffee Substitute Market Revenues & Volume Share, By Nature, 2022 & 2032F |
3.6 Indonesia Coffee Substitute Market Revenues & Volume Share, By Packaging, 2022 & 2032F |
3.7 Indonesia Coffee Substitute Market Revenues & Volume Share, By Distribution Channel, 2022 & 2032F |
4 Indonesia Coffee Substitute Market Dynamics |
4.1 Impact Analysis |
4.2 Market Drivers |
4.2.1 Increasing health consciousness among consumers towards reducing caffeine intake |
4.2.2 Growing awareness about the environmental impact of coffee production |
4.2.3 Rising demand for specialty and organic coffee substitutes |
4.3 Market Restraints |
4.3.1 Fluctuating prices of coffee substitutes' raw materials |
4.3.2 Competition from traditional coffee beverages |
4.3.3 Lack of awareness about the benefits of coffee substitutes among consumers |
5 Indonesia Coffee Substitute Market Trends |
6 Indonesia Coffee Substitute Market, By Types |
6.1 Indonesia Coffee Substitute Market, By Nature |
6.1.1 Overview and Analysis |
6.1.2 Indonesia Coffee Substitute Market Revenues & Volume, By Nature, 2022-2032F |
6.1.3 Indonesia Coffee Substitute Market Revenues & Volume, By Organic, 2022-2032F |
6.1.4 Indonesia Coffee Substitute Market Revenues & Volume, By Conventional, 2022-2032F |
6.2 Indonesia Coffee Substitute Market, By Packaging |
6.2.1 Overview and Analysis |
6.2.2 Indonesia Coffee Substitute Market Revenues & Volume, By Pouches, 2022-2032F |
6.2.3 Indonesia Coffee Substitute Market Revenues & Volume, By Cans, 2022-2032F |
6.2.4 Indonesia Coffee Substitute Market Revenues & Volume, By Aseptic Cartons, 2022-2032F |
6.3 Indonesia Coffee Substitute Market, By Distribution Channel |
6.3.1 Overview and Analysis |
6.3.2 Indonesia Coffee Substitute Market Revenues & Volume, By Hypermarket/supermarket, 2022-2032F |
6.3.3 Indonesia Coffee Substitute Market Revenues & Volume, By Convenience Stores, 2022-2032F |
6.3.4 Indonesia Coffee Substitute Market Revenues & Volume, By Department Stores, 2022-2032F |
6.3.5 Indonesia Coffee Substitute Market Revenues & Volume, By Online Sales Channel, 2022-2032F |
7 Indonesia Coffee Substitute Market Import-Export Trade Statistics |
7.1 Indonesia Coffee Substitute Market Export to Major Countries |
7.2 Indonesia Coffee Substitute Market Imports from Major Countries |
8 Indonesia Coffee Substitute Market Key Performance Indicators |
8.1 Number of new product launches in the coffee substitute market |
8.2 Growth in the number of specialty coffee substitute cafes and stores |
8.3 Percentage increase in consumer spending on organic coffee substitutes |
8.4 Adoption rate of innovative coffee substitute ingredients |
8.5 Number of partnerships between coffee substitute companies and health-focused organizations |
9 Indonesia Coffee Substitute Market - Opportunity Assessment |
9.1 Indonesia Coffee Substitute Market Opportunity Assessment, By Nature, 2022 & 2032F |
9.2 Indonesia Coffee Substitute Market Opportunity Assessment, By Packaging, 2022 & 2032F |
9.3 Indonesia Coffee Substitute Market Opportunity Assessment, By Distribution Channel, 2022 & 2032F |
10 Indonesia Coffee Substitute Market - Competitive Landscape |
10.1 Indonesia Coffee Substitute Market Revenue Share, By Companies, 2025 |
10.2 Indonesia Coffee Substitute Market Competitive Benchmarking, By Operating and Technical Parameters |
11 Company Profiles |
12 Recommendations |
13 Disclaimer |
Global Go To Market Strategy - 2030
Export potential enables firms to identify high-growth global markets with greater confidence by combining advanced trade intelligence with a structured quantitative methodology. The framework analyzes emerging demand trends and country-level import patterns while integrating macroeconomic and trade datasets such as GDP and population forecasts, bilateral import–export flows, tariff structures, elasticity differentials between developed and developing economies, geographic distance, and import demand projections. Using weighted trade values from 2020–2024 as the base period to project country-to-country export potential for 2030, these inputs are operationalized through calculated drivers such as gravity model parameters, tariff impact factors, and projected GDP per-capita growth. Through an analysis of hidden potentials, demand hotspots, and market conditions that are most favorable to success, this method enables firms to focus on target countries, maximize returns, and global expansion with data, backed by accuracy.
By factoring in the projected importer demand gap that is currently unmet and could be potential opportunity, it identifies the potential for the Exporter (Country) among 190 countries, against the general trade analysis, which identifies the biggest importer or exporter.
To discover high-growth global markets and optimize your business strategy:
Click Here
Pricing
- Single User License$ 1,995
- Department License$ 2,400
- Site License$ 3,120
- Global License$ 3,795

Leadership Perspectives from Industry Events
Search
Thought Leadership and Analyst Meet


Our Clients
6WResearch In News
- India Export Attractiveness Tracker 2026
- India Air Conditioner Market Set for Strong Rebound in 2026 After Weather-Led Correction and GST-Driven Recovery: 6Wresearch
- ADAS in India: How Automatic Emergency Braking, Blind Spot Detection & Driver Monitoring are Transforming Road Safety
- Doha a strategic location for EV manufacturing hub: IPA Qatar
- Demand for luxury TVs surging in the GCC, says Samsung
- Empowering Growth: The Thriving Journey of Bangladesh’s Cable Industry
Latest Reports
- Nicaragua RPG Gaming Market (2026-2032)
- New Zealand RPG Gaming Market (2026-2032)
- Netherlands RPG Gaming Market (2026-2032)
- Nauru RPG Gaming Market (2026-2032)
- Namibia RPG Gaming Market (2026-2032)
- Mozambique RPG Gaming Market (2026-2032)
- Montenegro RPG Gaming Market (2026-2032)
- Mongolia RPG Gaming Market (2026-2032)
- Monaco RPG Gaming Market (2026-2032)
- Micronesia RPG Gaming Market (2026-2032)
Industry Events and Analyst Meet

EV India Expo 2026

HIMTEX 2026

India Refining Summit 2026

India EV Show 2026

EV tech India Expo 2026
Whitepaper
- Middle East & Africa Commercial Security Market Click here to view more.
- Middle East & Africa Fire Safety Systems & Equipment Market Click here to view more.
- GCC Drone Market Click here to view more.
- Middle East Lighting Fixture Market Click here to view more.
- GCC Physical & Perimeter Security Market Click here to view more.