Indonesia Glue Brush Market (2026-2032) Outlook | Trends, Industry, Value, Share, Size, Companies, Forecast, Analysis, Growth & Revenue
Market Forecast By Type (Wheel Shape, Cotton Swab, Others), By Application (Business Use, Industrial Applications, Others) And Competitive Landscape
| Product Code: ETC252628 | Publication Date: Aug 2023 | Updated Date: Mar 2026 | Product Type: Market Research Report | |
| Publisher: 6Wresearch | Author: Ravi Bhandari | No. of Pages: 75 | No. of Figures: 35 | No. of Tables: 20 |
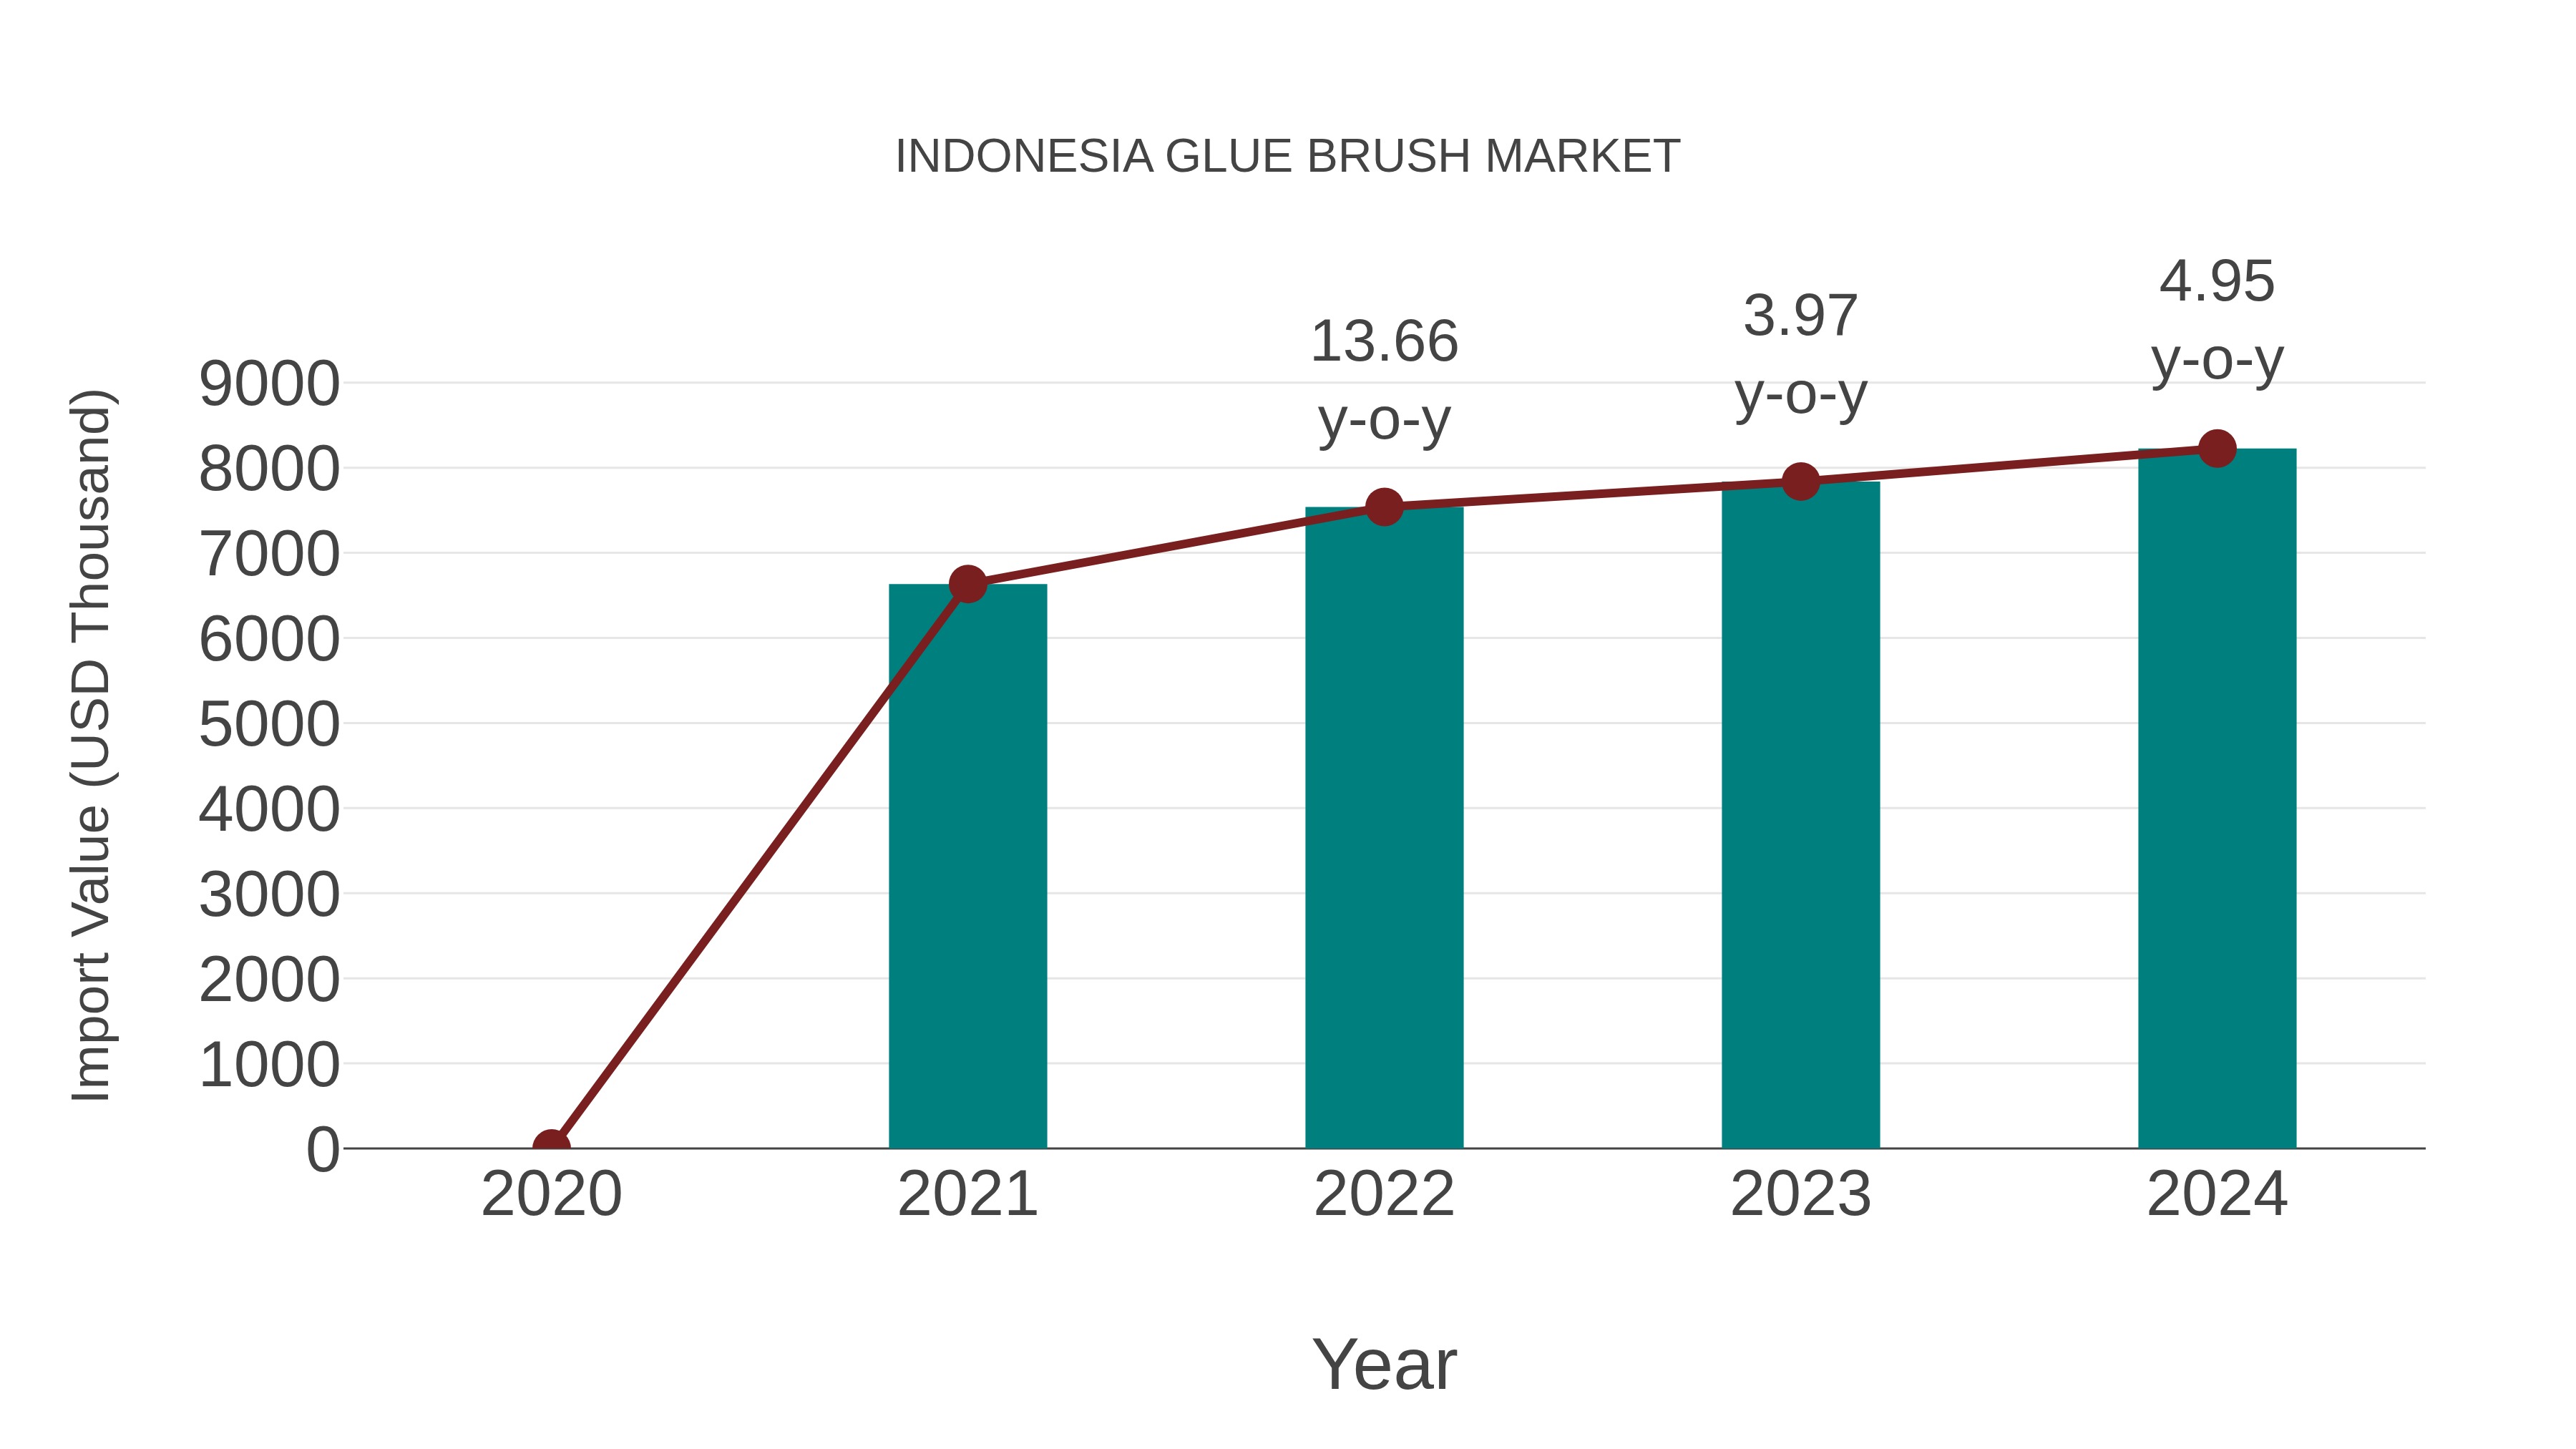
Indonesia Glue Brush Market: Import Trend Analysis
Indonesia`s import trend for the glue brush market showed a growth rate of 4.95% from 2023 to 2024, with a compound annual growth rate (CAGR) of 7.44% from 2020 to 2024. This positive momentum can be attributed to the increased demand for adhesive products in various industries, indicating a stable and expanding market for glue brushes in Indonesia.
Indonesia Glue Brush Market Synopsis
Indonesia is the world`s fourth-largest glue brush market, with a total annual production of around 1. 4 million units. The Indonesia Glue Brush Market has been growing steadily over the last few years, driven by increasing demand from the construction and automotive industries for superior bonding solutions.
Drivers of the Market
The main drivers of growth in Indonesia glue brush market are rising urbanization rates, increased disposable incomes, and economic development. Consumers in Indonesia tend to opt for branded products as they provide better assurance of quality than cheaper options available in local markets. This trend has led to an increase in demand for higher-end brands such as 3M and Loctite among others. Additionally, companies have engaged in aggressive marketing campaigns which have helped boost sales significantly since 2017 when the industry witnessed a steep upsurge due to government initiatives such as tax exemptions on raw materials used to manufacture glue brushes and other related items like adhesives and sealants.
Challenges of the Market
The primary challenge facing manufacturers within this sector is price competition from unbranded/cheap alternatives which are often sold at discounted prices within hypermarkets or through online platforms like Lazada or Tokopedia amongst others. Moreover, there is also a lack of awareness regarding safety standards associated with these products which can potentially lead to accidents if not handled correctly during application processes at work sites or home repair projects etcetera.
COVID-19 Impact on the Market
Covid-19 has disrupted supply chains across multiple sectors worldwide including that of glue brush manufacturing; however, despite these challenges most major players have managed to remain afloat thanks largely due to swift recovery plans implemented by respective governments coupled with stimulus packages issued by corporations dealing within this space.
Key Highlights of the Report:
- Indonesia Glue Brush Market Outlook
- Market Size of Indonesia Glue Brush Market, 2025
- Forecast of Indonesia Glue Brush Market, 2032
- Historical Data and Forecast of Indonesia Glue Brush Revenues & Volume for the Period 2022-2032F
- Indonesia Glue Brush Market Trend Evolution
- Indonesia Glue Brush Market Drivers and Challenges
- Indonesia Glue Brush Price Trends
- Indonesia Glue Brush Porter's Five Forces
- Indonesia Glue Brush Industry Life Cycle
- Historical Data and Forecast of Indonesia Glue Brush Market Revenues & Volume By Type for the Period 2022-2032F
- Historical Data and Forecast of Indonesia Glue Brush Market Revenues & Volume By Wheel Shape for the Period 2022-2032F
- Historical Data and Forecast of Indonesia Glue Brush Market Revenues & Volume By Cotton Swab for the Period 2022-2032F
- Historical Data and Forecast of Indonesia Glue Brush Market Revenues & Volume By Others for the Period 2022-2032F
- Historical Data and Forecast of Indonesia Glue Brush Market Revenues & Volume By Application for the Period 2022-2032F
- Historical Data and Forecast of Indonesia Glue Brush Market Revenues & Volume By Business Use for the Period 2022-2032F
- Historical Data and Forecast of Indonesia Glue Brush Market Revenues & Volume By Industrial Applications for the Period 2022-2032F
- Historical Data and Forecast of Indonesia Glue Brush Market Revenues & Volume By Others for the Period 2022-2032F
- Indonesia Glue Brush Import Export Trade Statistics
- Market Opportunity Assessment By Type
- Market Opportunity Assessment By Application
- Indonesia Glue Brush Top Companies Market Share
- Indonesia Glue Brush Competitive Benchmarking By Technical and Operational Parameters
- Indonesia Glue Brush Company Profiles
- Indonesia Glue Brush Key Strategic Recommendations
Indonesia Glue Brush Market (2026-2032): FAQs
6Wresearch actively monitors the Indonesia Glue Brush Market and publishes its comprehensive annual report, highlighting emerging trends, growth drivers, revenue analysis, and forecast outlook. Our insights help businesses to make data-backed strategic decisions with ongoing market dynamics. Our analysts track relevent industries related to the Indonesia Glue Brush Market, allowing our clients with actionable intelligence and reliable forecasts tailored to emerging regional needs.
Yes, we provide customisation as per your requirements. To learn more, feel free to contact us on sales@6wresearch.com
1 Executive Summary |
2 Introduction |
2.1 Key Highlights of the Report |
2.2 Report Description |
2.3 Market Scope & Segmentation |
2.4 Research Methodology |
2.5 Assumptions |
3 Indonesia Glue Brush Market Overview |
3.1 Indonesia Country Macro Economic Indicators |
3.2 Indonesia Glue Brush Market Revenues & Volume, 2022 & 2032F |
3.3 Indonesia Glue Brush Market - Industry Life Cycle |
3.4 Indonesia Glue Brush Market - Porter's Five Forces |
3.5 Indonesia Glue Brush Market Revenues & Volume Share, By Type, 2022 & 2032F |
3.6 Indonesia Glue Brush Market Revenues & Volume Share, By Application, 2022 & 2032F |
4 Indonesia Glue Brush Market Dynamics |
4.1 Impact Analysis |
4.2 Market Drivers |
4.2.1 Increasing demand for DIY projects and home improvement activities in Indonesia |
4.2.2 Growth in the construction industry leading to higher usage of glue brushes |
4.2.3 Rising awareness about the benefits of using glue brushes for various applications |
4.3 Market Restraints |
4.3.1 Price volatility of raw materials used in glue brush manufacturing |
4.3.2 Intense competition from substitute products like adhesive tapes or glue guns |
5 Indonesia Glue Brush Market Trends |
6 Indonesia Glue Brush Market, By Types |
6.1 Indonesia Glue Brush Market, By Type |
6.1.1 Overview and Analysis |
6.1.2 Indonesia Glue Brush Market Revenues & Volume, By Type, 2022-2032F |
6.1.3 Indonesia Glue Brush Market Revenues & Volume, By Wheel Shape, 2022-2032F |
6.1.4 Indonesia Glue Brush Market Revenues & Volume, By Cotton Swab, 2022-2032F |
6.1.5 Indonesia Glue Brush Market Revenues & Volume, By Others, 2022-2032F |
6.2 Indonesia Glue Brush Market, By Application |
6.2.1 Overview and Analysis |
6.2.2 Indonesia Glue Brush Market Revenues & Volume, By Business Use, 2022-2032F |
6.2.3 Indonesia Glue Brush Market Revenues & Volume, By Industrial Applications, 2022-2032F |
6.2.4 Indonesia Glue Brush Market Revenues & Volume, By Others, 2022-2032F |
7 Indonesia Glue Brush Market Import-Export Trade Statistics |
7.1 Indonesia Glue Brush Market Export to Major Countries |
7.2 Indonesia Glue Brush Market Imports from Major Countries |
8 Indonesia Glue Brush Market Key Performance Indicators |
8.1 Number of new product innovations in the glue brush market |
8.2 Consumer satisfaction levels and feedback on glue brush quality and performance |
8.3 Growth in the number of retailers stocking glue brushes |
9 Indonesia Glue Brush Market - Opportunity Assessment |
9.1 Indonesia Glue Brush Market Opportunity Assessment, By Type, 2022 & 2032F |
9.2 Indonesia Glue Brush Market Opportunity Assessment, By Application, 2022 & 2032F |
10 Indonesia Glue Brush Market - Competitive Landscape |
10.1 Indonesia Glue Brush Market Revenue Share, By Companies, 2025 |
10.2 Indonesia Glue Brush Market Competitive Benchmarking, By Operating and Technical Parameters |
11 Company Profiles |
12 Recommendations |
13 Disclaimer |
Global Go To Market Strategy - 2030
Export potential enables firms to identify high-growth global markets with greater confidence by combining advanced trade intelligence with a structured quantitative methodology. The framework analyzes emerging demand trends and country-level import patterns while integrating macroeconomic and trade datasets such as GDP and population forecasts, bilateral import–export flows, tariff structures, elasticity differentials between developed and developing economies, geographic distance, and import demand projections. Using weighted trade values from 2020–2024 as the base period to project country-to-country export potential for 2030, these inputs are operationalized through calculated drivers such as gravity model parameters, tariff impact factors, and projected GDP per-capita growth. Through an analysis of hidden potentials, demand hotspots, and market conditions that are most favorable to success, this method enables firms to focus on target countries, maximize returns, and global expansion with data, backed by accuracy.
By factoring in the projected importer demand gap that is currently unmet and could be potential opportunity, it identifies the potential for the Exporter (Country) among 190 countries, against the general trade analysis, which identifies the biggest importer or exporter.
To discover high-growth global markets and optimize your business strategy:
Click Here
Pricing
- Single User License$ 1,995
- Department License$ 2,400
- Site License$ 3,120
- Global License$ 3,795

Leadership Perspectives from Industry Events
Search
Thought Leadership and Analyst Meet


Our Clients
6WResearch In News
- India Export Attractiveness Tracker 2026
- India Air Conditioner Market Set for Strong Rebound in 2026 After Weather-Led Correction and GST-Driven Recovery: 6Wresearch
- ADAS in India: How Automatic Emergency Braking, Blind Spot Detection & Driver Monitoring are Transforming Road Safety
- Doha a strategic location for EV manufacturing hub: IPA Qatar
- Demand for luxury TVs surging in the GCC, says Samsung
- Empowering Growth: The Thriving Journey of Bangladesh’s Cable Industry
Latest Reports
- Nicaragua RPG Gaming Market (2026-2032)
- New Zealand RPG Gaming Market (2026-2032)
- Netherlands RPG Gaming Market (2026-2032)
- Nauru RPG Gaming Market (2026-2032)
- Namibia RPG Gaming Market (2026-2032)
- Mozambique RPG Gaming Market (2026-2032)
- Montenegro RPG Gaming Market (2026-2032)
- Mongolia RPG Gaming Market (2026-2032)
- Monaco RPG Gaming Market (2026-2032)
- Micronesia RPG Gaming Market (2026-2032)
Industry Events and Analyst Meet

EV India Expo 2026

HIMTEX 2026

India Refining Summit 2026

India EV Show 2026

EV tech India Expo 2026
Whitepaper
- Middle East & Africa Commercial Security Market Click here to view more.
- Middle East & Africa Fire Safety Systems & Equipment Market Click here to view more.
- GCC Drone Market Click here to view more.
- Middle East Lighting Fixture Market Click here to view more.
- GCC Physical & Perimeter Security Market Click here to view more.