Indonesia Soft Drinks Packaging Market (2026-2032) Outlook | Size, Growth, Analysis, Share, Revenue, Companies, Industry, Forecast, Value & Trends
Market Forecast By Material (Paper, Plastic, Metal, Glass), By Product Type (Cans, Boxes, Bottles, Cartons), By Capacity (Up to 100 ml, 100 to 250 ml, 250 to 500 ml, 500 to 1000 ml, 1000 to 2000 ml, Above 2000 ml), By Application (Carbonated soft drinks, Functional Drinks, Sport Drinks, Energy Drinks, Others, Juices) And Competitive Landscape
| Product Code: ETC189880 | Publication Date: Jul 2023 | Updated Date: Jun 2026 | Product Type: Market Research Report | |
| Publisher: 6Wresearch | Author: Ravi Bhandari | No. of Pages: 60 | No. of Figures: 40 | No. of Tables: 7 |
Indonesia Soft Drinks Packaging Market Size, Share & Growth Rate
The Indonesia Soft Drinks Packaging Market was estimated at USD 262 Million in 2025 and is projected to reach USD 349 Million by 2032, growing at a CAGR of 4.2% from 2026 to 2032. This growth trajectory is underpinned by the rising demand for convenience beverages and a shift in consumer preferences toward healthier options like energy drinks and functional beverages. Additionally, manufacturers are increasingly adopting innovative packaging technologies, further propelling the market's expansion.
Indonesia Soft Drinks Packaging Market Year-wise Growth Rate and Key Drivers
This graph highlights how the Indonesia Soft Drinks Packaging Market has steadily grown over the years, supported by major growth factors.
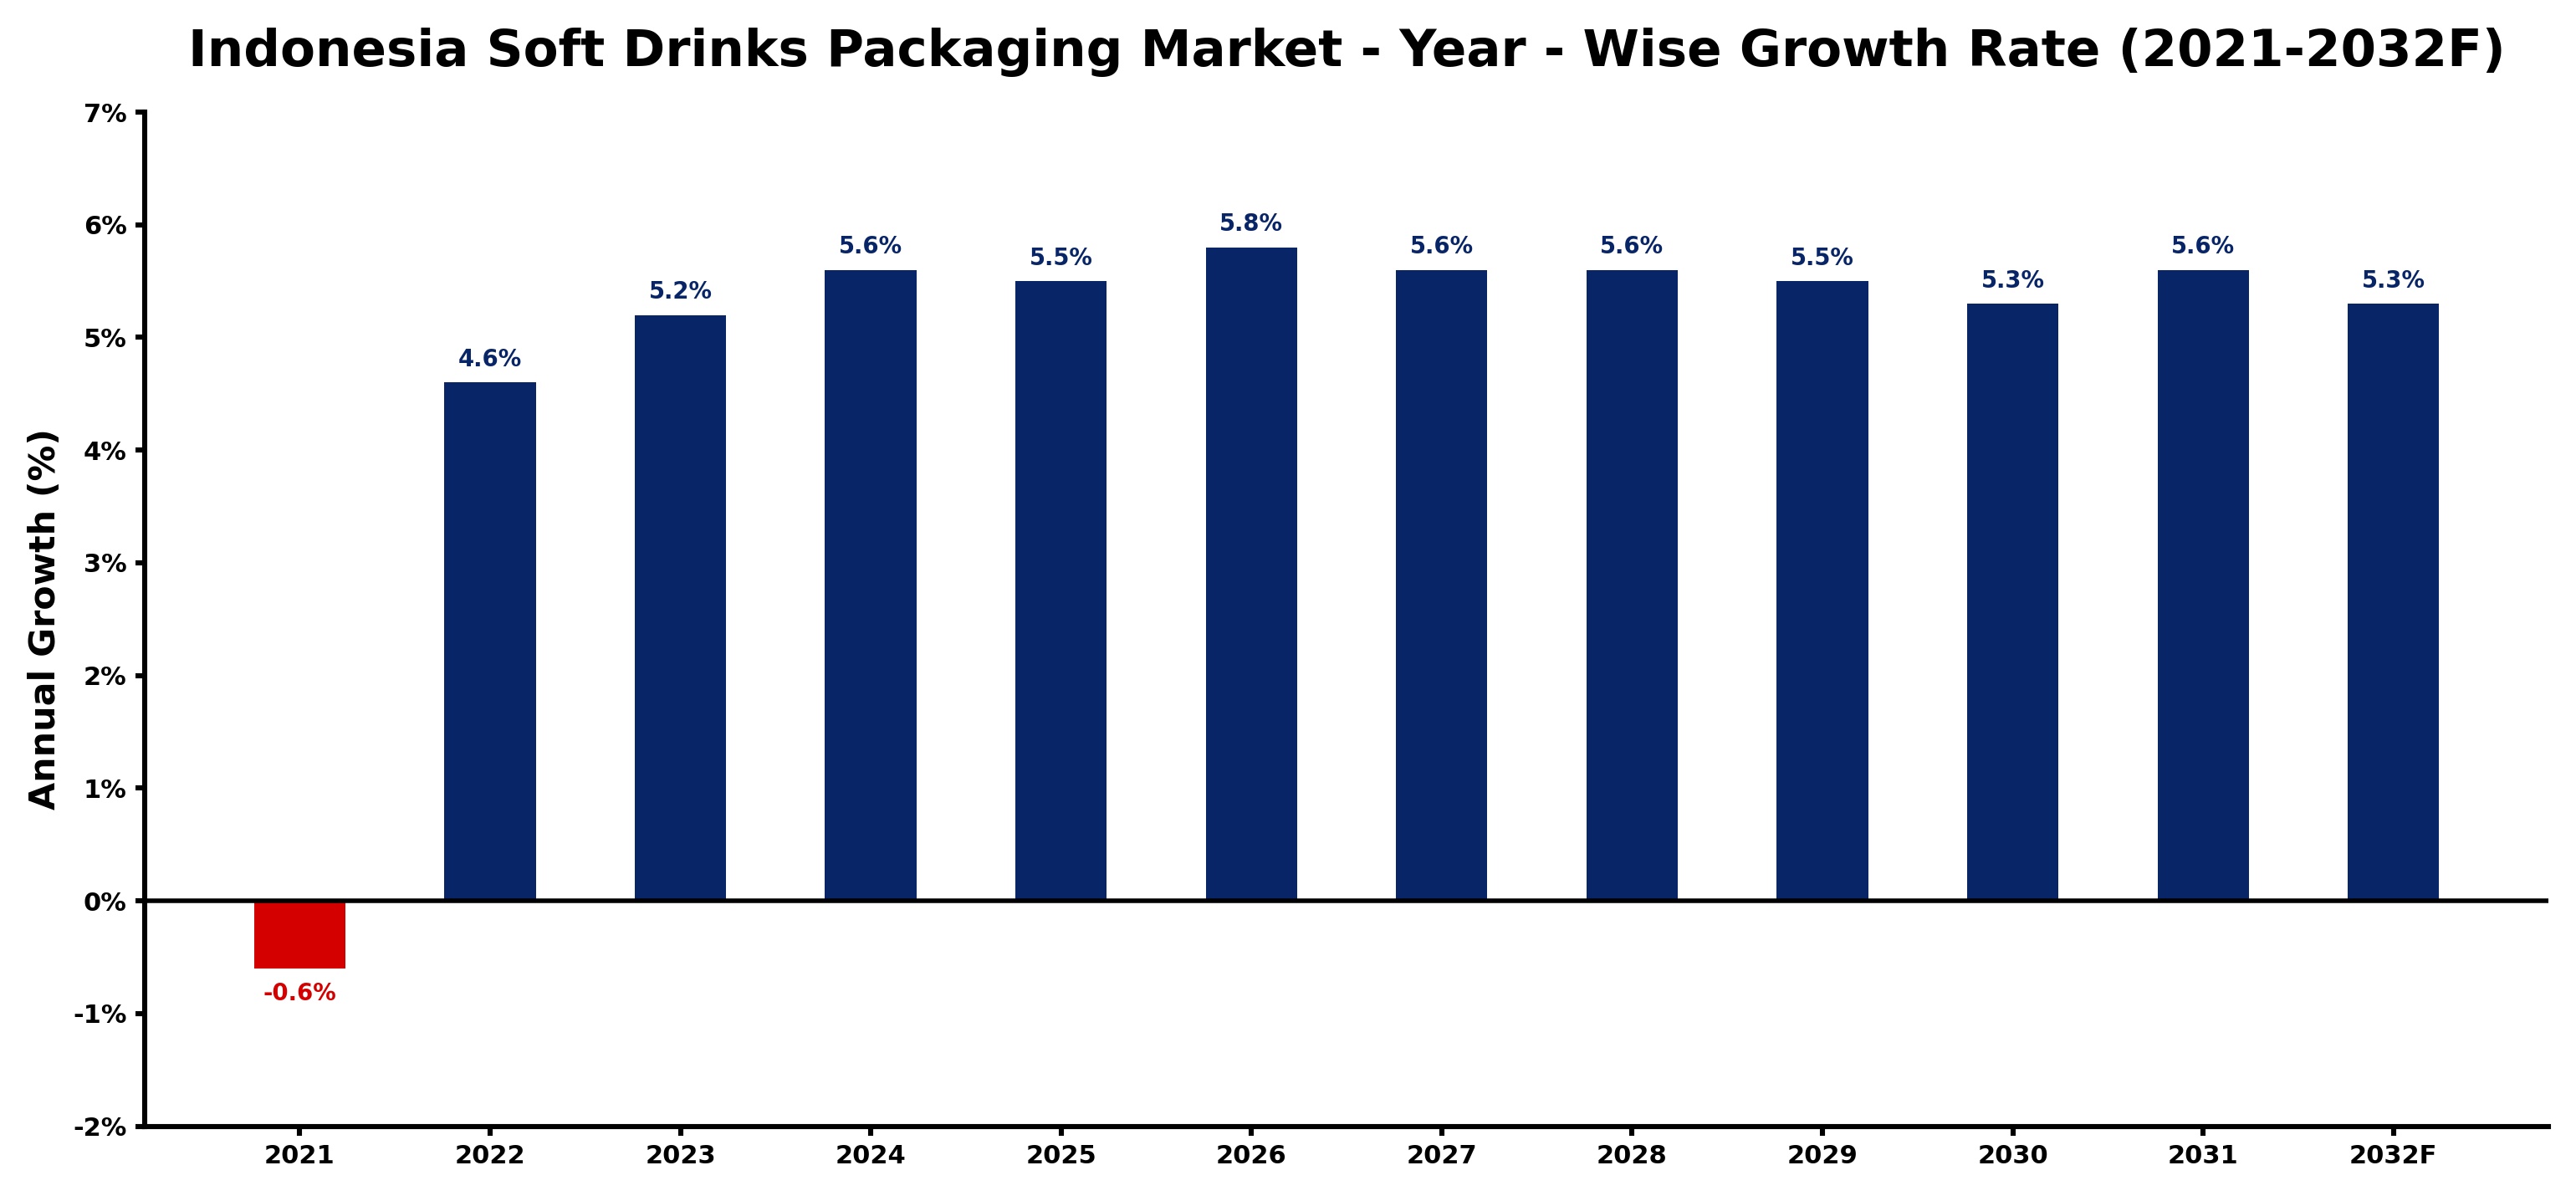
The table below presents the year‑wise growth rates along with the key drivers influencing the market
| Year | Growth Rate | Major Drivers |
| 2021 | -0.6% | Consumer spending declined significantly |
| 2022 | 4.6% | Health-conscious trends drove demand |
| 2023 | 5.2% | Sustainability initiatives enhanced packaging |
| 2024 | 5.6% | E-commerce growth expanded reach |
| 2025 | 5.5% | Innovative packaging solutions emerged |
| 2026 | 5.8% | Local sourcing improved supply chains |
| 2027 | 5.6% | New product launches attracted interest |
| 2028 | 5.6% | Functional beverages gained popularity |
| 2029 | 5.5% | Brand loyalty programs increased sales |
| 2030 | 5.3% | Convenience packaging met consumer needs |
| 2031 | 5.6% | Collaborations with local brands flourished |
| 2032 | 5.3% | Technology integration enhanced efficiency |
Note - Market size estimations and growth projections presented in this report are based on 6Wresearch’s advanced forecasting approach, validated with industry datasets as of June 2026.
Indonesia Soft Drinks Packaging Market Synopsis
The burgeoning demand for convenience in the beverage sector is leading to a significant uptick in soft drinks packaging innovation across Indonesia. Single-serve bottles and cans have emerged as popular choices, aligning perfectly with consumer lifestyles that prioritize on-the-go consumption.
Manufacturers are also responding to consumer desires for sustainable packaging by incorporating eco-friendly materials like glass jars and metal cans. This strategic pivot not only meets consumer expectations but also positions companies favorably in a market increasingly driven by environmental consciousness.
Indonesia Soft Drinks Packaging Market Key Takeaways
- The market is anticipated to grow due to increasing consumer focus on convenience and health-oriented beverages.
- Technological advancements in packaging are driving innovation and improving user experience.
- Environmental sustainability is becoming a pivotal factor influencing packaging choices.
- Government regulations regarding plastic waste management are positively impacting market dynamics.
- Rising disposable income is contributing to the demand for packaged soft drink products.
Evaluation of Restraints in Indonesia Soft Drinks Packaging Market
Despite a promising outlook, the market faces several constraints. The high costs associated with implementing advanced packaging technologies can hinder competition, particularly for small-scale producers. Furthermore, growing environmental concerns regarding plastic use are prompting calls for alternative packaging solutions, which may not be readily available. The industry also grapples with a limited skilled labor force, compounded by stringent regulatory frameworks that could stifle innovation and slow down market penetration efforts.
Indonesia Soft Drinks Packaging Market Trends
Current trends indicate a marked shift towards single-serve packaging solutions, appealing to the on-the-go lifestyle of urban consumers. Moreover, manufacturers are increasingly introducing PET bottles with twist-off caps, enhancing convenience and user-friendliness. Additionally, a rising preference for sustainable packaging materials is pushing companies to innovate beyond traditional plastic. The ongoing technological advancements in smart packaging—such as QR codes for product information—are also reshaping consumer engagement.
Indonesia Soft Drinks Packaging Market Opportunities
The landscape presents numerous growth opportunities, particularly for companies willing to invest in eco-friendly materials and innovative designs. Brands that effectively leverage the rising demand for health-focused beverages and convenience packaging stand to gain a competitive edge. Furthermore, collaboration with local governments on waste management initiatives could foster brand loyalty and enhance sustainability efforts, appealing to the environmentally-conscious consumer.
Government Initiatives in the Indonesia Soft Drinks Packaging Market
The Indonesian government has been proactive in establishing regulations aimed at improving plastic waste management, providing incentives for companies that adopt sustainable packaging practices. Public spending in environmental initiatives is expected to increase, creating an encouraging atmosphere for investments in eco-friendly solutions within the packaging sector. These initiatives aim to reduce plastic pollution and promote a circular economy, which is becoming increasingly vital in today’s market landscape.
Future Insights of the Indonesia Soft Drinks Packaging Market
Looking ahead to 2026-2032, the Indonesia Soft Drinks Packaging Market is poised for substantial growth, driven by evolving consumer preferences and technological innovations. As disposable incomes rise and lifestyles become busier, the demand for convenient packaging solutions will continue to accelerate. Additionally, as environmental awareness grows, companies that prioritize sustainability will likely lead the market. This evolving landscape presents a landscape rich with opportunities for strategic investments and partnerships.
Indonesia Soft Drinks Packaging Market Latest Developments (May 2025 - June 2026)
Recent developments in the market highlight a surge in companies exploring new packaging technologies and materials to meet changing consumer demands. Several manufacturers are now focusing on enhancing their product offerings with sustainable materials and smarter designs. The trend towards online shopping has also prompted shifts in packaging strategies, as brands aim to ensure product integrity during transit while reducing environmental footprints. These industry movements indicate a dynamic and responsive market landscape.
Indonesia Soft Drinks Packaging Market - Key Attractiveness of the Report
- 10 Years of Market Numbers
- Historical Data Starting from 2022 to 2025
- Base Year: 2025
- Forecast Data until 2032
- Key Performance Indicators Impacting the Market
- Major Upcoming Developments and Projects
Key Highlights of the Report:
- Indonesia Soft Drinks Packaging Market Outlook
- Market Size of Indonesia Soft Drinks Packaging Market, 2025
- Forecast of Indonesia Soft Drinks Packaging Market, 2032
- Historical Data and Forecast of Indonesia Soft Drinks Packaging Revenues & Volume for the Period 2022-2032F
- Indonesia Soft Drinks Packaging Market Trend Evolution
- Indonesia Soft Drinks Packaging Market Drivers and Challenges
- Indonesia Soft Drinks Packaging Price Trends
- Indonesia Soft Drinks Packaging Porter's Five Forces
- Indonesia Soft Drinks Packaging Industry Life Cycle
- Historical Data and Forecast of Indonesia Soft Drinks Packaging Market Revenues & Volume By Material for the Period 2022-2032F
- Historical Data and Forecast of Indonesia Soft Drinks Packaging Market Revenues & Volume By Paper for the Period 2022-2032F
- Historical Data and Forecast of Indonesia Soft Drinks Packaging Market Revenues & Volume By Plastic for the Period 2022-2032F
- Historical Data and Forecast of Indonesia Soft Drinks Packaging Market Revenues & Volume By Metal for the Period 2022-2032F
- Historical Data and Forecast of Indonesia Soft Drinks Packaging Market Revenues & Volume By Glass for the Period 2022-2032F
- Historical Data and Forecast of Indonesia Soft Drinks Packaging Market Revenues & Volume By for the Period 2022-2032F
- Historical Data and Forecast of Indonesia Soft Drinks Packaging Market Revenues & Volume By for the Period 2022-2032F
- Historical Data and Forecast of Indonesia Soft Drinks Packaging Market Revenues & Volume By Product Type for the Period 2022-2032F
- Historical Data and Forecast of Indonesia Soft Drinks Packaging Market Revenues & Volume By Cans for the Period 2022-2032F
- Historical Data and Forecast of Indonesia Soft Drinks Packaging Market Revenues & Volume By Boxes for the Period 2022-2032F
- Historical Data and Forecast of Indonesia Soft Drinks Packaging Market Revenues & Volume By Bottles for the Period 2022-2032F
- Historical Data and Forecast of Indonesia Soft Drinks Packaging Market Revenues & Volume By Cartons for the Period 2022-2032F
- Historical Data and Forecast of Indonesia Soft Drinks Packaging Market Revenues & Volume By for the Period 2022-2032F
- Historical Data and Forecast of Indonesia Soft Drinks Packaging Market Revenues & Volume By for the Period 2022-2032F
- Historical Data and Forecast of Indonesia Soft Drinks Packaging Market Revenues & Volume By Capacity for the Period 2022-2032F
- Historical Data and Forecast of Indonesia Soft Drinks Packaging Market Revenues & Volume By Up to 100 ml for the Period 2022-2032F
- Historical Data and Forecast of Indonesia Soft Drinks Packaging Market Revenues & Volume By 100 to 250 ml for the Period 2022-2032F
- Historical Data and Forecast of Indonesia Soft Drinks Packaging Market Revenues & Volume By 250 to 500 ml for the Period 2022-2032F
- Historical Data and Forecast of Indonesia Soft Drinks Packaging Market Revenues & Volume By 500 to 1000 ml for the Period 2022-2032F
- Historical Data and Forecast of Indonesia Soft Drinks Packaging Market Revenues & Volume By 1000 to 2000 ml for the Period 2022-2032F
- Historical Data and Forecast of Indonesia Soft Drinks Packaging Market Revenues & Volume By Above 2000 ml for the Period 2022-2032F
- Historical Data and Forecast of Indonesia Soft Drinks Packaging Market Revenues & Volume By Application for the Period 2022-2032F
- Historical Data and Forecast of Indonesia Soft Drinks Packaging Market Revenues & Volume By Carbonated soft drinks for the Period 2022-2032F
- Historical Data and Forecast of Indonesia Soft Drinks Packaging Market Revenues & Volume By Functional Drinks for the Period 2022-2032F
- Historical Data and Forecast of Indonesia Soft Drinks Packaging Market Revenues & Volume By Sport Drinks for the Period 2022-2032F
- Historical Data and Forecast of Indonesia Soft Drinks Packaging Market Revenues & Volume By Energy Drinks for the Period 2022-2032F
- Historical Data and Forecast of Indonesia Soft Drinks Packaging Market Revenues & Volume By Others for the Period 2022-2032F
- Historical Data and Forecast of Indonesia Soft Drinks Packaging Market Revenues & Volume By Juices for the Period 2022-2032F
- Indonesia Soft Drinks Packaging Import Export Trade Statistics
- Market Opportunity Assessment By Material
- Market Opportunity Assessment By Product Type
- Market Opportunity Assessment By Capacity
- Market Opportunity Assessment By Application
- Indonesia Soft Drinks Packaging Top Companies Market Share
- Indonesia Soft Drinks Packaging Competitive Benchmarking By Technical and Operational Parameters
- Indonesia Soft Drinks Packaging Company Profiles
- Indonesia Soft Drinks Packaging Key Strategic Recommendations
Indonesia Soft Drinks Packaging Market - Frequently Asked Questions
The market is projected to grow at a CAGR of 4.2% from 2026 to 2032, increasing from USD 262 Million in 2025 to USD 349 Million by 2032.
Single-serve bottles and cans are becoming increasingly popular among consumers for their convenience and portability, catering to modern lifestyles.
Favorable government regulations focused on plastic waste management are creating a positive environment for market growth, encouraging manufacturers to adopt sustainable practices.
Key trends include the rise of eco-friendly materials, advancements in smart packaging technology, and the demand for user-friendly designs like twist-off caps.
Changing consumer preferences toward health and convenience are driving manufacturers to innovate their packaging solutions, making them more appealing and accessible.
6Wresearch actively monitors the Indonesia Soft Drinks Packaging Market and publishes its comprehensive annual report, highlighting emerging trends, growth drivers, revenue analysis, and forecast outlook. Our insights help businesses to make data-backed strategic decisions with ongoing market dynamics. Our analysts track relevent industries related to the Indonesia Soft Drinks Packaging Market, allowing our clients with actionable intelligence and reliable forecasts tailored to emerging regional needs.
Yes, we provide customisation as per your requirements. To learn more, feel free to contact us on sales@6wresearch.com
1 Executive Summary |
2 Introduction |
2.1 Key Highlights of the Report |
2.2 Report Description |
2.3 Market Scope & Segmentation |
2.4 Research Methodology |
2.5 Assumptions |
3 Indonesia Soft Drinks Packaging Market Overview |
3.1 Indonesia Country Macro Economic Indicators |
3.2 Indonesia Soft Drinks Packaging Market Revenues & Volume, 2022 & 2032F |
3.3 Indonesia Soft Drinks Packaging Market - Industry Life Cycle |
3.4 Indonesia Soft Drinks Packaging Market - Porter's Five Forces |
3.5 Indonesia Soft Drinks Packaging Market Revenues & Volume Share, By Material, 2022 & 2032F |
3.6 Indonesia Soft Drinks Packaging Market Revenues & Volume Share, By Product Type, 2022 & 2032F |
3.7 Indonesia Soft Drinks Packaging Market Revenues & Volume Share, By Capacity, 2022 & 2032F |
3.8 Indonesia Soft Drinks Packaging Market Revenues & Volume Share, By Application, 2022 & 2032F |
4 Indonesia Soft Drinks Packaging Market Dynamics |
4.1 Impact Analysis |
4.2 Market Drivers |
4.2.1 Increasing disposable income of consumers in Indonesia leading to higher spending on soft drinks |
4.2.2 Growing awareness about health and wellness, driving demand for healthier soft drink options |
4.2.3 Expanding urban population and changing lifestyle preferences favoring convenience and on-the-go consumption of soft drinks |
4.3 Market Restraints |
4.3.1 Environmental concerns related to plastic packaging leading to potential regulatory restrictions |
4.3.2 Fluctuating raw material prices impacting production costs of soft drinks packaging |
4.3.3 Intense competition among soft drink brands leading to pricing pressures and innovation challenges |
5 Indonesia Soft Drinks Packaging Market Trends |
6 Indonesia Soft Drinks Packaging Market, By Types |
6.1 Indonesia Soft Drinks Packaging Market, By Material |
6.1.1 Overview and Analysis |
6.1.2 Indonesia Soft Drinks Packaging Market Revenues & Volume, By Material, 2022-2032F |
6.1.3 Indonesia Soft Drinks Packaging Market Revenues & Volume, By Paper, 2022-2032F |
6.1.4 Indonesia Soft Drinks Packaging Market Revenues & Volume, By Plastic, 2022-2032F |
6.1.5 Indonesia Soft Drinks Packaging Market Revenues & Volume, By Metal, 2022-2032F |
6.1.6 Indonesia Soft Drinks Packaging Market Revenues & Volume, By Glass, 2022-2032F |
6.1.7 Indonesia Soft Drinks Packaging Market Revenues & Volume, By , 2022-2032F |
6.1.8 Indonesia Soft Drinks Packaging Market Revenues & Volume, By , 2022-2032F |
6.2 Indonesia Soft Drinks Packaging Market, By Product Type |
6.2.1 Overview and Analysis |
6.2.2 Indonesia Soft Drinks Packaging Market Revenues & Volume, By Cans, 2022-2032F |
6.2.3 Indonesia Soft Drinks Packaging Market Revenues & Volume, By Boxes, 2022-2032F |
6.2.4 Indonesia Soft Drinks Packaging Market Revenues & Volume, By Bottles, 2022-2032F |
6.2.5 Indonesia Soft Drinks Packaging Market Revenues & Volume, By Cartons, 2022-2032F |
6.2.6 Indonesia Soft Drinks Packaging Market Revenues & Volume, By , 2022-2032F |
6.2.7 Indonesia Soft Drinks Packaging Market Revenues & Volume, By , 2022-2032F |
6.3 Indonesia Soft Drinks Packaging Market, By Capacity |
6.3.1 Overview and Analysis |
6.3.2 Indonesia Soft Drinks Packaging Market Revenues & Volume, By Up to 100 ml, 2022-2032F |
6.3.3 Indonesia Soft Drinks Packaging Market Revenues & Volume, By 100 to 250 ml, 2022-2032F |
6.3.4 Indonesia Soft Drinks Packaging Market Revenues & Volume, By 250 to 500 ml, 2022-2032F |
6.3.5 Indonesia Soft Drinks Packaging Market Revenues & Volume, By 500 to 1000 ml, 2022-2032F |
6.3.6 Indonesia Soft Drinks Packaging Market Revenues & Volume, By 1000 to 2000 ml, 2022-2032F |
6.3.7 Indonesia Soft Drinks Packaging Market Revenues & Volume, By Above 2000 ml, 2022-2032F |
6.4 Indonesia Soft Drinks Packaging Market, By Application |
6.4.1 Overview and Analysis |
6.4.2 Indonesia Soft Drinks Packaging Market Revenues & Volume, By Carbonated soft drinks, 2022-2032F |
6.4.3 Indonesia Soft Drinks Packaging Market Revenues & Volume, By Functional Drinks, 2022-2032F |
6.4.4 Indonesia Soft Drinks Packaging Market Revenues & Volume, By Sport Drinks, 2022-2032F |
6.4.5 Indonesia Soft Drinks Packaging Market Revenues & Volume, By Energy Drinks, 2022-2032F |
6.4.6 Indonesia Soft Drinks Packaging Market Revenues & Volume, By Others, 2022-2032F |
6.4.7 Indonesia Soft Drinks Packaging Market Revenues & Volume, By Juices, 2022-2032F |
7 Indonesia Soft Drinks Packaging Market Import-Export Trade Statistics |
7.1 Indonesia Soft Drinks Packaging Market Export to Major Countries |
7.2 Indonesia Soft Drinks Packaging Market Imports from Major Countries |
8 Indonesia Soft Drinks Packaging Market Key Performance Indicators |
8.1 Percentage of soft drinks packaging made from sustainable materials |
8.2 Rate of adoption of eco-friendly packaging solutions in the soft drinks industry |
8.3 Consumer perception and preference for recyclable packaging options |
9 Indonesia Soft Drinks Packaging Market - Opportunity Assessment |
9.1 Indonesia Soft Drinks Packaging Market Opportunity Assessment, By Material, 2022 & 2032F |
9.2 Indonesia Soft Drinks Packaging Market Opportunity Assessment, By Product Type, 2022 & 2032F |
9.3 Indonesia Soft Drinks Packaging Market Opportunity Assessment, By Capacity, 2022 & 2032F |
9.4 Indonesia Soft Drinks Packaging Market Opportunity Assessment, By Application, 2022 & 2032F |
10 Indonesia Soft Drinks Packaging Market - Competitive Landscape |
10.1 Indonesia Soft Drinks Packaging Market Revenue Share, By Companies, 2025 |
10.2 Indonesia Soft Drinks Packaging Market Competitive Benchmarking, By Operating and Technical Parameters |
11 Company Profiles |
12 Recommendations |
13 Disclaimer |
Global Go To Market Strategy - 2030
Export potential enables firms to identify high-growth global markets with greater confidence by combining advanced trade intelligence with a structured quantitative methodology. The framework analyzes emerging demand trends and country-level import patterns while integrating macroeconomic and trade datasets such as GDP and population forecasts, bilateral import–export flows, tariff structures, elasticity differentials between developed and developing economies, geographic distance, and import demand projections. Using weighted trade values from 2020–2024 as the base period to project country-to-country export potential for 2030, these inputs are operationalized through calculated drivers such as gravity model parameters, tariff impact factors, and projected GDP per-capita growth. Through an analysis of hidden potentials, demand hotspots, and market conditions that are most favorable to success, this method enables firms to focus on target countries, maximize returns, and global expansion with data, backed by accuracy.
By factoring in the projected importer demand gap that is currently unmet and could be potential opportunity, it identifies the potential for the Exporter (Country) among 190 countries, against the general trade analysis, which identifies the biggest importer or exporter.
To discover high-growth global markets and optimize your business strategy:
Click Here
Pricing
- Single User License$ 1,995
- Department License$ 2,400
- Site License$ 3,120
- Global License$ 3,795

Leadership Perspectives from Industry Events
Search
Thought Leadership and Analyst Meet


Our Clients
6WResearch In News
- India Air Conditioner Market Set for Strong Rebound in 2026 After Weather-Led Correction and GST-Driven Recovery: 6Wresearch
- ADAS in India: How Automatic Emergency Braking, Blind Spot Detection & Driver Monitoring are Transforming Road Safety
- Doha a strategic location for EV manufacturing hub: IPA Qatar
- Demand for luxury TVs surging in the GCC, says Samsung
- Empowering Growth: The Thriving Journey of Bangladesh’s Cable Industry
- Demand for luxury TVs surging in the GCC, says Samsung
Latest Reports
- Nicaragua RPG Gaming Market (2026-2032)
- New Zealand RPG Gaming Market (2026-2032)
- Netherlands RPG Gaming Market (2026-2032)
- Nauru RPG Gaming Market (2026-2032)
- Namibia RPG Gaming Market (2026-2032)
- Mozambique RPG Gaming Market (2026-2032)
- Montenegro RPG Gaming Market (2026-2032)
- Mongolia RPG Gaming Market (2026-2032)
- Monaco RPG Gaming Market (2026-2032)
- Micronesia RPG Gaming Market (2026-2032)
Industry Events and Analyst Meet

EV India Expo 2026

HIMTEX 2026

India Refining Summit 2026

India EV Show 2026

EV tech India Expo 2026
Whitepaper
- Middle East & Africa Commercial Security Market Click here to view more.
- Middle East & Africa Fire Safety Systems & Equipment Market Click here to view more.
- GCC Drone Market Click here to view more.
- Middle East Lighting Fixture Market Click here to view more.
- GCC Physical & Perimeter Security Market Click here to view more.