Indonesia Ultra-thin Glass Market (2026-2032) Outlook | Trends, Companies, Industry, Analysis, Share, Revenue, Value, Growth, Forecast & Size
Market Forecast By Manufacturing Process (Float, Fusion, Down-Draw), By Application (Semiconductor Substrate, Touch Panel Display, Fingerprint Sensor) And Competitive Landscape
| Product Code: ETC4497089 | Publication Date: Jul 2023 | Updated Date: Mar 2026 | Product Type: Report | |
| Publisher: 6Wresearch | Author: Ravi Bhandari | No. of Pages: 85 | No. of Figures: 45 | No. of Tables: 25 |
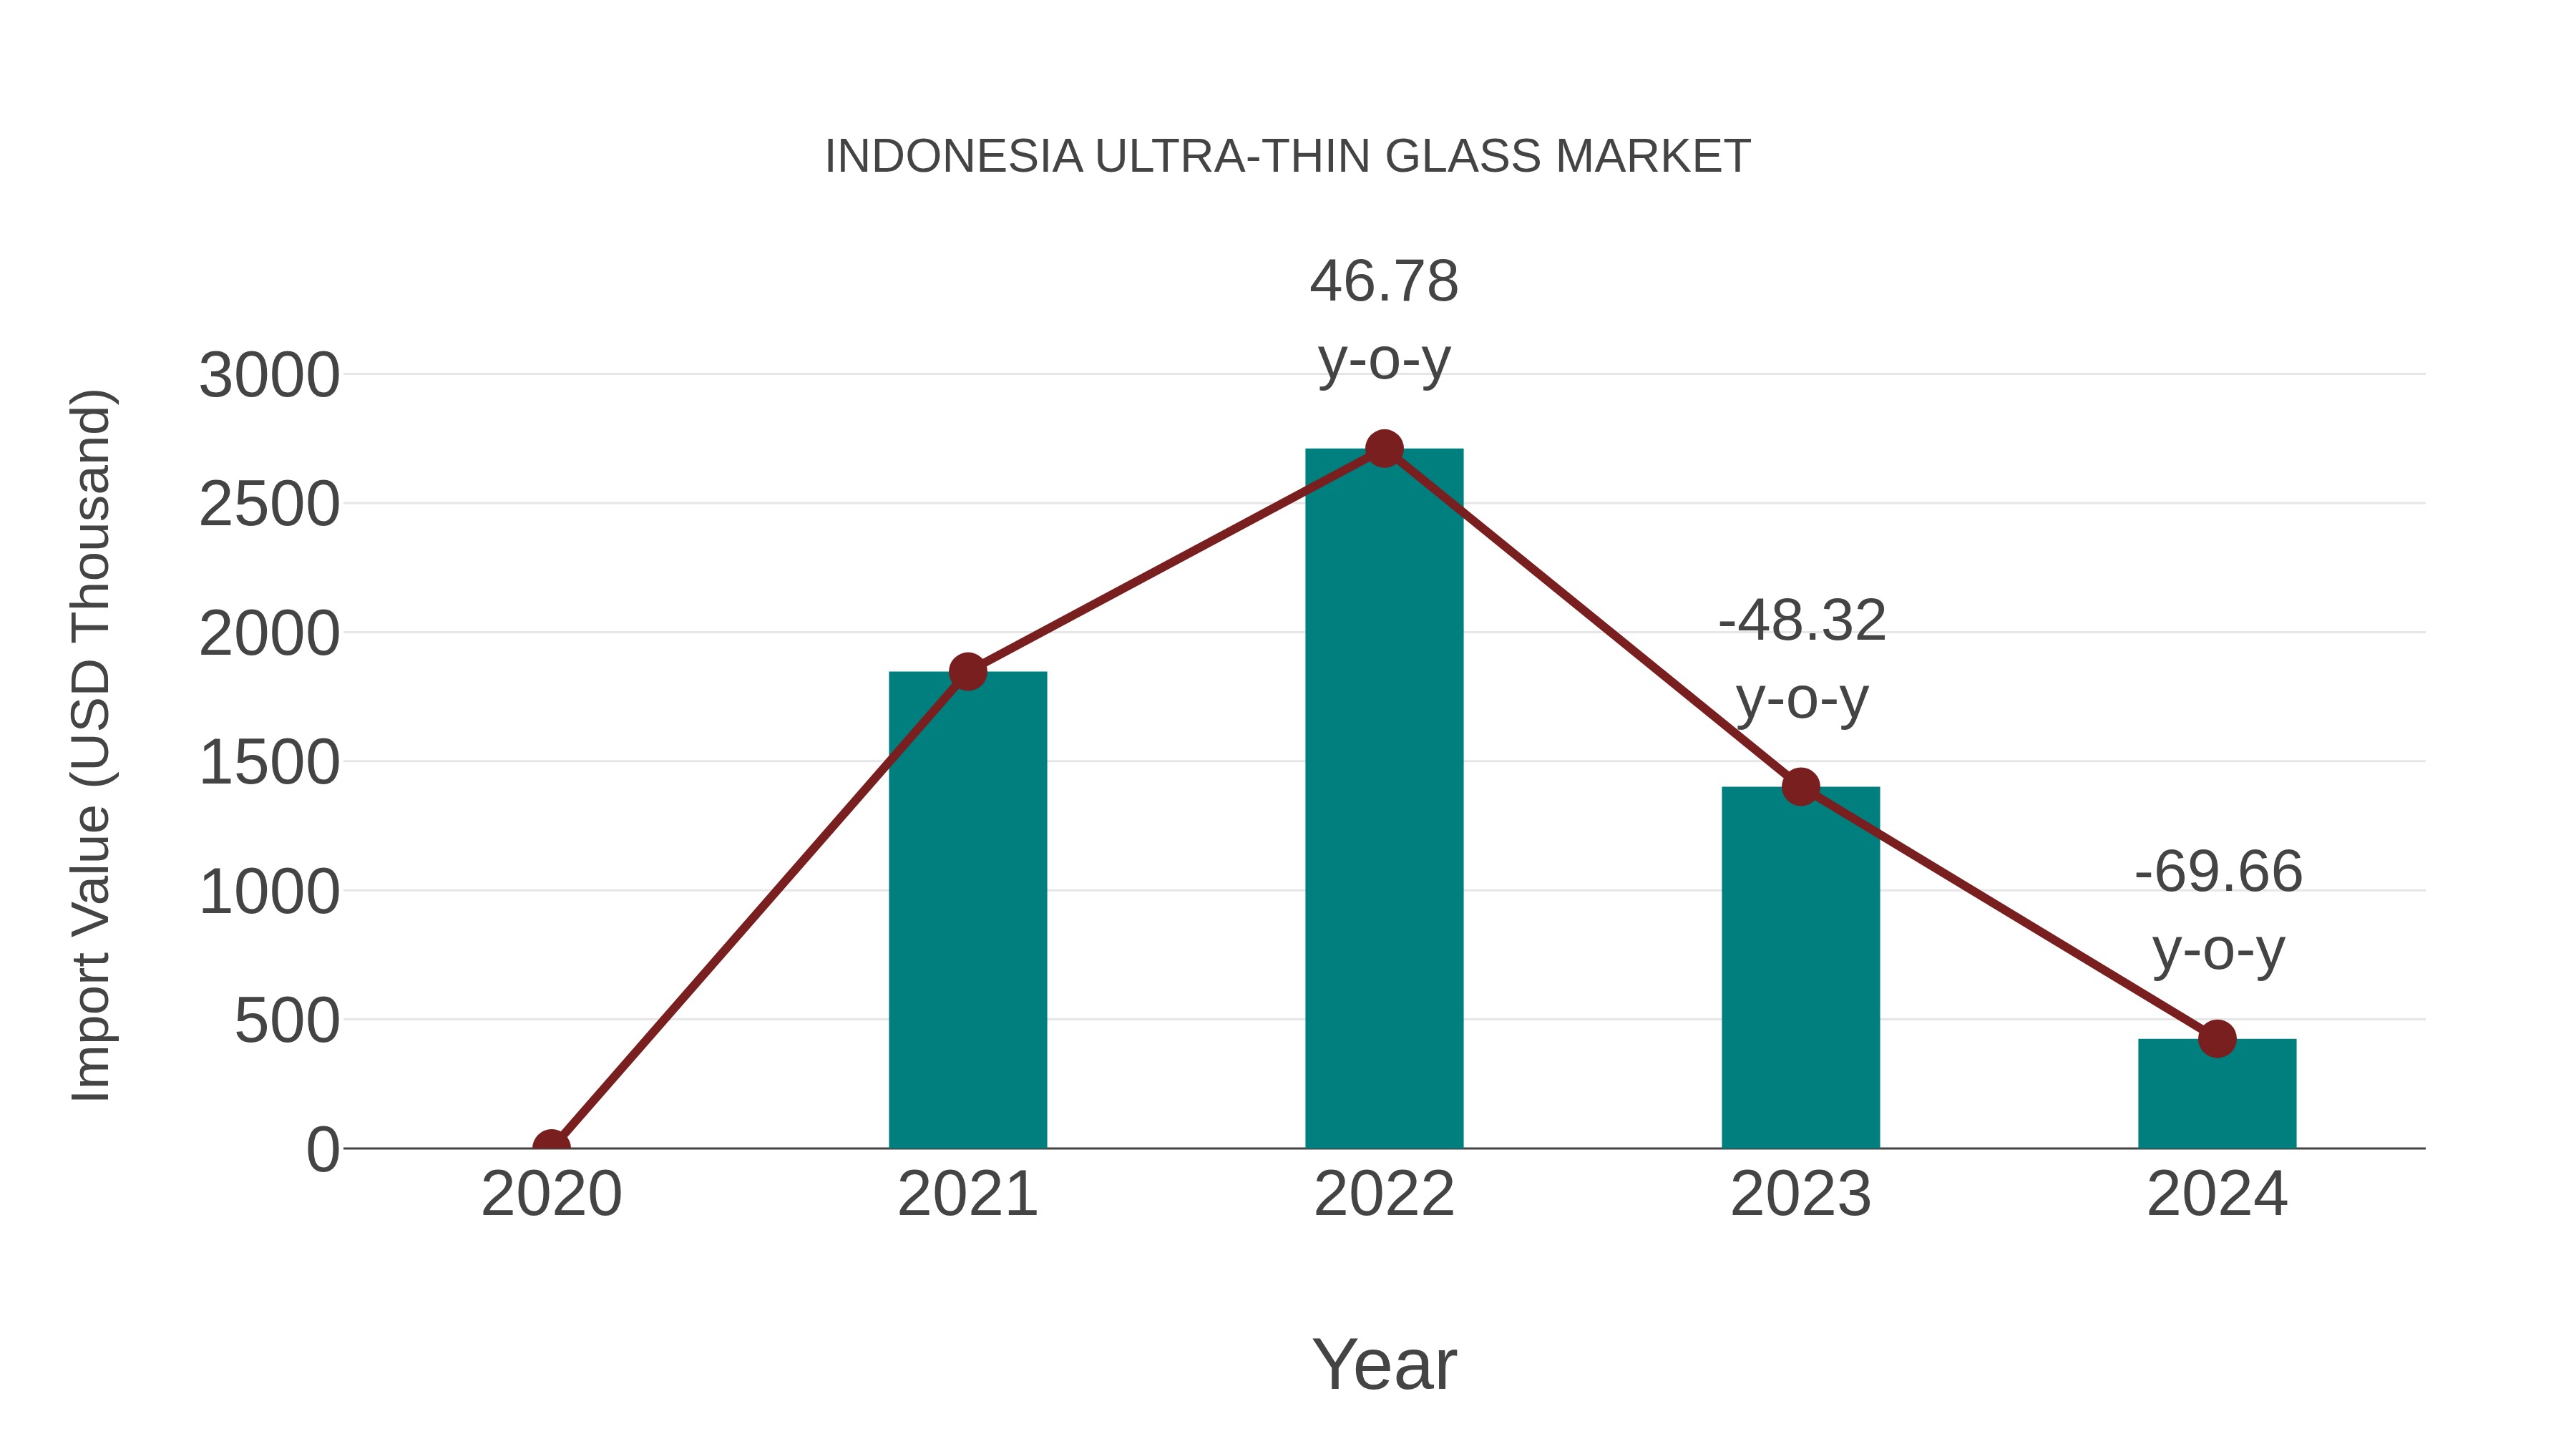
Indonesia Ultra-thin Glass Market: Import Trend Analysis
Indonesia`s import trend for ultra-thin glass in 2023-2024 experienced a significant decline of -69.66%, with a compound annual growth rate (CAGR) of -38.72% from 2020-2024. This drastic reduction can be attributed to a notable shift in demand dynamics or potential changes in trade policies affecting the market stability.
Indonesia Ultra Thin Glass Market Overview
Ultra-thin glass is essential in applications like smartphones, displays, and optical devices. Indonesia`s growing electronics sector has created a thriving market for ultra-thin glass products, reflecting the increasing demand for sleek and lightweight displays.
Drivers of the Market
The ultra-thin glass market is gaining traction in Indonesia due to its use in various electronic devices, including smartphones, tablets, and displays. The trend towards sleek and lightweight devices is boosting the demand for ultra-thin glass. Advancements in display technology and the need for higher screen resolutions are also driving the market.
Challenges of the Market
Ultra-thin glass market challenges include precision manufacturing and the fragility of the product. Production requires high precision, and transportation and handling of ultra-thin glass sheets can be a logistical challenge due to their vulnerability to breakage.
COVID-19 Impacts on the Market
The Indonesia ultra-thin glass market encountered a series of impacts during the COVID-19 pandemic. Ultra-thin glass is used in various applications, including electronics and displays. As the pandemic disrupted global supply chains and reduced consumer spending, there were challenges in the production and demand for electronic devices that use ultra-thin glass. The market experienced fluctuations and delays, but as economies reopened and consumer demand increased, there was a gradual recovery in the ultra-thin glass market.
Key Players of the Makret
Key players in the ultra-thin glass market include PT. Asahimas Flat Glass Tbk and PT. Trias Sentosa Tbk. These companies are involved in the production of ultra-thin glass for applications like consumer electronics and displays.
Key Highlights of the Report:
- Indonesia Ultra-thin Glass Market Outlook
- Market Size of Indonesia Ultra-thin Glass Market, 2025
- Forecast of Indonesia Ultra-thin Glass Market, 2032
- Historical Data and Forecast of Indonesia Ultra-thin Glass Revenues & Volume for the Period 2022-2032F
- Indonesia Ultra-thin Glass Market Trend Evolution
- Indonesia Ultra-thin Glass Market Drivers and Challenges
- Indonesia Ultra-thin Glass Price Trends
- Indonesia Ultra-thin Glass Porter's Five Forces
- Indonesia Ultra-thin Glass Industry Life Cycle
- Historical Data and Forecast of Indonesia Ultra-thin Glass Market Revenues & Volume By Manufacturing Process for the Period 2022-2032F
- Historical Data and Forecast of Indonesia Ultra-thin Glass Market Revenues & Volume By Float for the Period 2022-2032F
- Historical Data and Forecast of Indonesia Ultra-thin Glass Market Revenues & Volume By Fusion for the Period 2022-2032F
- Historical Data and Forecast of Indonesia Ultra-thin Glass Market Revenues & Volume By Down-Draw for the Period 2022-2032F
- Historical Data and Forecast of Indonesia Ultra-thin Glass Market Revenues & Volume By Application for the Period 2022-2032F
- Historical Data and Forecast of Indonesia Ultra-thin Glass Market Revenues & Volume By Semiconductor Substrate for the Period 2022-2032F
- Historical Data and Forecast of Indonesia Ultra-thin Glass Market Revenues & Volume By Touch Panel Display for the Period 2022-2032F
- Historical Data and Forecast of Indonesia Ultra-thin Glass Market Revenues & Volume By Fingerprint Sensor for the Period 2022-2032F
- Indonesia Ultra-thin Glass Import Export Trade Statistics
- Market Opportunity Assessment By Manufacturing Process
- Market Opportunity Assessment By Application
- Indonesia Ultra-thin Glass Top Companies Market Share
- Indonesia Ultra-thin Glass Competitive Benchmarking By Technical and Operational Parameters
- Indonesia Ultra-thin Glass Company Profiles
- Indonesia Ultra-thin Glass Key Strategic Recommendations
Indonesia Ultra-thin Glass Market (2026-2032): FAQs
6Wresearch actively monitors the Indonesia Ultra-thin Glass Market and publishes its comprehensive annual report, highlighting emerging trends, growth drivers, revenue analysis, and forecast outlook. Our insights help businesses to make data-backed strategic decisions with ongoing market dynamics. Our analysts track relevent industries related to the Indonesia Ultra-thin Glass Market, allowing our clients with actionable intelligence and reliable forecasts tailored to emerging regional needs.
Yes, we provide customisation as per your requirements. To learn more, feel free to contact us on sales@6wresearch.com
1 Executive Summary |
2 Introduction |
2.1 Key Highlights of the Report |
2.2 Report Description |
2.3 Market Scope & Segmentation |
2.4 Research Methodology |
2.5 Assumptions |
3 Indonesia Ultra-thin Glass Market Overview |
3.1 Indonesia Country Macro Economic Indicators |
3.2 Indonesia Ultra-thin Glass Market Revenues & Volume, 2022 & 2032F |
3.3 Indonesia Ultra-thin Glass Market - Industry Life Cycle |
3.4 Indonesia Ultra-thin Glass Market - Porter's Five Forces |
3.5 Indonesia Ultra-thin Glass Market Revenues & Volume Share, By Manufacturing Process, 2022 & 2032F |
3.6 Indonesia Ultra-thin Glass Market Revenues & Volume Share, By Application, 2022 & 2032F |
4 Indonesia Ultra-thin Glass Market Dynamics |
4.1 Impact Analysis |
4.2 Market Drivers |
4.2.1 Increasing demand for lightweight and durable materials in industries such as electronics, automotive, and construction. |
4.2.2 Growing focus on sustainability and energy efficiency, driving the adoption of ultra-thin glass for green building solutions. |
4.2.3 Technological advancements leading to the development of ultra-thin glass with improved strength and flexibility. |
4.3 Market Restraints |
4.3.1 High initial investment required for setting up manufacturing facilities for ultra-thin glass. |
4.3.2 Competition from alternative materials such as plastics and polycarbonates. |
4.3.3 Limited availability of skilled labor for the production of ultra-thin glass. |
5 Indonesia Ultra-thin Glass Market Trends |
6 Indonesia Ultra-thin Glass Market, By Types |
6.1 Indonesia Ultra-thin Glass Market, By Manufacturing Process |
6.1.1 Overview and Analysis |
6.1.2 Indonesia Ultra-thin Glass Market Revenues & Volume, By Manufacturing Process, 2022-2032F |
6.1.3 Indonesia Ultra-thin Glass Market Revenues & Volume, By Float, 2022-2032F |
6.1.4 Indonesia Ultra-thin Glass Market Revenues & Volume, By Fusion, 2022-2032F |
6.1.5 Indonesia Ultra-thin Glass Market Revenues & Volume, By Down-Draw, 2022-2032F |
6.2 Indonesia Ultra-thin Glass Market, By Application |
6.2.1 Overview and Analysis |
6.2.2 Indonesia Ultra-thin Glass Market Revenues & Volume, By Semiconductor Substrate, 2022-2032F |
6.2.3 Indonesia Ultra-thin Glass Market Revenues & Volume, By Touch Panel Display, 2022-2032F |
6.2.4 Indonesia Ultra-thin Glass Market Revenues & Volume, By Fingerprint Sensor, 2022-2032F |
7 Indonesia Ultra-thin Glass Market Import-Export Trade Statistics |
7.1 Indonesia Ultra-thin Glass Market Export to Major Countries |
7.2 Indonesia Ultra-thin Glass Market Imports from Major Countries |
8 Indonesia Ultra-thin Glass Market Key Performance Indicators |
8.1 Average thickness of ultra-thin glass produced (indicative of technological advancements). |
8.2 Percentage of market penetration in key industries (reflecting demand and adoption). |
8.3 Research and development expenditure as a percentage of revenue (highlighting innovation and product development efforts). |
9 Indonesia Ultra-thin Glass Market - Opportunity Assessment |
9.1 Indonesia Ultra-thin Glass Market Opportunity Assessment, By Manufacturing Process, 2022 & 2032F |
9.2 Indonesia Ultra-thin Glass Market Opportunity Assessment, By Application, 2022 & 2032F |
10 Indonesia Ultra-thin Glass Market - Competitive Landscape |
10.1 Indonesia Ultra-thin Glass Market Revenue Share, By Companies, 2025 |
10.2 Indonesia Ultra-thin Glass Market Competitive Benchmarking, By Operating and Technical Parameters |
11 Company Profiles |
12 Recommendations |
13 Disclaimer |
Global Go To Market Strategy - 2030
Export potential enables firms to identify high-growth global markets with greater confidence by combining advanced trade intelligence with a structured quantitative methodology. The framework analyzes emerging demand trends and country-level import patterns while integrating macroeconomic and trade datasets such as GDP and population forecasts, bilateral import–export flows, tariff structures, elasticity differentials between developed and developing economies, geographic distance, and import demand projections. Using weighted trade values from 2020–2024 as the base period to project country-to-country export potential for 2030, these inputs are operationalized through calculated drivers such as gravity model parameters, tariff impact factors, and projected GDP per-capita growth. Through an analysis of hidden potentials, demand hotspots, and market conditions that are most favorable to success, this method enables firms to focus on target countries, maximize returns, and global expansion with data, backed by accuracy.
By factoring in the projected importer demand gap that is currently unmet and could be potential opportunity, it identifies the potential for the Exporter (Country) among 190 countries, against the general trade analysis, which identifies the biggest importer or exporter.
To discover high-growth global markets and optimize your business strategy:
Click Here
Pricing
- Single User License$ 1,995
- Department License$ 2,400
- Site License$ 3,120
- Global License$ 3,795

Leadership Perspectives from Industry Events
Search
Thought Leadership and Analyst Meet


Our Clients
6WResearch In News
- India Export Attractiveness Tracker 2026
- India Air Conditioner Market Set for Strong Rebound in 2026 After Weather-Led Correction and GST-Driven Recovery: 6Wresearch
- ADAS in India: How Automatic Emergency Braking, Blind Spot Detection & Driver Monitoring are Transforming Road Safety
- Doha a strategic location for EV manufacturing hub: IPA Qatar
- Demand for luxury TVs surging in the GCC, says Samsung
- Empowering Growth: The Thriving Journey of Bangladesh’s Cable Industry
Latest Reports
- Nicaragua RPG Gaming Market (2026-2032)
- New Zealand RPG Gaming Market (2026-2032)
- Netherlands RPG Gaming Market (2026-2032)
- Nauru RPG Gaming Market (2026-2032)
- Namibia RPG Gaming Market (2026-2032)
- Mozambique RPG Gaming Market (2026-2032)
- Montenegro RPG Gaming Market (2026-2032)
- Mongolia RPG Gaming Market (2026-2032)
- Monaco RPG Gaming Market (2026-2032)
- Micronesia RPG Gaming Market (2026-2032)
Industry Events and Analyst Meet

EV India Expo 2026

HIMTEX 2026

India Refining Summit 2026

India EV Show 2026

EV tech India Expo 2026
Whitepaper
- Middle East & Africa Commercial Security Market Click here to view more.
- Middle East & Africa Fire Safety Systems & Equipment Market Click here to view more.
- GCC Drone Market Click here to view more.
- Middle East Lighting Fixture Market Click here to view more.
- GCC Physical & Perimeter Security Market Click here to view more.