Ireland Quinones Market (2026-2032) | Companies, Revenue, Growth, Industry, Analysis, Segmentation, Forecast, Share, Size, Outlook, Value & Trends
Market Forecast By Type (Benzene Quinone, Naphthalene Quinone, Anthraquinone, Others), By Application (Pharmaceutical, Chemical Intermediates, Dye Intermediates, Others) And Competitive Landscape
| Product Code: ETC5312599 | Publication Date: Nov 2023 | Updated Date: Apr 2026 | Product Type: Market Research Report | |
| Publisher: 6Wresearch | Author: Ravi Bhandari | No. of Pages: 60 | No. of Figures: 30 | No. of Tables: 5 |
Ireland Quinones Market Size (2020-2030)
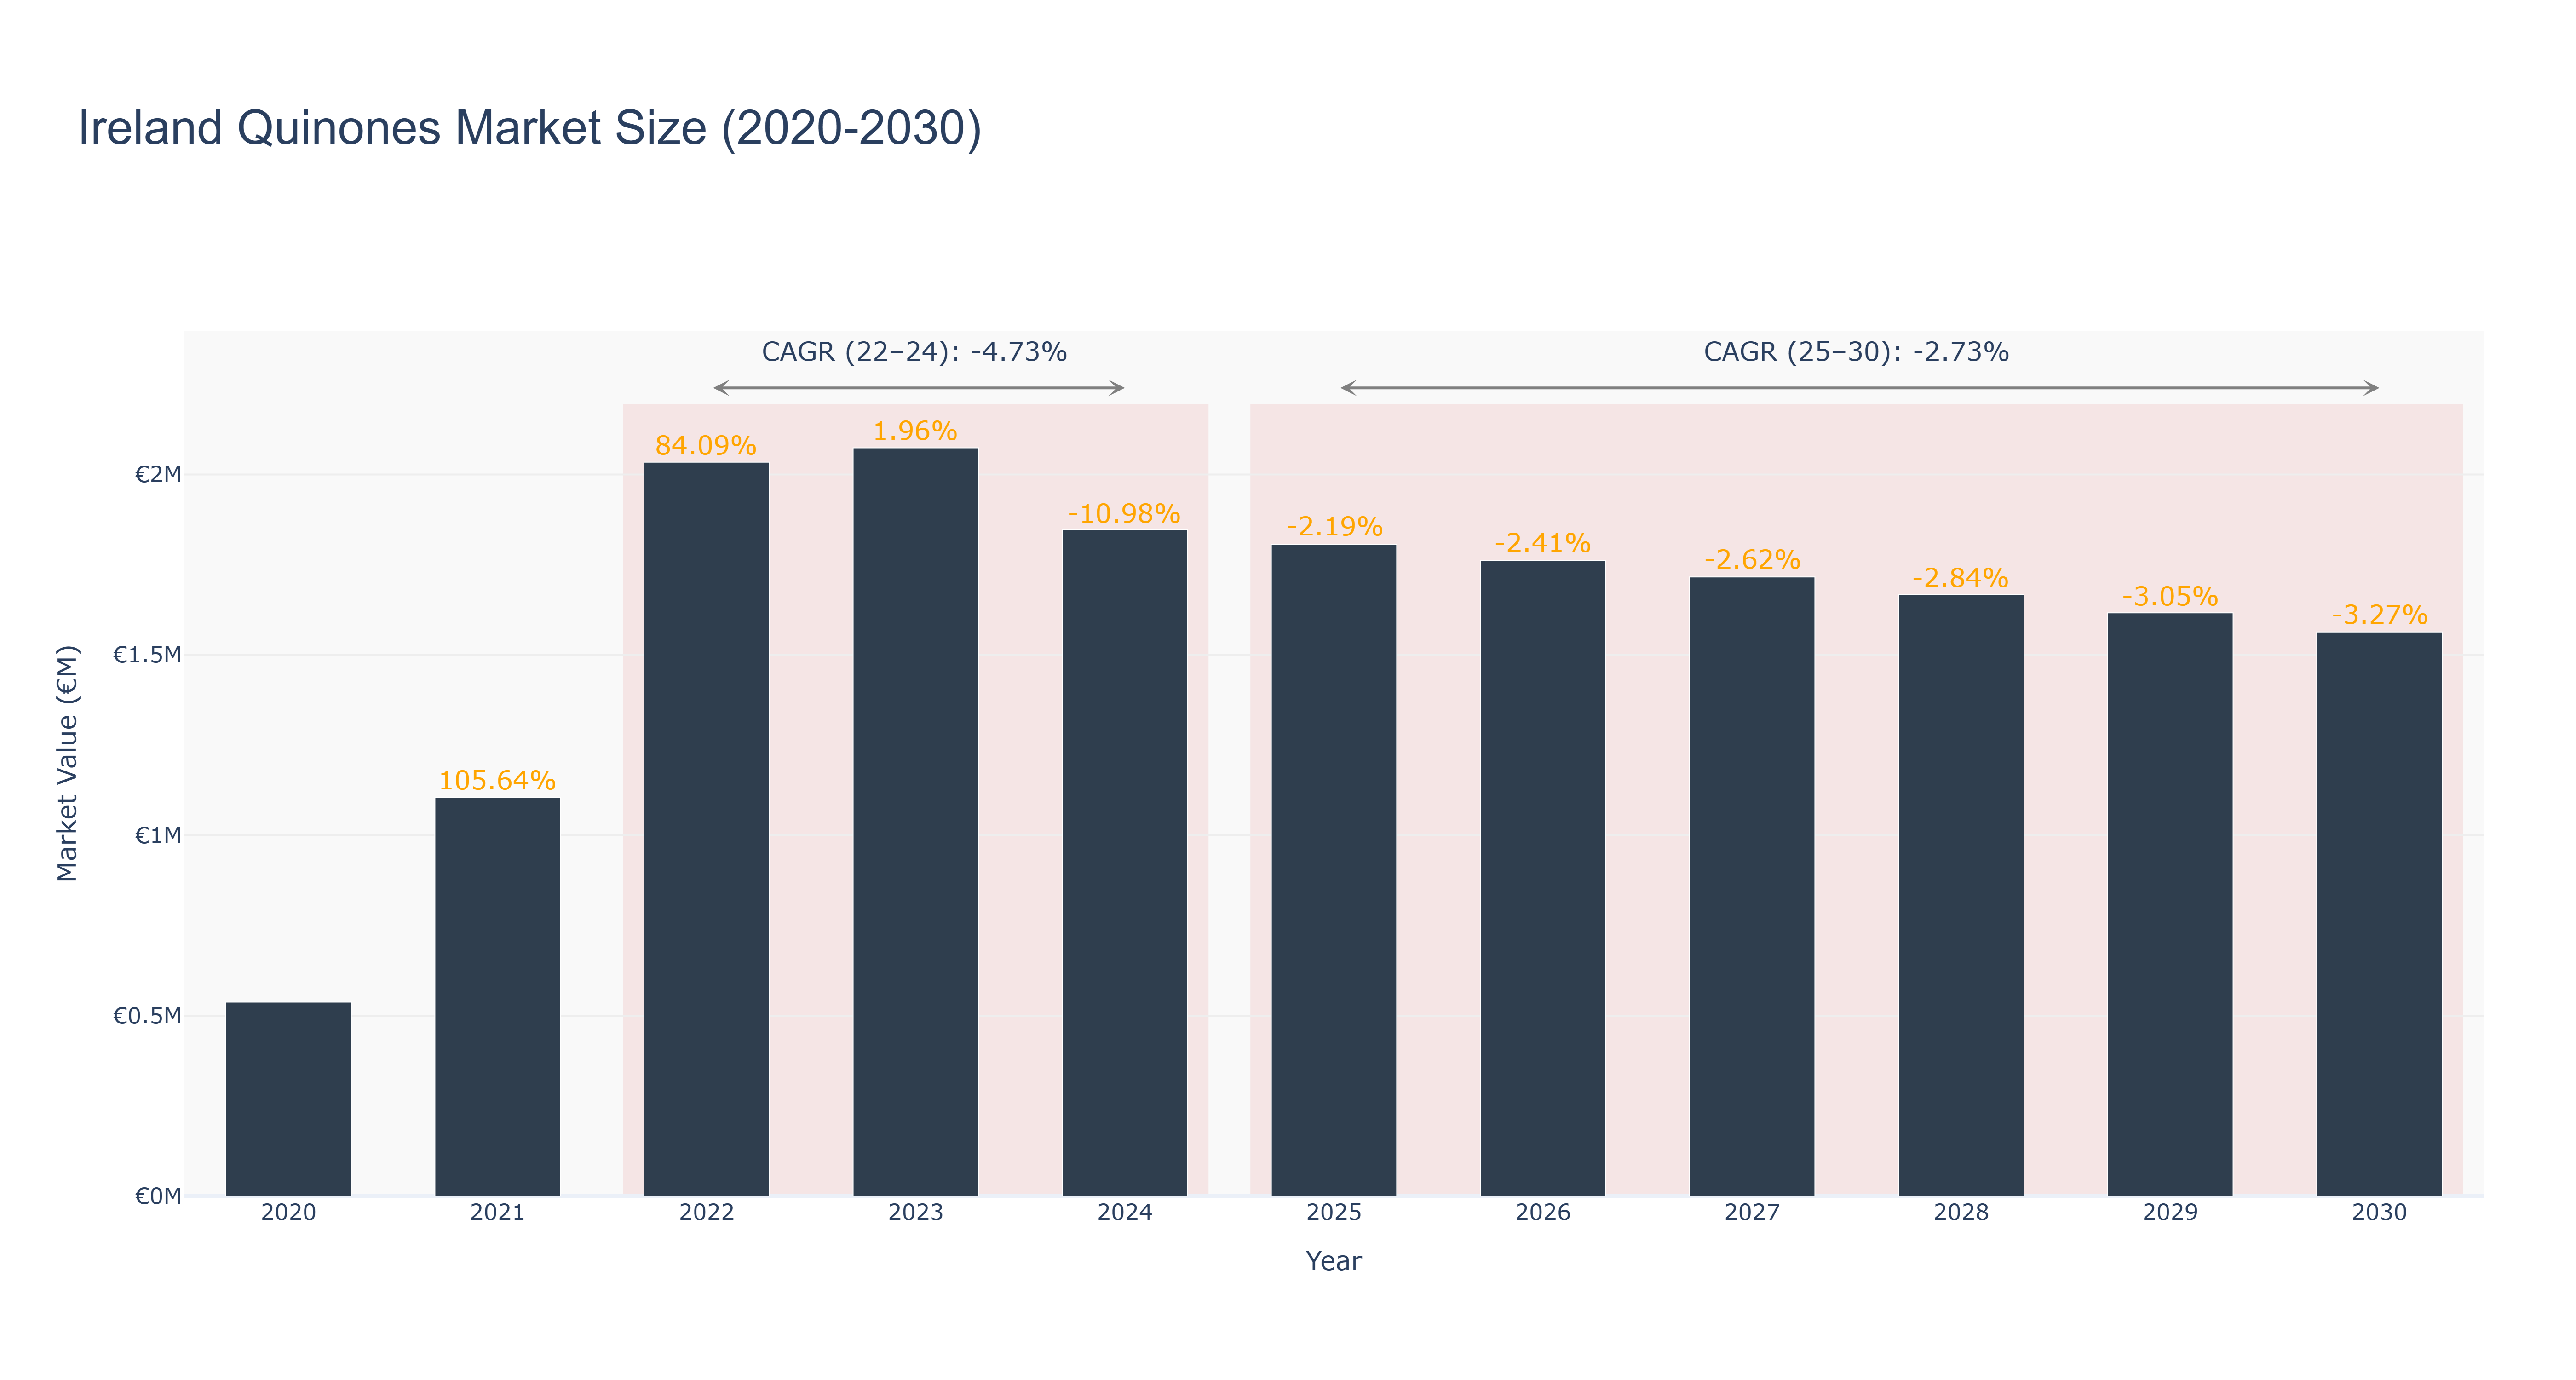
Ireland Quinones Market has seen fluctuations in market size over the years. The peak market size was €2.07 million in 2023, with a subsequent decline to €1.56 million in 2030. Actual market size decreased from €2.03 million in 2022 to €1.85 million in 2024, reflecting a negative CAGR of -4.73% during this period. The forecasted market size is expected to continue declining with a CAGR of -2.73% from 2025 to 2030. These fluctuations can be attributed to changing consumer preferences and economic conditions impacting market demand. Looking ahead, the market is anticipated to focus on sustainability initiatives and digital transformation projects to drive growth and adapt to evolving market dynamics.
Ireland Quinones Market: Production & Trade Performance (2019-2025)
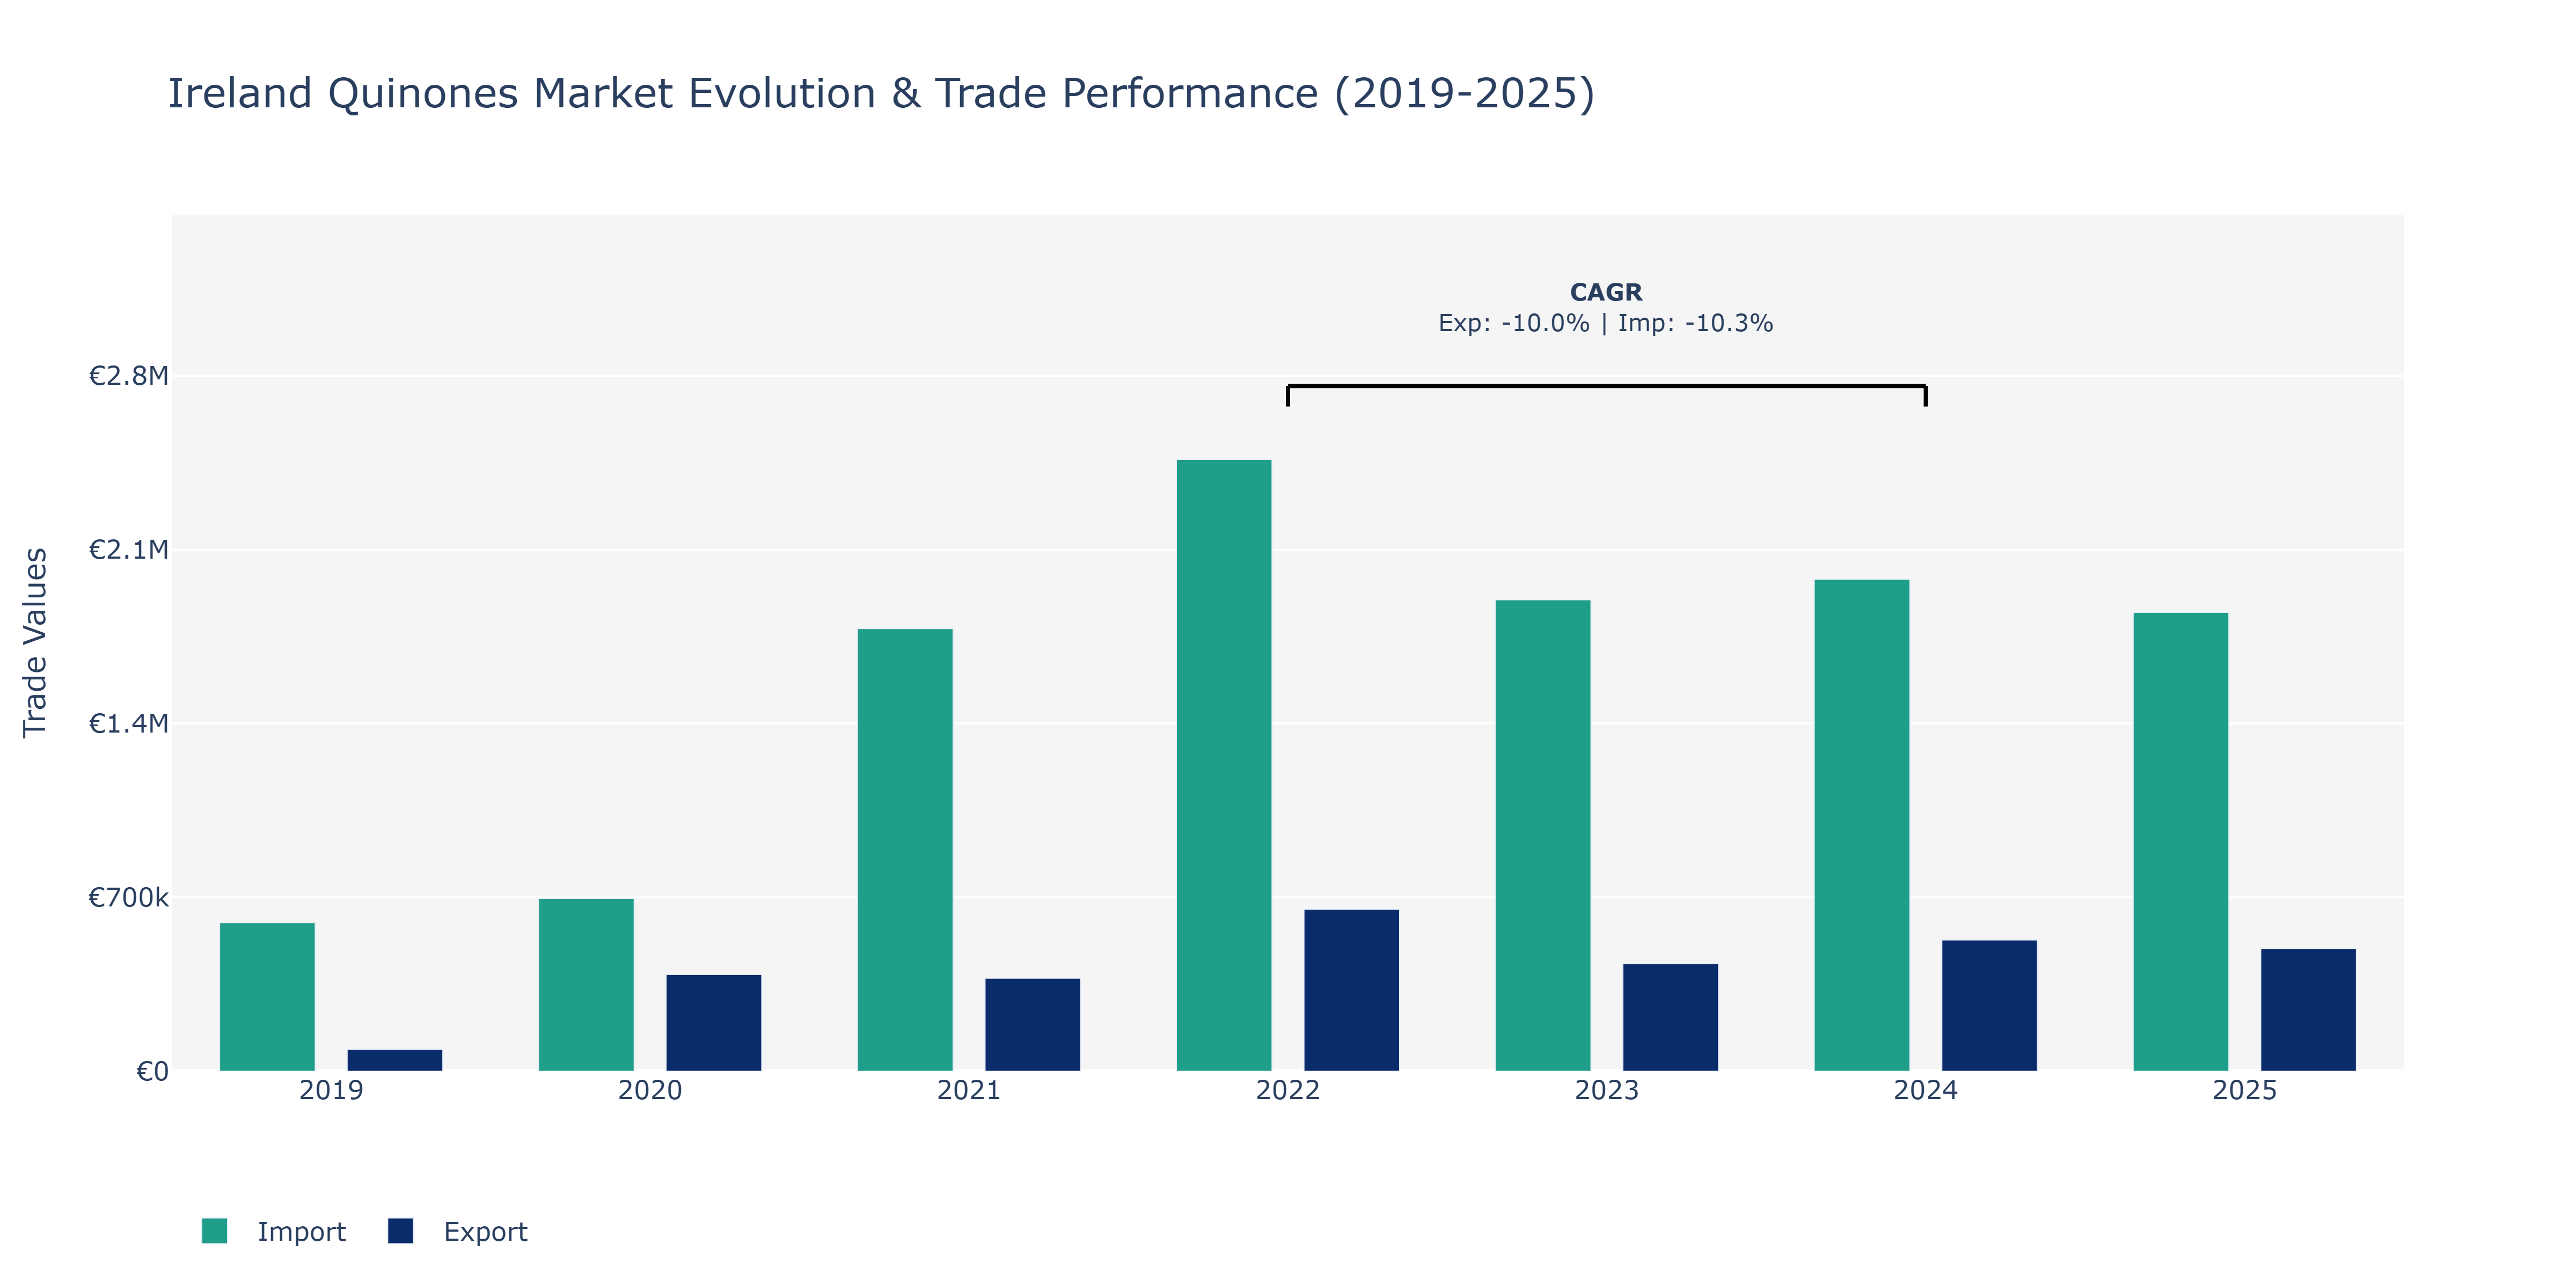
The Ireland Quinones Market experienced fluctuations in both Exports and Imports from 2019 to 2025. Export value started at €88.48 thousand in 2019, saw a substantial increase in 2020 to €389.24 thousand, before fluctuating around the €400-600 million range in the subsequent years, with a peak of €652.09 thousand in 2022. On the other hand, Imports began at a high of €597.94 thousand in 2019, increased in 2020 to €695.75 thousand, and surged significantly in 2021 to €1.78 million. However, Imports saw a decline to €1.89 million in 2022 before stabilizing around the €1.8 million mark in the following years. These fluctuations could be attributed to various factors such as changes in global demand, trade agreements, and currency exchange rates, impacting the exporting and importing activities of the Ireland Quinones Market. Real-world developments impacting this market could include shifts in consumer preferences, economic policies, and geopolitical events that may have influenced trade volumes during this period.
Key Highlights of the Report:
- Ireland Quinones Market Outlook
- Market Size of Ireland Quinones Market, 2025
- Forecast of Ireland Quinones Market, 2032
- Historical Data and Forecast of Ireland Quinones Revenues & Volume for the Period 2022 - 2032F
- Ireland Quinones Market Trend Evolution
- Ireland Quinones Market Drivers and Challenges
- Ireland Quinones Price Trends
- Ireland Quinones Porter`s Five Forces
- Ireland Quinones Industry Life Cycle
- Historical Data and Forecast of Ireland Quinones Market Revenues & Volume By Type for the Period 2022 - 2032F
- Historical Data and Forecast of Ireland Quinones Market Revenues & Volume By Benzene Quinone for the Period 2022 - 2032F
- Historical Data and Forecast of Ireland Quinones Market Revenues & Volume By Naphthalene Quinone for the Period 2022 - 2032F
- Historical Data and Forecast of Ireland Quinones Market Revenues & Volume By Anthraquinone for the Period 2022 - 2032F
- Historical Data and Forecast of Ireland Quinones Market Revenues & Volume By Others for the Period 2022 - 2032F
- Historical Data and Forecast of Ireland Quinones Market Revenues & Volume By Application for the Period 2022 - 2032F
- Historical Data and Forecast of Ireland Quinones Market Revenues & Volume By Pharmaceutical for the Period 2022 - 2032F
- Historical Data and Forecast of Ireland Quinones Market Revenues & Volume By Chemical Intermediates for the Period 2022 - 2032F
- Historical Data and Forecast of Ireland Quinones Market Revenues & Volume By Dye Intermediates for the Period 2022 - 2032F
- Historical Data and Forecast of Ireland Quinones Market Revenues & Volume By Others for the Period 2022 - 2032F
- Ireland Quinones Import Export Trade Statistics
- Market Opportunity Assessment By Type
- Market Opportunity Assessment By Application
- Ireland Quinones Top Companies Market Share
- Ireland Quinones Competitive Benchmarking By Technical and Operational Parameters
- Ireland Quinones Company Profiles
- Ireland Quinones Key Strategic Recommendations
Frequently Asked Questions About the Market Study (FAQs):
6Wresearch actively monitors the Ireland Quinones Market and publishes its comprehensive annual report, highlighting emerging trends, growth drivers, revenue analysis, and forecast outlook. Our insights help businesses to make data-backed strategic decisions with ongoing market dynamics. Our analysts track relevent industries related to the Ireland Quinones Market, allowing our clients with actionable intelligence and reliable forecasts tailored to emerging regional needs.
Yes, we provide customisation as per your requirements. To learn more, feel free to contact us on sales@6wresearch.com
1 Executive Summary |
2 Introduction |
2.1 Key Highlights of the Report |
2.2 Report Description |
2.3 Market Scope & Segmentation |
2.4 Research Methodology |
2.5 Assumptions |
3 Ireland Quinones Market Overview |
3.1 Ireland Country Macro Economic Indicators |
3.2 Ireland Quinones Market Revenues & Volume, 2022 & 2032F |
3.3 Ireland Quinones Market - Industry Life Cycle |
3.4 Ireland Quinones Market - Porter's Five Forces |
3.5 Ireland Quinones Market Revenues & Volume Share, By Type, 2022 & 2032F |
3.6 Ireland Quinones Market Revenues & Volume Share, By Application, 2022 & 2032F |
4 Ireland Quinones Market Dynamics |
4.1 Impact Analysis |
4.2 Market Drivers |
4.2.1 Increasing awareness about the health benefits of Ireland quinones |
4.2.2 Growing demand for natural and organic ingredients in the food and pharmaceutical industries |
4.2.3 Rising consumer preference for clean label products |
4.3 Market Restraints |
4.3.1 Limited availability of Ireland quinones due to geographical constraints |
4.3.2 Fluctuating prices of raw materials impacting production costs |
5 Ireland Quinones Market Trends |
6 Ireland Quinones Market Segmentations |
6.1 Ireland Quinones Market, By Type |
6.1.1 Overview and Analysis |
6.1.2 Ireland Quinones Market Revenues & Volume, By Benzene Quinone, 2022 - 2032F |
6.1.3 Ireland Quinones Market Revenues & Volume, By Naphthalene Quinone, 2022 - 2032F |
6.1.4 Ireland Quinones Market Revenues & Volume, By Anthraquinone, 2022 - 2032F |
6.1.5 Ireland Quinones Market Revenues & Volume, By Others, 2022 - 2032F |
6.2 Ireland Quinones Market, By Application |
6.2.1 Overview and Analysis |
6.2.2 Ireland Quinones Market Revenues & Volume, By Pharmaceutical, 2022 - 2032F |
6.2.3 Ireland Quinones Market Revenues & Volume, By Chemical Intermediates, 2022 - 2032F |
6.2.4 Ireland Quinones Market Revenues & Volume, By Dye Intermediates, 2022 - 2032F |
6.2.5 Ireland Quinones Market Revenues & Volume, By Others, 2022 - 2032F |
7 Ireland Quinones Market Import-Export Trade Statistics |
7.1 Ireland Quinones Market Export to Major Countries |
7.2 Ireland Quinones Market Imports from Major Countries |
8 Ireland Quinones Market Key Performance Indicators |
8.1 Consumer engagement on social media platforms for Ireland quinones-related content |
8.2 Number of research studies highlighting the benefits of Ireland quinones |
8.3 Percentage of new product launches containing Ireland quinones |
9 Ireland Quinones Market - Opportunity Assessment |
9.1 Ireland Quinones Market Opportunity Assessment, By Type, 2022 & 2032F |
9.2 Ireland Quinones Market Opportunity Assessment, By Application, 2022 & 2032F |
10 Ireland Quinones Market - Competitive Landscape |
10.1 Ireland Quinones Market Revenue Share, By Companies, 2025 |
10.2 Ireland Quinones Market Competitive Benchmarking, By Operating and Technical Parameters |
11 Company Profiles |
12 Recommendations | 13 Disclaimer |
Global Go To Market Strategy - 2030
Export potential enables firms to identify high-growth global markets with greater confidence by combining advanced trade intelligence with a structured quantitative methodology. The framework analyzes emerging demand trends and country-level import patterns while integrating macroeconomic and trade datasets such as GDP and population forecasts, bilateral import–export flows, tariff structures, elasticity differentials between developed and developing economies, geographic distance, and import demand projections. Using weighted trade values from 2020–2024 as the base period to project country-to-country export potential for 2030, these inputs are operationalized through calculated drivers such as gravity model parameters, tariff impact factors, and projected GDP per-capita growth. Through an analysis of hidden potentials, demand hotspots, and market conditions that are most favorable to success, this method enables firms to focus on target countries, maximize returns, and global expansion with data, backed by accuracy.
By factoring in the projected importer demand gap that is currently unmet and could be potential opportunity, it identifies the potential for the Exporter (Country) among 190 countries, against the general trade analysis, which identifies the biggest importer or exporter.
To discover high-growth global markets and optimize your business strategy:
Click Here
Pricing
- Single User License$ 1,995
- Department License$ 2,400
- Site License$ 3,120
- Global License$ 3,795

Leadership Perspectives from Industry Events
Search
Thought Leadership and Analyst Meet


Our Clients
6WResearch In News
- India Export Attractiveness Tracker 2026
- India Air Conditioner Market Set for Strong Rebound in 2026 After Weather-Led Correction and GST-Driven Recovery: 6Wresearch
- ADAS in India: How Automatic Emergency Braking, Blind Spot Detection & Driver Monitoring are Transforming Road Safety
- Doha a strategic location for EV manufacturing hub: IPA Qatar
- Demand for luxury TVs surging in the GCC, says Samsung
- Empowering Growth: The Thriving Journey of Bangladesh’s Cable Industry
Latest Reports
- Nicaragua RPG Gaming Market (2026-2032)
- New Zealand RPG Gaming Market (2026-2032)
- Netherlands RPG Gaming Market (2026-2032)
- Nauru RPG Gaming Market (2026-2032)
- Namibia RPG Gaming Market (2026-2032)
- Mozambique RPG Gaming Market (2026-2032)
- Montenegro RPG Gaming Market (2026-2032)
- Mongolia RPG Gaming Market (2026-2032)
- Monaco RPG Gaming Market (2026-2032)
- Micronesia RPG Gaming Market (2026-2032)
Industry Events and Analyst Meet

EV India Expo 2026

HIMTEX 2026

India Refining Summit 2026

India EV Show 2026

EV tech India Expo 2026
Whitepaper
- Middle East & Africa Commercial Security Market Click here to view more.
- Middle East & Africa Fire Safety Systems & Equipment Market Click here to view more.
- GCC Drone Market Click here to view more.
- Middle East Lighting Fixture Market Click here to view more.
- GCC Physical & Perimeter Security Market Click here to view more.