Italy Chemical Packaging Market (2026-2032) | Value, Forecast, Outlook, Analysis, Companies, Growth, Trends, Size, Share, Revenue, Industry
Market Forecast By Product Types (Sacks, Drums, FIBC, Other), By Applications (Pharmaceutical Factory, Laboratory, Chemical Plant, Others) And Competitive Landscape
| Product Code: ETC006873 | Publication Date: Sep 2020 | Updated Date: Jun 2026 | Product Type: Report | |
| Publisher: 6Wresearch | Author: Ravi Bhandari | No. of Pages: 70 | No. of Figures: 35 | No. of Tables: 5 |
Italy Chemical Packaging Market Summary
The italy chemical packaging market was estimated at USD 150 Million in 2025 and is projected to reach USD 165 Million by 2032, growing at a CAGR of 0.9% from 2026 to 2032.
Italy Chemical Packaging Market Growth Rate Analysis (2021-2032)
The Italian chemical packaging market experienced some turbulence over the last few years, highlighted by a decline of 4.0% in 2021, primarily due to pandemic-related disruptions. However, 2022 marked a notable recovery with an 8.5% growth, driven by increased consumer demand and significant investments in sustainable packaging solutions as industries pivoted towards environmentally friendly alternatives. The growth momentum continued into 2023 with a 4.8% increase, fueled by advancements in technology and robust policy support for the energy transition. While growth is expected to moderate in the following years, with rates stabilizing between 1.0% and 1.7% through 2028, the ongoing emphasis on digitalization and improved infrastructure positions the market for steady, albeit gradual, expansion.
Italy Chemical Packaging Market Year-wise Growth Rate and Key Drivers
This graph highlights how the Italy Chemical Packaging Market has steadily grown over the past five years, supported by major growth factors.
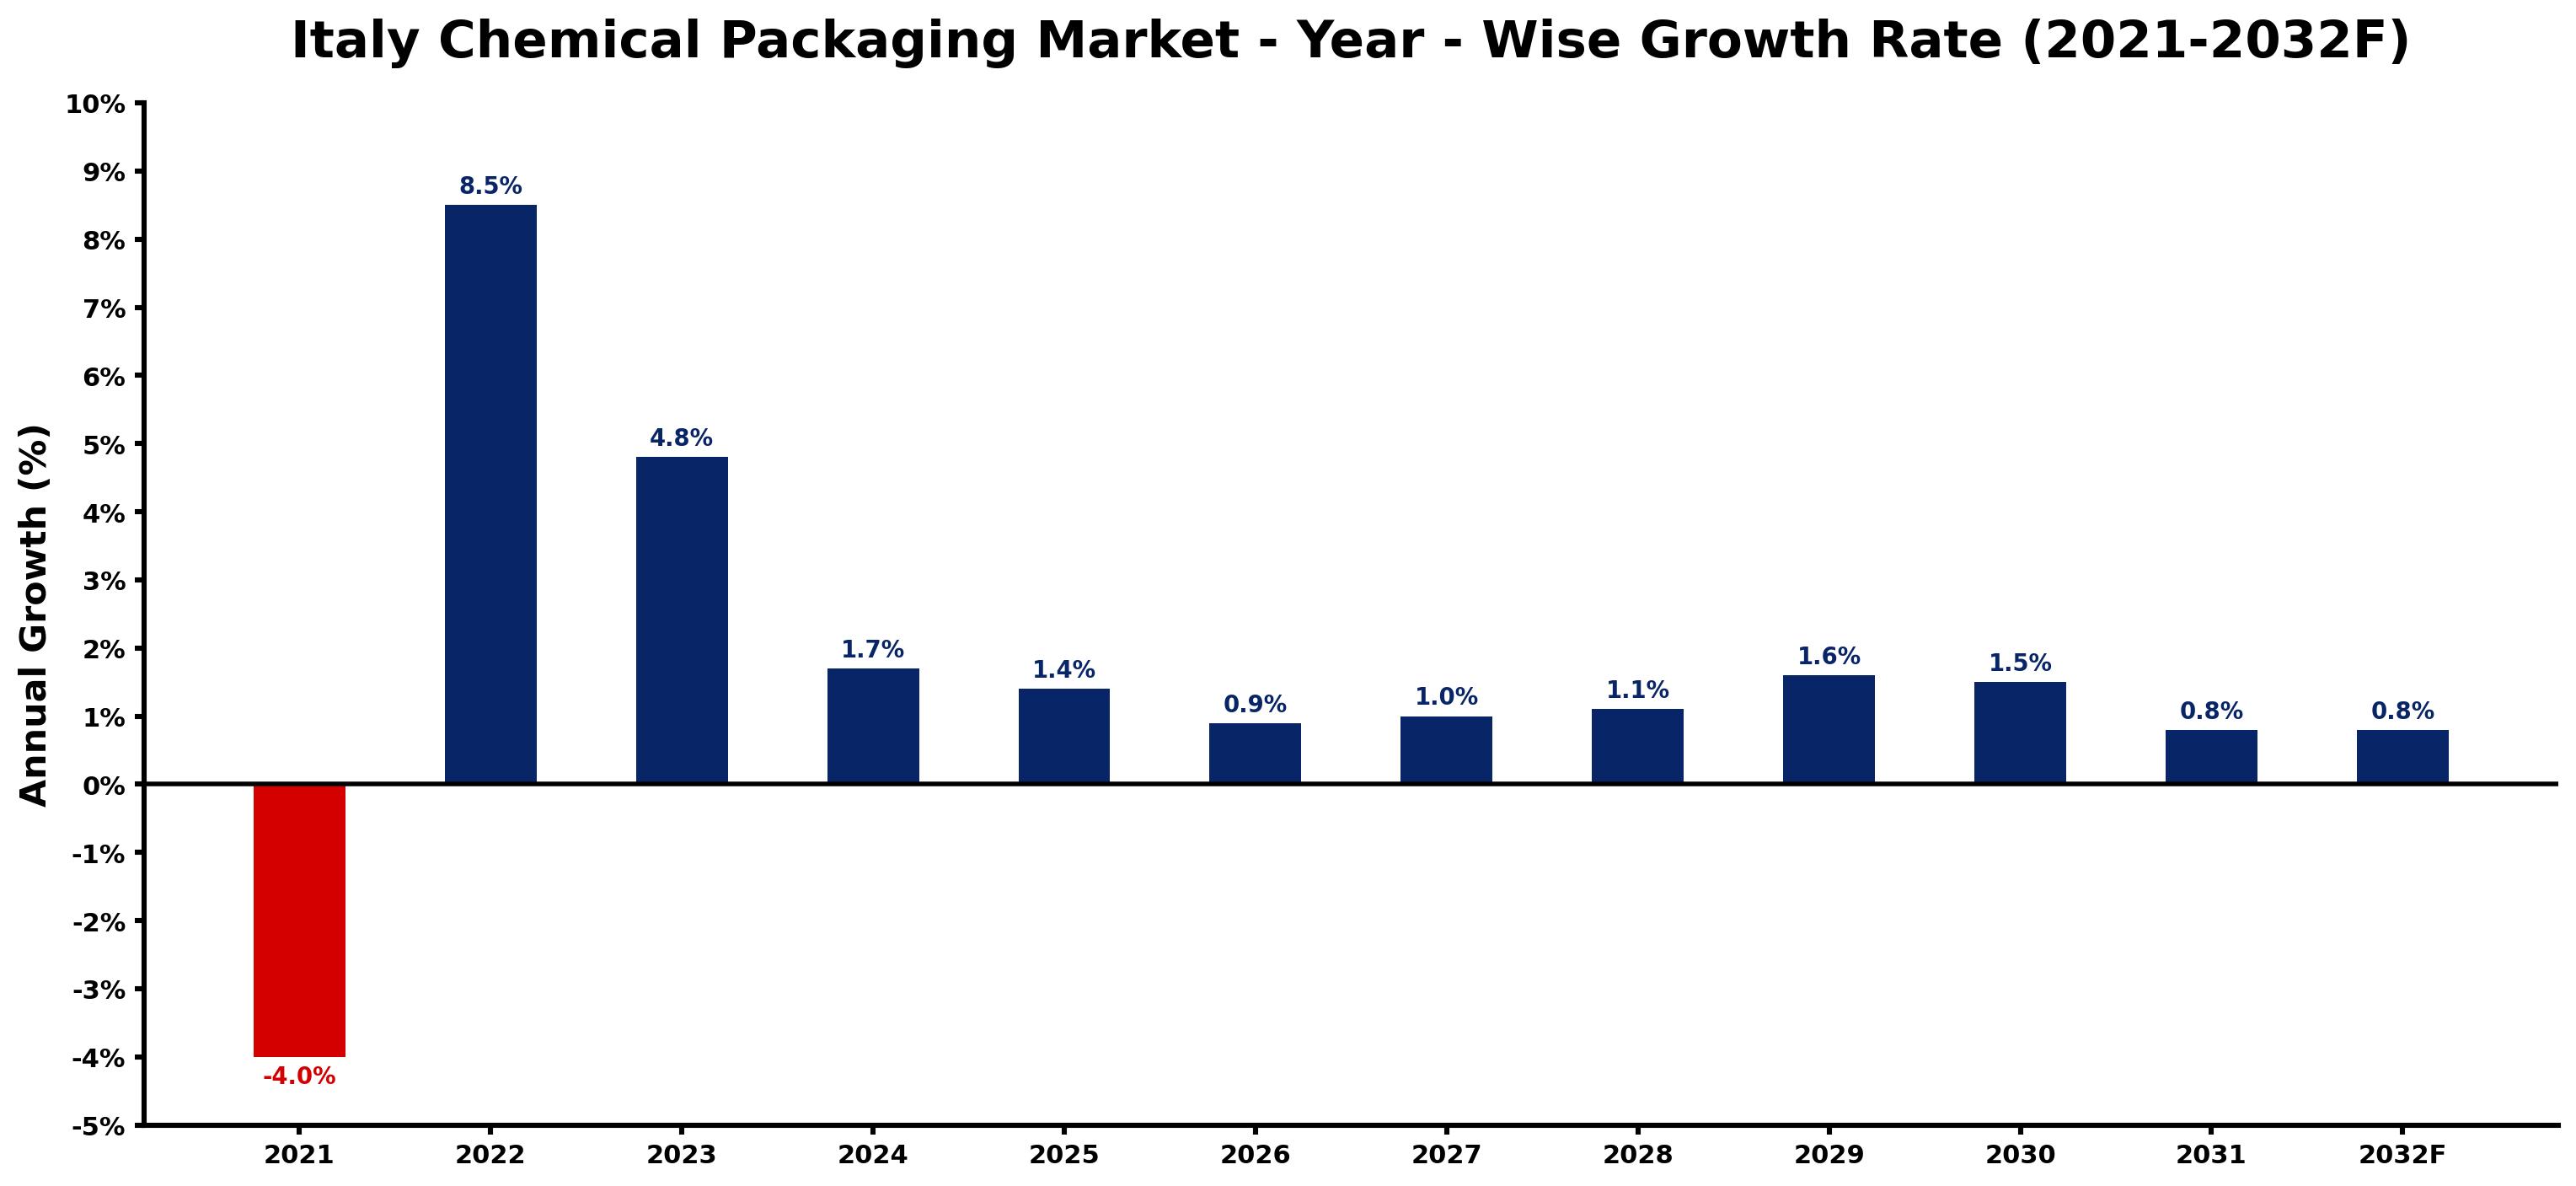
The table below presents the year wise growth rates along with the key drivers influencing the market
| Year | Growth Rate | Major Drivers |
| 2021 | -4.0% | Supply chain disruptions from the pandemic hindered product availability, negatively impacting sales in the chemical packaging sector. |
| 2022 | 8.5% | Innovation in biodegradable materials captured attention from both consumers and manufacturers alike. |
| 2023 | 4.8% | Supply chain adaptations prompted companies to reassess local sourcing strategies for packaging. |
| 2024 | 1.7% | Partnerships between chemical firms and tech companies led to smarter packaging designs. |
| 2025 | 1.4% | Increased focus on circular economy principles influenced producer material choices significantly. |
| 2026 | 0.9% | Investments in automation technology enhanced efficiency in packaging production processes. |
| 2027 | 1.0% | Consumer preferences shifted towards eco-friendly packaging alternatives, reshaping market dynamics. |
| 2028 | 1.1% | Competition among brands intensified, driving innovation in chemical packaging functionalities. |
| 2029 | 1.6% | E-commerce growth necessitated advanced packaging solutions tailored for shipping durability. |
| 2030 | 1.5% | Global sustainability targets spurred legislative changes impacting chemical packaging regulations. |
| 2031 | 0.8% | Emerging start-ups challenged traditional players, bringing fresh concepts to the market landscape. |
| 2032 | 0.8% | Collaboration between universities and industries fostered research-driven advancements in packaging technologies. |
Note - Market size estimations and growth projections presented in this report are based on 6Wresearch's advanced forecasting approach, validated with industry datasets as of June 2026.
Italy Chemical Packaging Market Synopsis
The Italy Chemical Packaging Market is projected to reach 0.9% and witness significant growth during the forecast period (2026-2032). This evolving market is characterized by a surge in innovation and diversification, primarily fueled by an increasing demand for safe, sustainable, and functional packaging solutions. Chemical packaging encompasses a broad array of materials, including plastics, paperboard, metals, and glass, all of which are specifically designed to protect and preserve chemical products throughout storage, transportation, and distribution processes.
Italy Chemical Packaging Market Growth Drivers
The dynamics of the Italy Chemical Packaging Market are significantly influenced by several key drivers:
- The imposition of stringent regulations on the handling, transportation, and storage of chemicals propels demand for compliant packaging solutions.
- Heightened consumer awareness around product safety and environmental sustainability is driving manufacturers to innovate and diversify their offerings.
- The increasing prominence of online retail channels necessitates tamper-evident and leak-proof packaging to ensure product integrity during transit.
- Investment in eco-friendly packaging materials is becoming essential as manufacturers adapt to emerging consumer preferences for sustainable products.
- Brand differentiation through innovative and appealing packaging designs further stimulates competition and investment in the sector.
Italy Chemical Packaging Market Challenges and Restraints
While the Italy Chemical Packaging Market exhibits robust growth potential, it is also beset by notable challenges:
- Comprehensive safety regulations demand rigorous compliance, requiring significant investment in technology and materials to meet statutory requirements.
- The shift towards sustainability poses challenges in harmonizing eco-friendly packaging initiatives with regulatory frameworks aimed at chemical safety.
- Compatibility issues between packaging materials and the chemicals they contain necessitate detailed testing protocols, which can be resource-intensive.
- Maintaining product integrity while pursuing environmentally conscious practices presents a complex balancing act for manufacturers.
- Adapting to the evolving regulatory landscapes requires substantial agility and foresight from companies operating in this competitive space.
Italy Chemical Packaging Market Trends and Opportunities
The Italy Chemical Packaging Market is witnessing several trends that are reshaping its landscape:
- There is a marked shift towards biodegradable and recyclable packaging materials, driven by consumer preferences for environmentally responsible options.
- Technological advancements, including smart packaging solutions that incorporate sensors and tracking capabilities, are gaining traction in the market.
- Collaboration between manufacturers and regulatory bodies is fostering innovation in sustainable packaging design and materials.
- As the trend toward circular economy practices grows, companies are increasingly exploring closed-loop systems for chemical packaging.
- Consumer demand for transparency in product sourcing and packaging materials is influencing marketing strategies within the industry.
Italy Chemical Packaging Market Government Investment and Initiatives
The Italian government plays a crucial role in shaping the landscape of the chemical packaging market through various regulations and initiatives:
- Regulatory bodies implement strict guidelines governing the design, labeling, and disposal of chemical packaging to ensure public safety and environmental protection.
- The Ministry of Environment collaborates with local and national entities to support sustainable practices and promote initiatives that reduce packaging waste.
- Investment in research and development for innovative packaging solutions is encouraged through public funding and grants targeting eco-friendly technologies.
- Partnerships with the National Packaging Consortium (CONAI) facilitate comprehensive waste management programs aimed at improving recycling rates.
- Public campaigns throughout Italy raise awareness about the importance of sustainability in packaging, linking consumer behavior to regulatory requirements.
Italy Chemical Packaging Market Latest Developments (May 2025 - June 2026)
During the period from May 2025 to June 2026, the Italy Chemical Packaging Market has seen a number of significant developments:
- Manufacturers have increasingly adopted advanced technologies to enhance the functionality and safety of packaging solutions.
- Research initiatives focused on developing biodegradable materials have gained momentum, aligning with global sustainability goals.
- Several industry events and conferences have promoted dialogue among stakeholders regarding best practices in chemical packaging.
- Collaborative efforts between industry players and government agencies have resulted in enhanced compliance frameworks for packaging safety.
- The emergence of new startups focused on innovative chemical packaging solutions has invigorated the market, fostering competition.
Italy Chemical Packaging Market - Key Attractiveness of the Report
- 10 Years of Market Numbers
- Historical Data Starting from 2022 to 2025
- Base Year: 2025
- Forecast Data until 2032
- Key Performance Indicators Impacting the Market
- Major Upcoming Developments and Projects
Key Highlights of the Report:
- Italy Chemical Packaging Market Outlook
- Market Size of Italy Chemical Packaging Market, 2025
- Forecast of Italy Chemical Packaging Market, 2032
- Historical Data and Forecast of Italy Chemical Packaging Revenues & Volume for the Period 2022-2032F
- Italy Chemical Packaging Market Trend Evolution
- Italy Chemical Packaging Market Drivers and Challenges
- Italy Chemical Packaging Price Trends
- Italy Chemical Packaging Porter's Five Forces
- Italy Chemical Packaging Industry Life Cycle
- Historical Data and Forecast of Italy Chemical Packaging Market Revenues & Volume By Product Types for the Period 2022-2032F
- Historical Data and Forecast of Italy Chemical Packaging Market Revenues & Volume By Sacks for the Period 2022-2032F
- Historical Data and Forecast of Italy Chemical Packaging Market Revenues & Volume By Drums for the Period 2022-2032F
- Historical Data and Forecast of Italy Chemical Packaging Market Revenues & Volume By FIBC for the Period 2022-2032F
- Historical Data and Forecast of Italy Chemical Packaging Market Revenues & Volume By Other for the Period 2022-2032F
- Historical Data and Forecast of Italy Chemical Packaging Market Revenues & Volume By Applications for the Period 2022-2032F
- Historical Data and Forecast of Italy Chemical Packaging Market Revenues & Volume By Pharmaceutical Factory? for the Period 2022-2032F
- Historical Data and Forecast of Italy Chemical Packaging Market Revenues & Volume By Laboratory for the Period 2022-2032F
- Historical Data and Forecast of Italy Chemical Packaging Market Revenues & Volume By Chemical Plant? for the Period 2022-2032F
- Historical Data and Forecast of Italy Chemical Packaging Market Revenues & Volume By Others for the Period 2022-2032F
- Italy Chemical Packaging Import Export Trade Statistics
- Market Opportunity Assessment By Product Types
- Market Opportunity Assessment By Applications
- Italy Chemical Packaging Top Companies Market Share
- Italy Chemical Packaging Competitive Benchmarking By Technical and Operational Parameters
- Italy Chemical Packaging Company Profiles
- Italy Chemical Packaging Key Strategic Recommendations
Frequently Asked Questions About the Market Study (FAQs):
The Italy Chemical Packaging Market utilizes a variety of materials including plastics, paperboard, metals, and glass, each selected for its protective and preservative qualities.
Stringent regulations govern the packaging of chemicals to ensure safety and environmental compliance, pushing manufacturers to innovate continually.
Key trends include a shift towards sustainable materials, advancements in smart packaging technologies, and increased consumer demand for transparency.
The Italian government enforces regulations, promotes sustainable practices, and supports research initiatives related to chemical packaging and waste management.
6Wresearch actively monitors the Italy Chemical Packaging Market and publishes its comprehensive annual report, highlighting emerging trends, growth drivers, revenue analysis, and forecast outlook. Our insights help businesses to make data-backed strategic decisions with ongoing market dynamics. Our analysts track relevent industries related to the Italy Chemical Packaging Market, allowing our clients with actionable intelligence and reliable forecasts tailored to emerging regional needs.
Yes, we provide customisation as per your requirements. To learn more, feel free to contact us on sales@6wresearch.com
1 Executive Summary |
2 Introduction |
2.1 Key Highlights of the Report |
2.2 Report Description |
2.3 Market Scope & Segmentation |
2.4 Research Methodology |
2.5 Assumptions |
3 Italy Chemical Packaging Market Overview |
3.1 Italy Country Macro Economic Indicators |
3.2 Italy Chemical Packaging Market Revenues & Volume, 2022 & 2032F |
3.3 Italy Chemical Packaging Market - Industry Life Cycle |
3.4 Italy Chemical Packaging Market - Porter's Five Forces |
3.5 Italy Chemical Packaging Market Revenues & Volume Share, By Product Types, 2022 & 2032F |
3.6 Italy Chemical Packaging Market Revenues & Volume Share, By Applications, 2022 & 2032F |
4 Italy Chemical Packaging Market Dynamics |
4.1 Impact Analysis |
4.2 Market Drivers |
4.2.1 Increasing demand for eco-friendly and sustainable packaging solutions in the chemical industry |
4.2.2 Growing emphasis on product safety and quality standards in packaging |
4.2.3 Rise in chemical manufacturing activities and exports in Italy |
4.3 Market Restraints |
4.3.1 Stringent regulations and compliance requirements related to chemical packaging |
4.3.2 Fluctuating raw material prices impacting packaging costs |
4.3.3 Intense competition among packaging providers in the chemical sector |
5 Italy Chemical Packaging Market Trends |
6 Italy Chemical Packaging Market, By Types |
6.1 Italy Chemical Packaging Market, By Product Types |
6.1.1 Overview and Analysis |
6.1.2 Italy Chemical Packaging Market Revenues & Volume, By Product Types, 2022-2032F |
6.1.3 Italy Chemical Packaging Market Revenues & Volume, By Sacks, 2022-2032F |
6.1.4 Italy Chemical Packaging Market Revenues & Volume, By Drums, 2022-2032F |
6.1.5 Italy Chemical Packaging Market Revenues & Volume, By FIBC, 2022-2032F |
6.1.6 Italy Chemical Packaging Market Revenues & Volume, By Other, 2022-2032F |
6.2 Italy Chemical Packaging Market, By Applications |
6.2.1 Overview and Analysis |
6.2.2 Italy Chemical Packaging Market Revenues & Volume, By Pharmaceutical Factory , 2022-2032F |
6.2.3 Italy Chemical Packaging Market Revenues & Volume, By Laboratory, 2022-2032F |
6.2.4 Italy Chemical Packaging Market Revenues & Volume, By Chemical Plant , 2022-2032F |
6.2.5 Italy Chemical Packaging Market Revenues & Volume, By Others, 2022-2032F |
7 Italy Chemical Packaging Market Import-Export Trade Statistics |
7.1 Italy Chemical Packaging Market Export to Major Countries |
7.2 Italy Chemical Packaging Market Imports from Major Countries |
8 Italy Chemical Packaging Market Key Performance Indicators |
8.1 Percentage of eco-friendly packaging materials used in the chemical industry |
8.2 Number of certifications obtained for product safety and quality standards compliance |
8.3 Growth rate of chemical manufacturing sector in Italy |
8.4 Investment in research and development for innovative packaging solutions |
8.5 Customer satisfaction levels with chemical packaging solutions |
9 Italy Chemical Packaging Market - Opportunity Assessment |
9.1 Italy Chemical Packaging Market Opportunity Assessment, By Product Types, 2022 & 2032F |
9.2 Italy Chemical Packaging Market Opportunity Assessment, By Applications, 2022 & 2032F |
10 Italy Chemical Packaging Market - Competitive Landscape |
10.1 Italy Chemical Packaging Market Revenue Share, By Companies, 2025 |
10.2 Italy Chemical Packaging Market Competitive Benchmarking, By Operating and Technical Parameters |
11 Company Profiles |
12 Recommendations |
13 Disclaimer |
Global Go To Market Strategy - 2030
Export potential enables firms to identify high-growth global markets with greater confidence by combining advanced trade intelligence with a structured quantitative methodology. The framework analyzes emerging demand trends and country-level import patterns while integrating macroeconomic and trade datasets such as GDP and population forecasts, bilateral import–export flows, tariff structures, elasticity differentials between developed and developing economies, geographic distance, and import demand projections. Using weighted trade values from 2020–2024 as the base period to project country-to-country export potential for 2030, these inputs are operationalized through calculated drivers such as gravity model parameters, tariff impact factors, and projected GDP per-capita growth. Through an analysis of hidden potentials, demand hotspots, and market conditions that are most favorable to success, this method enables firms to focus on target countries, maximize returns, and global expansion with data, backed by accuracy.
By factoring in the projected importer demand gap that is currently unmet and could be potential opportunity, it identifies the potential for the Exporter (Country) among 190 countries, against the general trade analysis, which identifies the biggest importer or exporter.
To discover high-growth global markets and optimize your business strategy:
Click Here
Pricing
- Single User License$ 1,995
- Department License$ 2,400
- Site License$ 3,120
- Global License$ 3,795

Leadership Perspectives from Industry Events
Search
Thought Leadership and Analyst Meet


Our Clients
6WResearch In News
- India Air Conditioner Market Set for Strong Rebound in 2026 After Weather-Led Correction and GST-Driven Recovery: 6Wresearch
- ADAS in India: How Automatic Emergency Braking, Blind Spot Detection & Driver Monitoring are Transforming Road Safety
- Doha a strategic location for EV manufacturing hub: IPA Qatar
- Demand for luxury TVs surging in the GCC, says Samsung
- Empowering Growth: The Thriving Journey of Bangladesh’s Cable Industry
- Demand for luxury TVs surging in the GCC, says Samsung
Latest Reports
- Nicaragua RPG Gaming Market (2026-2032)
- New Zealand RPG Gaming Market (2026-2032)
- Netherlands RPG Gaming Market (2026-2032)
- Nauru RPG Gaming Market (2026-2032)
- Namibia RPG Gaming Market (2026-2032)
- Mozambique RPG Gaming Market (2026-2032)
- Montenegro RPG Gaming Market (2026-2032)
- Mongolia RPG Gaming Market (2026-2032)
- Monaco RPG Gaming Market (2026-2032)
- Micronesia RPG Gaming Market (2026-2032)
Industry Events and Analyst Meet

HIMTEX 2026

India Refining Summit 2026

India EV Show 2026

EV tech India Expo 2026

Auto Tech Asia 2026
Whitepaper
- Middle East & Africa Commercial Security Market Click here to view more.
- Middle East & Africa Fire Safety Systems & Equipment Market Click here to view more.
- GCC Drone Market Click here to view more.
- Middle East Lighting Fixture Market Click here to view more.
- GCC Physical & Perimeter Security Market Click here to view more.