Japan Ceramics Market (2020-2026) | COVID-19 IMPACT, Share, Industry, Size, Revenue, Growth, Outlook, Analysis, Companies, Value, Trends & Forecast
Market Forecast By Product Types (Traditional, Advanced), By Applications (Sanitary Ware, Abrasives, Bricks and Pipes, Tiles, Pottery, Others), By End-users (Building & Construction, Industrial, Medical, Others) And Competitive Landscape
| Product Code: ETC009282 | Publication Date: Jun 2023 | Updated Date: Oct 2025 | Product Type: Report | |
| Publisher: 6Wresearch | Author: Ravi Bhandari | No. of Pages: 70 | No. of Figures: 35 | No. of Tables: 5 |
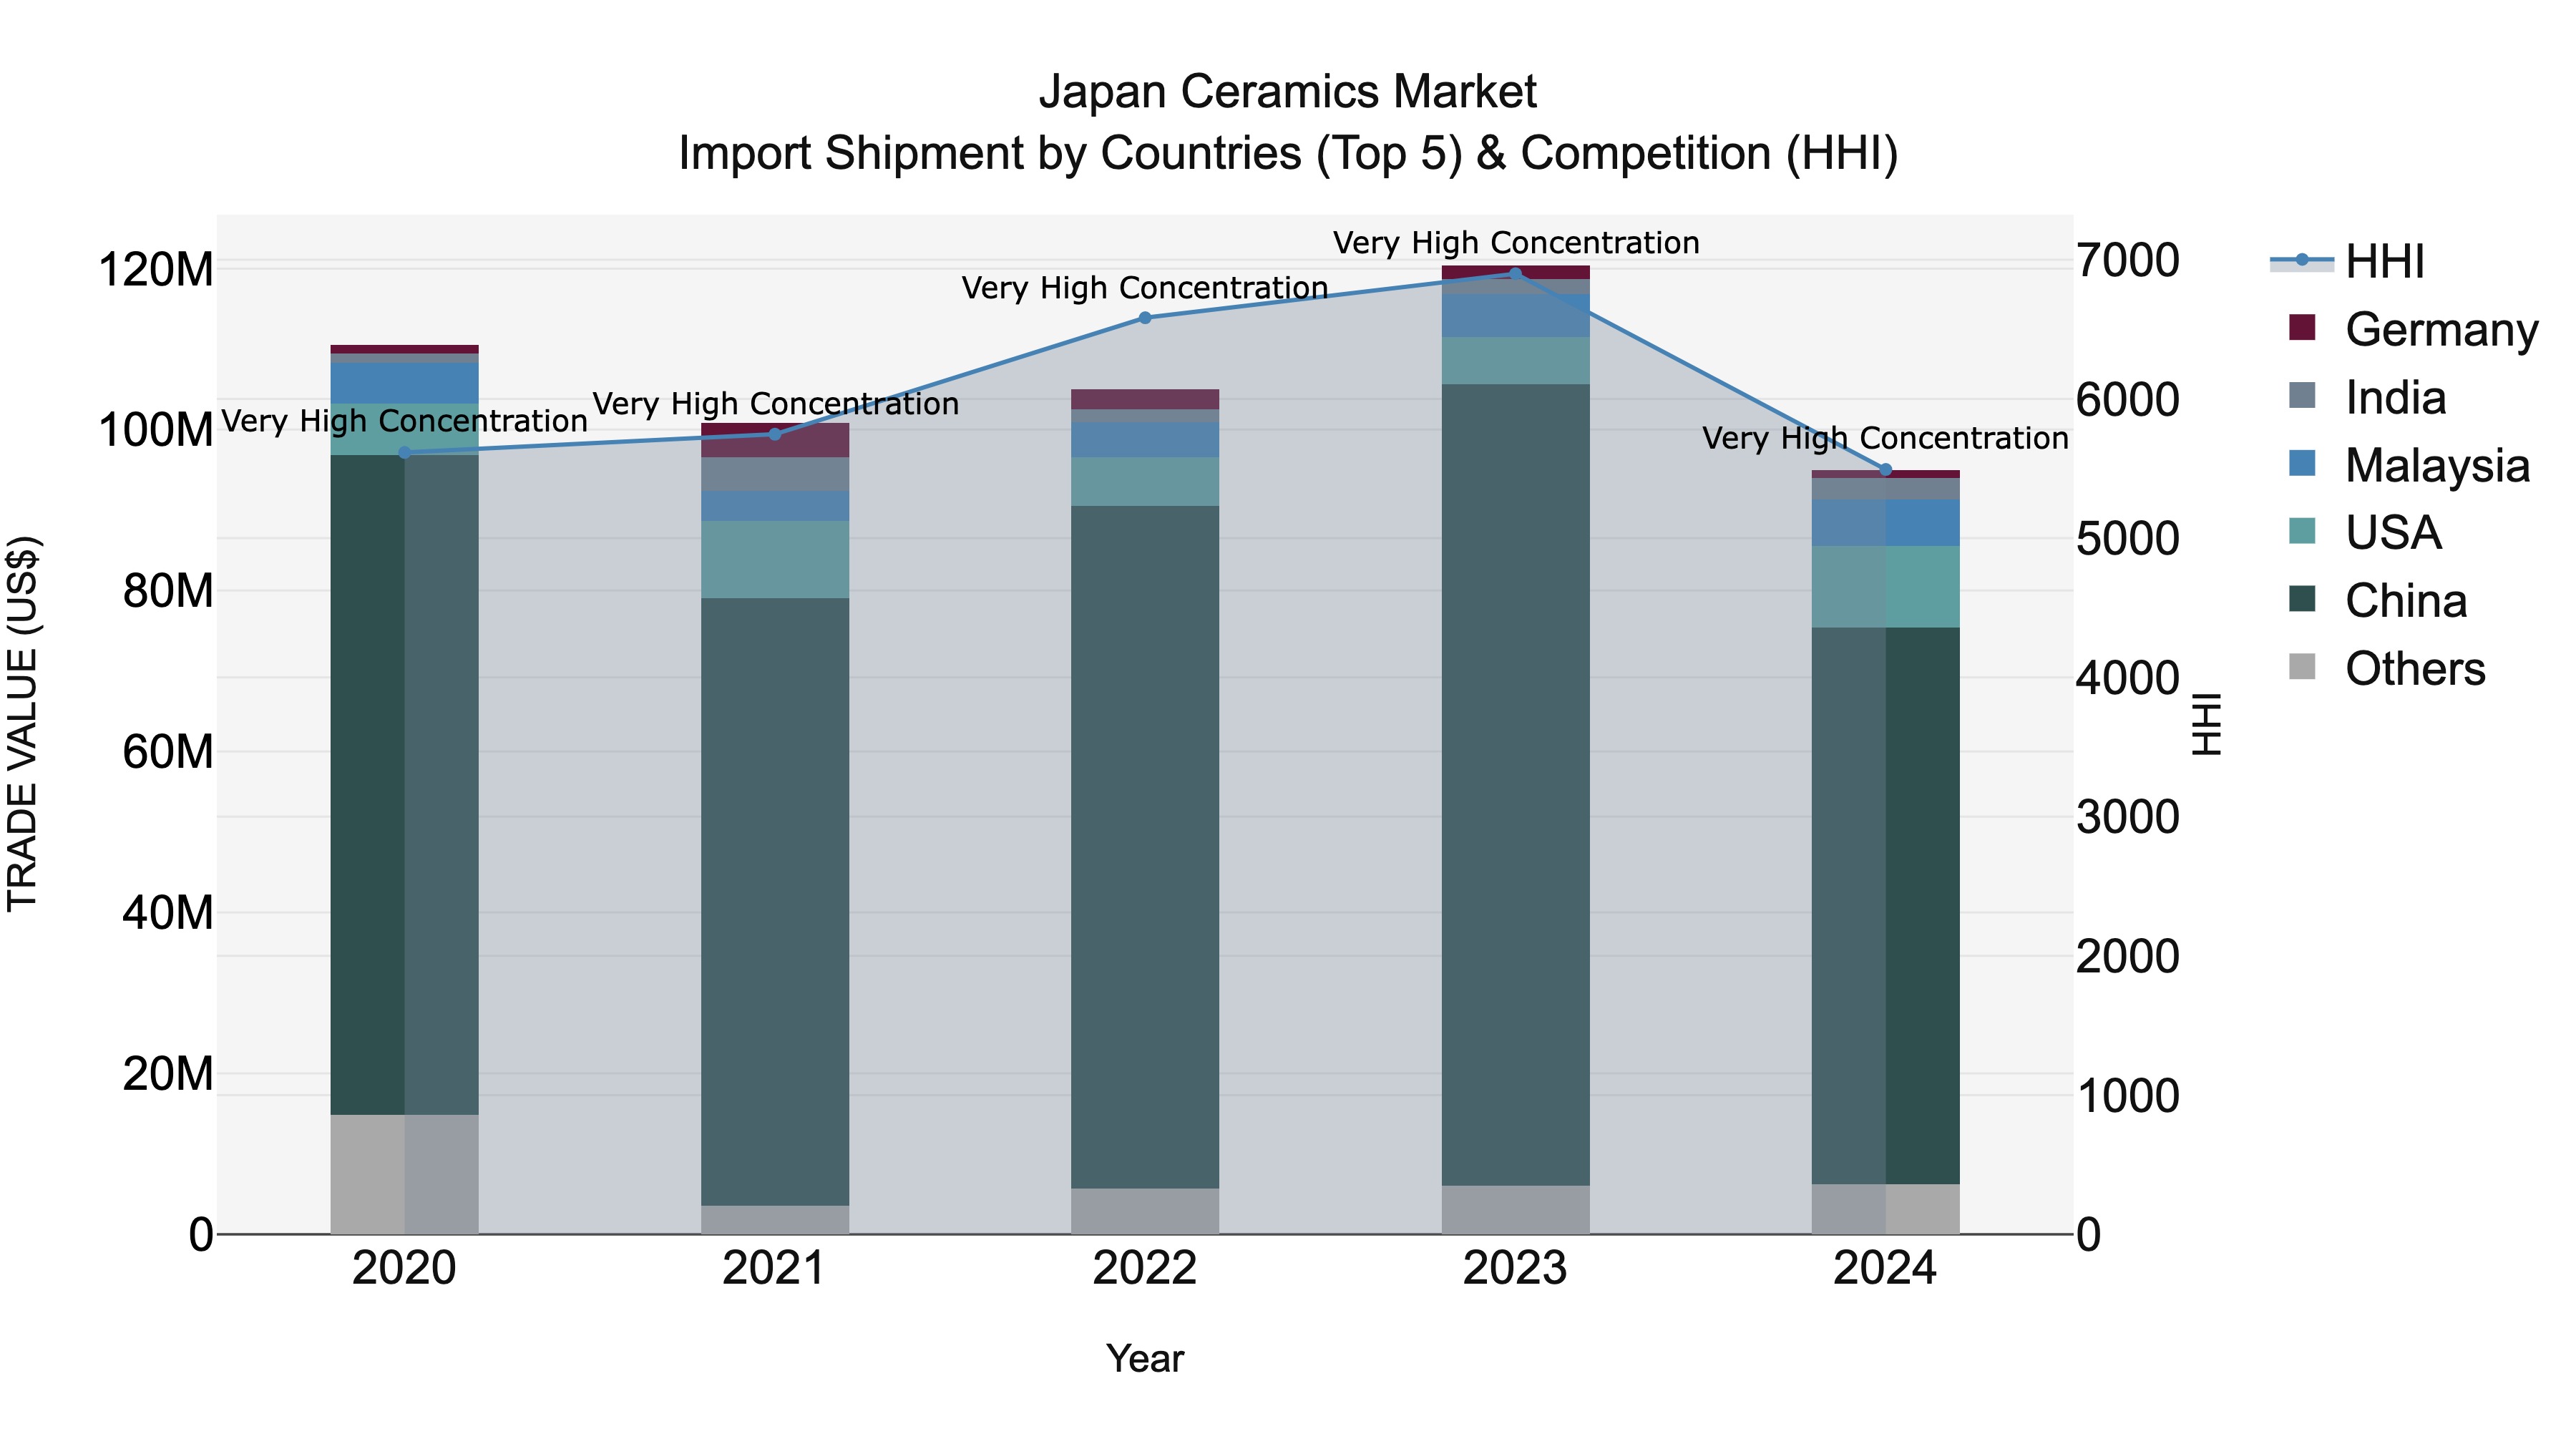
Japan Ceramics Market Import Shipment by Countries (Top 5) & Competition (HHI)
Japan's ceramics import market in 2024 continued to be dominated by top exporting countries such as China, USA, Malaysia, Spain, and India. The High Herfindahl-Hirschman Index (HHI) indicates a persistent high concentration in the market. Despite a negative Compound Annual Growth Rate (CAGR) of -3.74% from 2020 to 2024, the growth rate further declined by -21.13% from 2023 to 2024. This trend suggests a challenging environment for ceramics importers in Japan, highlighting the need for strategic adjustments and market diversification strategies in the coming years.
japan ceramics market Synopsis
The Japan ceramics market is expected to grow at a CAGR of 4.2% during the forecast period (2020-2026). Technological advancements in ceramic products and growing demand from various industries such as automotive, electronics, and medical are some of the major factors driving the growth of this market. Furthermore, increasing use of advanced materials for production to enhance product features has also supported the growth of this market. Additionally, rising acceptance of sanitary ware among residential users is further helping expand the scope for its application in construction activities.
However, availability of cheaper substitutes such as glass may pose a challenge to manufacturers operating in this field. In terms of region, East Asia dominates with majority share due to huge demand from China which accounts for nearly one third global consumption capacity followed by Japan and South Korea respectively. Moreover government initiatives towards promoting investment in infrastructure development will provide ample opportunities to industry players operating across different countries throughout the forecast period 2020-2026.
Key Highlights of the Report:
- Japan Ceramics Market Outlook
- Market Size of Japan Ceramics Market, 2019
- Forecast of Japan Ceramics Market, 2026
- Historical Data and Forecast of Japan Ceramics Revenues & Volume for the Period 2016 - 2026
- Japan Ceramics Market Trend Evolution
- Japan Ceramics Market Drivers and Challenges
- Japan Ceramics Price Trends
- Japan Ceramics Porter's Five Forces
- Japan Ceramics Industry Life Cycle
- Historical Data and Forecast of Japan Ceramics Market Revenues & Volume By Product Types for the Period 2016 - 2026
- Historical Data and Forecast of Japan Ceramics Market Revenues & Volume By Traditional for the Period 2016 - 2026
- Historical Data and Forecast of Japan Ceramics Market Revenues & Volume By Advanced for the Period 2016 - 2026
- Historical Data and Forecast of Japan Ceramics Market Revenues & Volume By Applications for the Period 2016 - 2026
- Historical Data and Forecast of Japan Ceramics Market Revenues & Volume By Sanitary Ware for the Period 2016 - 2026
- Historical Data and Forecast of Japan Ceramics Market Revenues & Volume By Abrasives for the Period 2016 - 2026
- Historical Data and Forecast of Japan Ceramics Market Revenues & Volume By Bricks and Pipes for the Period 2016 - 2026
- Historical Data and Forecast of Japan Ceramics Market Revenues & Volume By Tiles for the Period 2016 - 2026
- Historical Data and Forecast of Japan Ceramics Market Revenues & Volume By Pottery for the Period 2016 - 2026
- Historical Data and Forecast of Japan Ceramics Market Revenues & Volume By Others for the Period 2016 - 2026
- Historical Data and Forecast of Japan Ceramics Market Revenues & Volume By End-users for the Period 2016 - 2026
- Historical Data and Forecast of Japan Ceramics Market Revenues & Volume By Building & Construction for the Period 2016 - 2026
- Historical Data and Forecast of Japan Ceramics Market Revenues & Volume By Industrial for the Period 2016 - 2026
- Historical Data and Forecast of Japan Ceramics Market Revenues & Volume By Medical for the Period 2016 - 2026
- Historical Data and Forecast of Japan Ceramics Market Revenues & Volume By Others for the Period 2016 - 2026
- Japan Ceramics Import Export Trade Statistics
- Market Opportunity Assessment By Product Types
- Market Opportunity Assessment By Applications
- Market Opportunity Assessment By End-users
- Japan Ceramics Top Companies Market Share
- Japan Ceramics Competitive Benchmarking By Technical and Operational Parameters
- Japan Ceramics Company Profiles
- Japan Ceramics Key Strategic Recommendations
Frequently Asked Questions About the Market Study (FAQs):
6Wresearch actively monitors the Japan Ceramics Market and publishes its comprehensive annual report, highlighting emerging trends, growth drivers, revenue analysis, and forecast outlook. Our insights help businesses to make data-backed strategic decisions with ongoing market dynamics. Our analysts track relevent industries related to the Japan Ceramics Market, allowing our clients with actionable intelligence and reliable forecasts tailored to emerging regional needs.
Yes, we provide customisation as per your requirements. To learn more, feel free to contact us on sales@6wresearch.com
1 Executive Summary |
2 Introduction |
2.1 Key Highlights of the Report |
2.2 Report Description |
2.3 Market Scope & Segmentation |
2.4 Research Methodology |
2.5 Assumptions |
3 Japan Ceramics Market Overview |
3.1 Japan Country Macro Economic Indicators |
3.2 Japan Ceramics Market Revenues & Volume, 2019 & 2026F |
3.3 Japan Ceramics Market - Industry Life Cycle |
3.4 Japan Ceramics Market - Porter's Five Forces |
3.5 Japan Ceramics Market Revenues & Volume Share, By Product Types, 2019 & 2026F |
3.6 Japan Ceramics Market Revenues & Volume Share, By Applications, 2019 & 2026F |
3.7 Japan Ceramics Market Revenues & Volume Share, By End-users, 2019 & 2026F |
4 Japan Ceramics Market Dynamics |
4.1 Impact Analysis |
4.2 Market Drivers |
4.2.1 Growing demand for aesthetically pleasing and durable ceramics products in interior design and architecture |
4.2.2 Increasing popularity of Japanese ceramics in international markets |
4.2.3 Technological advancements leading to innovative product designs and improved manufacturing processes |
4.3 Market Restraints |
4.3.1 Fluctuations in raw material prices impacting production costs |
4.3.2 Intense competition from other materials such as glass, plastic, and metal in various applications |
5 Japan Ceramics Market Trends |
6 Japan Ceramics Market, By Types |
6.1 Japan Ceramics Market, By Product Types |
6.1.1 Overview and Analysis |
6.1.2 Japan Ceramics Market Revenues & Volume, By Product Types, 2016 - 2026F |
6.1.3 Japan Ceramics Market Revenues & Volume, By Traditional, 2016 - 2026F |
6.1.4 Japan Ceramics Market Revenues & Volume, By Advanced, 2016 - 2026F |
6.2 Japan Ceramics Market, By Applications |
6.2.1 Overview and Analysis |
6.2.2 Japan Ceramics Market Revenues & Volume, By Sanitary Ware, 2016 - 2026F |
6.2.3 Japan Ceramics Market Revenues & Volume, By Abrasives, 2016 - 2026F |
6.2.4 Japan Ceramics Market Revenues & Volume, By Bricks and Pipes, 2016 - 2026F |
6.2.5 Japan Ceramics Market Revenues & Volume, By Tiles, 2016 - 2026F |
6.2.6 Japan Ceramics Market Revenues & Volume, By Pottery, 2016 - 2026F |
6.2.7 Japan Ceramics Market Revenues & Volume, By Others, 2016 - 2026F |
6.3 Japan Ceramics Market, By End-users |
6.3.1 Overview and Analysis |
6.3.2 Japan Ceramics Market Revenues & Volume, By Building & Construction, 2016 - 2026F |
6.3.3 Japan Ceramics Market Revenues & Volume, By Industrial, 2016 - 2026F |
6.3.4 Japan Ceramics Market Revenues & Volume, By Medical, 2016 - 2026F |
6.3.5 Japan Ceramics Market Revenues & Volume, By Others, 2016 - 2026F |
7 Japan Ceramics Market Import-Export Trade Statistics |
7.1 Japan Ceramics Market Export to Major Countries |
7.2 Japan Ceramics Market Imports from Major Countries |
8 Japan Ceramics Market Key Performance Indicators |
8.1 Percentage of revenue from exports to key international markets |
8.2 Number of patents filed for ceramic manufacturing processes or product designs |
8.3 Percentage of revenue allocated to research and development for new ceramic products |
8.4 Customer satisfaction scores related to product quality and design |
8.5 Percentage of repeat customers within a specific time period |
9 Japan Ceramics Market - Opportunity Assessment |
9.1 Japan Ceramics Market Opportunity Assessment, By Product Types, 2019 & 2026F |
9.2 Japan Ceramics Market Opportunity Assessment, By Applications, 2019 & 2026F |
9.3 Japan Ceramics Market Opportunity Assessment, By End-users, 2019 & 2026F |
10 Japan Ceramics Market - Competitive Landscape |
10.1 Japan Ceramics Market Revenue Share, By Companies, 2019 |
10.2 Japan Ceramics Market Competitive Benchmarking, By Operating and Technical Parameters |
11 Company Profiles |
12 Recommendations |
13 Disclaimer |
Global Go To Market Strategy - 2030
Export potential enables firms to identify high-growth global markets with greater confidence by combining advanced trade intelligence with a structured quantitative methodology. The framework analyzes emerging demand trends and country-level import patterns while integrating macroeconomic and trade datasets such as GDP and population forecasts, bilateral import–export flows, tariff structures, elasticity differentials between developed and developing economies, geographic distance, and import demand projections. Using weighted trade values from 2020–2024 as the base period to project country-to-country export potential for 2030, these inputs are operationalized through calculated drivers such as gravity model parameters, tariff impact factors, and projected GDP per-capita growth. Through an analysis of hidden potentials, demand hotspots, and market conditions that are most favorable to success, this method enables firms to focus on target countries, maximize returns, and global expansion with data, backed by accuracy.
By factoring in the projected importer demand gap that is currently unmet and could be potential opportunity, it identifies the potential for the Exporter (Country) among 190 countries, against the general trade analysis, which identifies the biggest importer or exporter.
To discover high-growth global markets and optimize your business strategy:
Click Here
Pricing
- Single User License$ 1,995
- Department License$ 2,400
- Site License$ 3,120
- Global License$ 3,795

Leadership Perspectives from Industry Events
Search
Thought Leadership and Analyst Meet


Our Clients
6WResearch In News
- India Export Attractiveness Tracker 2026
- India Air Conditioner Market Set for Strong Rebound in 2026 After Weather-Led Correction and GST-Driven Recovery: 6Wresearch
- ADAS in India: How Automatic Emergency Braking, Blind Spot Detection & Driver Monitoring are Transforming Road Safety
- Doha a strategic location for EV manufacturing hub: IPA Qatar
- Demand for luxury TVs surging in the GCC, says Samsung
- Empowering Growth: The Thriving Journey of Bangladesh’s Cable Industry
Latest Reports
- Nicaragua RPG Gaming Market (2026-2032)
- New Zealand RPG Gaming Market (2026-2032)
- Netherlands RPG Gaming Market (2026-2032)
- Nauru RPG Gaming Market (2026-2032)
- Namibia RPG Gaming Market (2026-2032)
- Mozambique RPG Gaming Market (2026-2032)
- Montenegro RPG Gaming Market (2026-2032)
- Mongolia RPG Gaming Market (2026-2032)
- Monaco RPG Gaming Market (2026-2032)
- Micronesia RPG Gaming Market (2026-2032)
Industry Events and Analyst Meet

EV India Expo 2026

HIMTEX 2026

India Refining Summit 2026

India EV Show 2026

EV tech India Expo 2026
Whitepaper
- Middle East & Africa Commercial Security Market Click here to view more.
- Middle East & Africa Fire Safety Systems & Equipment Market Click here to view more.
- GCC Drone Market Click here to view more.
- Middle East Lighting Fixture Market Click here to view more.
- GCC Physical & Perimeter Security Market Click here to view more.