Japan Children Entertainment Centers Market Size & Growth Rate
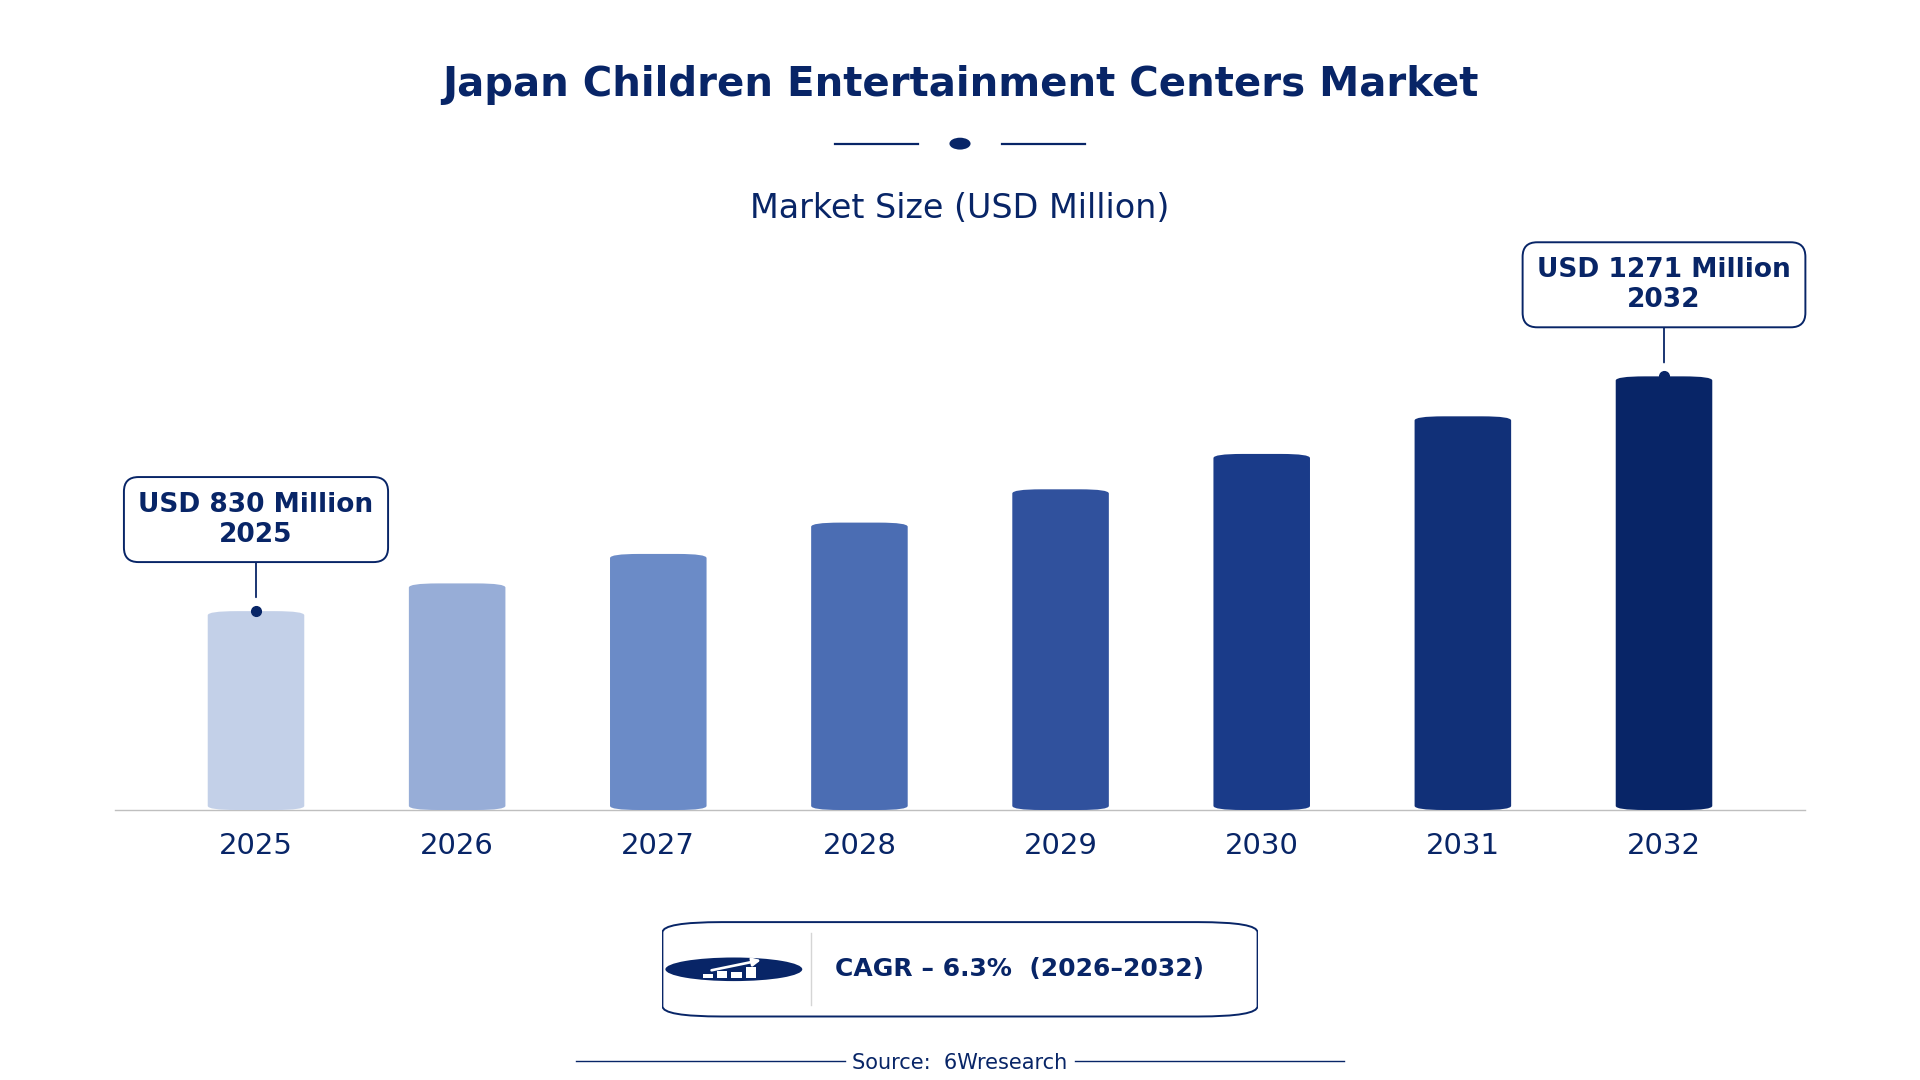
According to 6Wresearch internal database and industry insights, the Japan Children Entertainment Centers Market was valued at USD 830 Million in 2025 and is projected to reach USD 1,271 Million by 2032, growing at a CAGR of approximately 6.3% during 2026–2032.
Japan Children Entertainment Centers Market Highlights
| Report Metric | Details |
| Report Name | Japan Children Entertainment Centers Market (2026-2032) |
| Market Size 2025 | USD 830 Million |
| Market Size 2032 | USD 1,271 Million |
| Absolute Growth 2025–2032 | USD 441 Million |
| CAGR 2026–2032 | 6.3% |
| Peak Annual Growth | 7.2% in 2028 |
| Forecast Period | 2026–2032 |
| Historical Data | 2022–2025 |
| Base Year | 2025 |
| Leading Visitor Demographics, 2025 | Families with Children (0-8) (39% share) |
| Leading Facility Size, 2025 | 1 to 10 acres (15% share) |
| Leading Revenue Source, 2025 | Entry Fees & Ticket Sales (46% share) |
| Leading Activity Area, 2025 | Arcade Studios (51% share) |
| Fastest-Growing Visitor Demographics | Families with Children (9-12) (8.2% CAGR) |
| Fastest-Growing Facility Size | 11 to 30 acres (8.6% CAGR) |
| Fastest-Growing Revenue Source | Food & Beverages (9.0% CAGR) |
| Fastest-Growing Activity Area | Skill/Competition Games (7.8% CAGR) |
| Growing Sector | Family Entertainment |
| Key End Users | Families with Children (0-8), Families with Children (9-12), Food Service Providers |
Japan Children Entertainment Centers Market Year-wise Growth Rate and Key Drivers (2022–2032)
This graph illustrates the annual growth rates of the market from 2022 to 2032, highlighting a steady upward trajectory and projected market expansion over the forecast period.
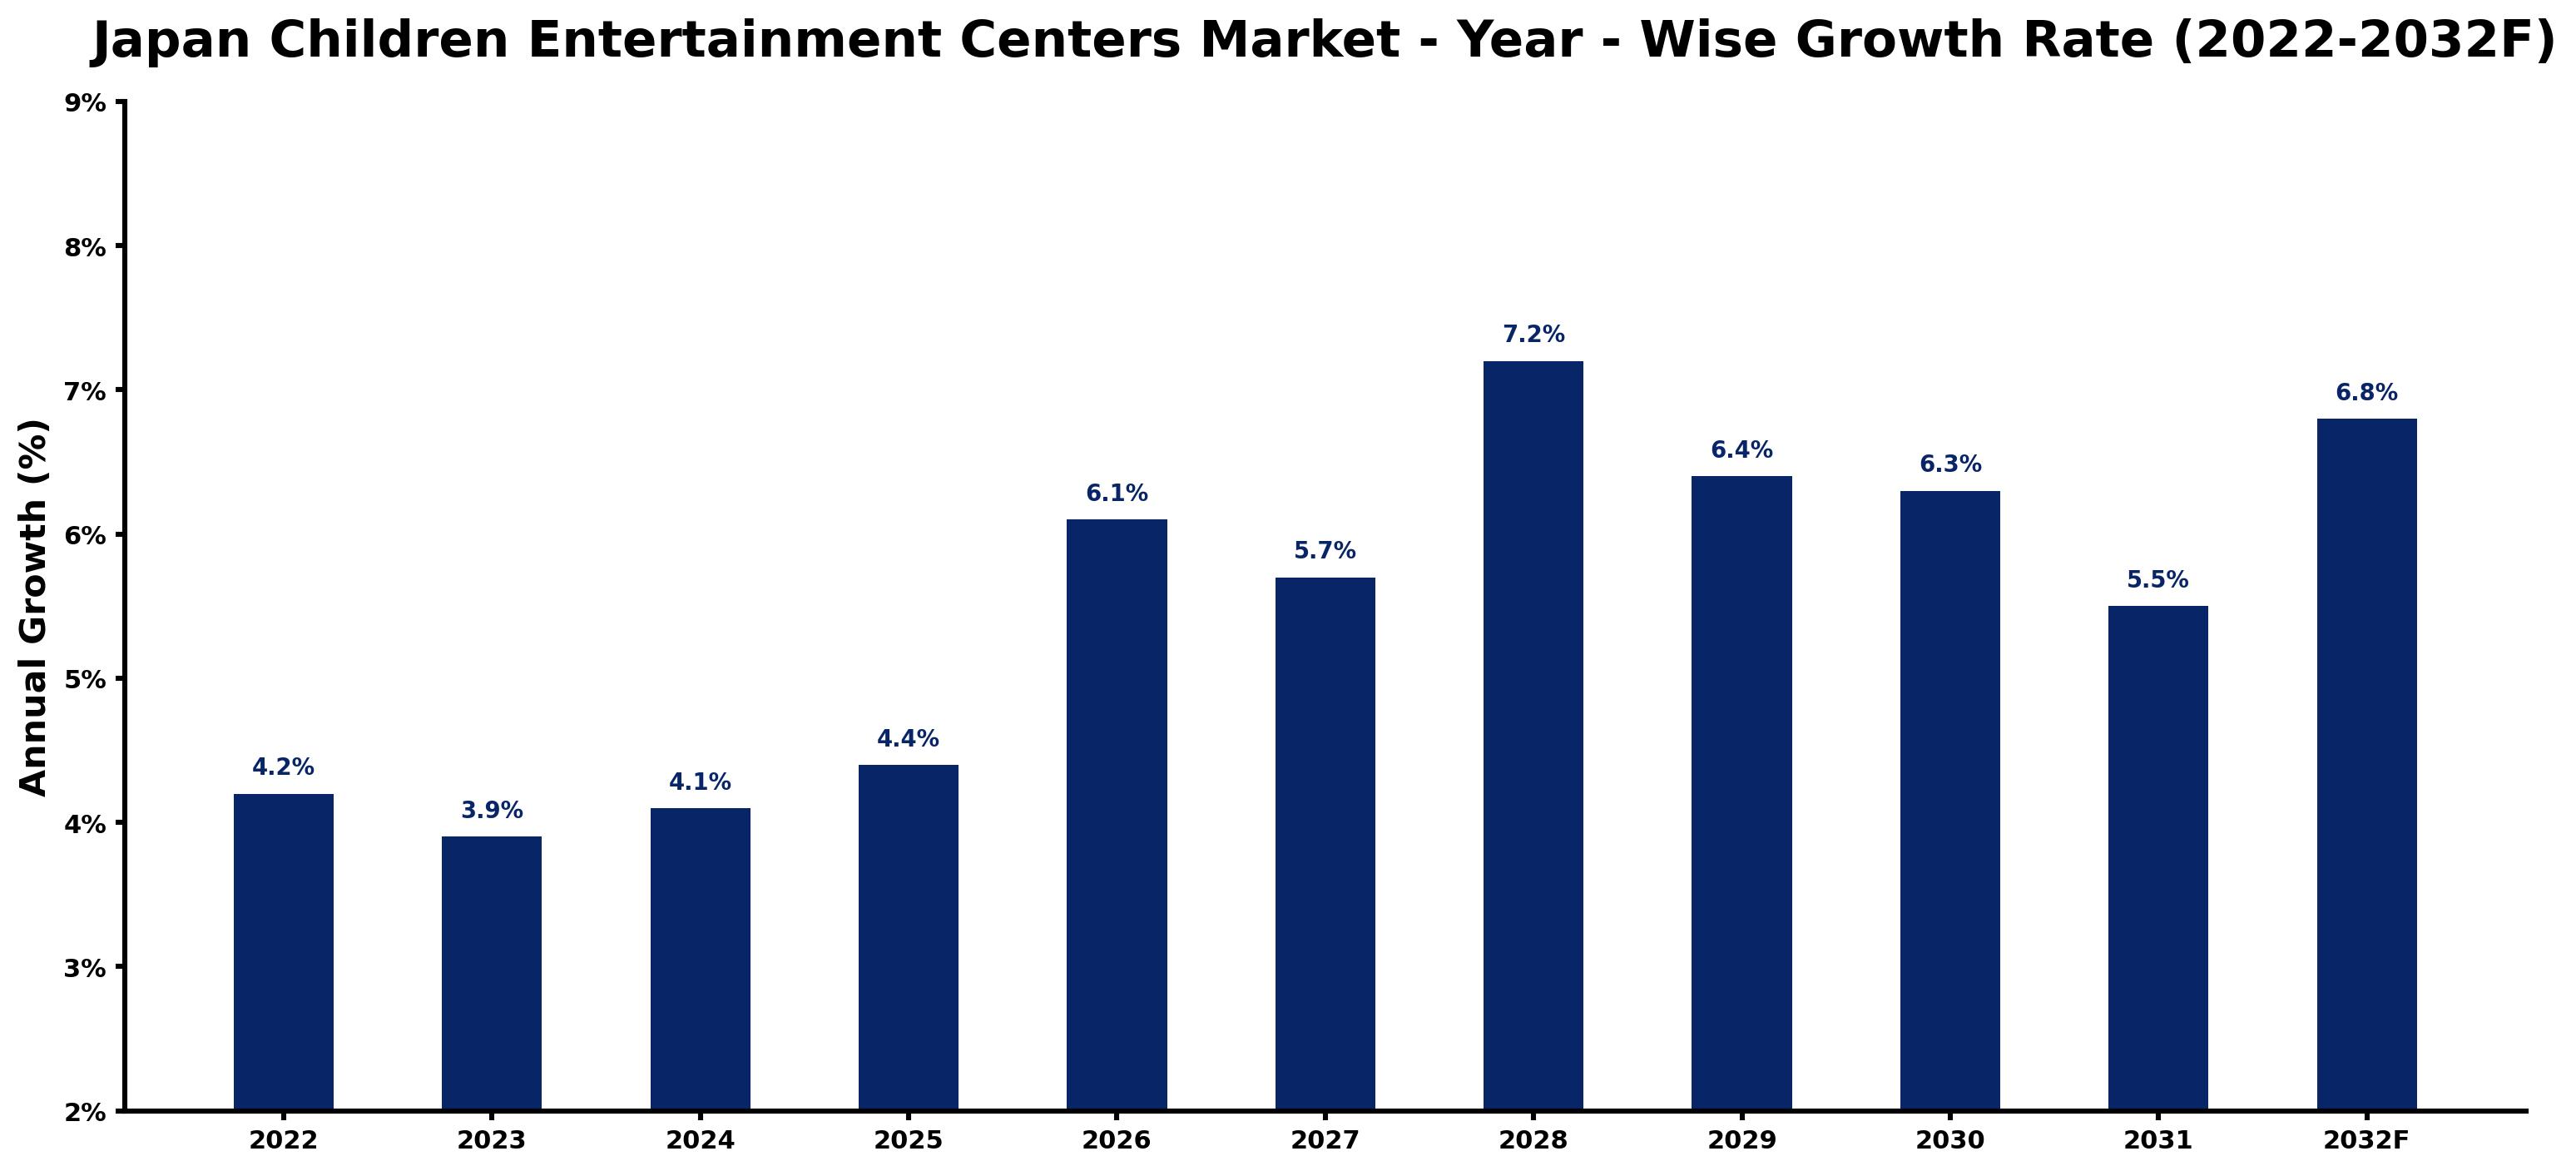
For each year, the table pairs the estimated growth rate with the leading influence on demand, showing how the drivers changed across the period.
| Year | Estimated Annual Growth (%) | Market Rationale |
| 2022 | 4.2 | The market showed steady growth, driven by strong domestic demand for family entertainment. |
| 2023 | 3.9 | Growth slowed slightly due to market saturation in urban areas and increased competition. |
| 2024 | 4.1 | An uptick in visitor numbers was noted as families sought more leisure options. |
| 2025 | 4.4 | The market experienced an increase in growth as new facilities opened across major cities. |
| 2026 | 6.1 | Investment in family-friendly spaces is projected to boost attendance and revenue. |
| 2027 | 5.7 | Growth will decelerate as existing centers reach capacity and new developments take time. |
| 2028 | 7.2 | The peak growth year will see improved offerings attracting more families to centers. |
| 2029 | 6.4 | A slight slowdown is anticipated as market conditions stabilise after peak growth. |
| 2030 | 6.3 | Growth will continue but at a moderated pace as competition intensifies. |
| 2031 | 5.5 | The market is expected to grow slower as consumer preferences evolve. |
| 2032 | 6.8 | An increase in family-oriented initiatives will support growth in entertainment centers. |
Note: Market size estimations and growth projections presented in this report are based on 6Wresearch's proprietary forecasting methodology, utilizing the latest available industry data, government publications, and primary research inputs.
Japan Children Entertainment Centers Market Synopsis
Children Entertainment Centers in Japan are recreational facilities designed for families, offering various activities that promote social interaction and physical activity. Tokyo serves as a major hub for these centers, with over 70% of families visiting at least once a month. The Japan Children Entertainment Centers Market is expanding due to increased spending on leisure activities, driven by domestic demand and government initiatives promoting family-friendly spaces and investments in safety standards.
Market Dynamics Impact Analysis (2026–2032)
| Factor | Type | Impact | Primary Segment Affected |
| Growing family demographics drive demand for entertainment options. | Driver | High | Families with Children (0-8) |
| Increased investment in safety standards enhances consumer confidence. | Driver | High | Families with Children (9-12) |
| Expansion of family-friendly recreational spaces creates new opportunities. | Opportunity | High | Families with Children (0-8) |
| Rising popularity of skill-based games attracts older children. | Opportunity | Medium | Skill/Competition Games |
| High operational costs can limit profitability for smaller centers. | Restraint | High | Up to 5 |
| Market saturation in urban areas restricts new center openings. | Restraint | Medium | 1 to 10 acres |
| Supply chain disruptions may delay new facility developments. | Challenge | High | 11 to 30 acres |
| Intense competition may lead to price wars among centers. | Challenge | Medium | Families with Children (9-12) |
Evaluation of Drivers in Japan Children Entertainment Centers Market (2026–2032)
The following drivers explain most of the expected growth.
| Drivers | Primary Segment Affected | Why It Matters (Evidence) |
| Increased family spending on leisure activities boosts attendance. | Families with Children (0-8) | Approximately 70% of families visit entertainment centers monthly, driving demand. |
| Government initiatives promote family-friendly environments, improving safety. | Families with Children (9-12) | In 2023, a program was launched to improve recreational spaces for families. |
| The rise in food and beverage offerings increases overall revenue. | Food & Beverages | Food sales account for about 30% of total revenue in entertainment centers. |
| Growing interest in AR and VR gaming zones attracts younger demographics. | AR and VR Gaming Zones | These zones are popular among tech-savvy children, enhancing visitor experience. |
| The expansion of facilities in urban areas meets rising demand. | 1 to 10 acres | Tokyo hosts numerous entertainment centers, catering to local families. |
Behind the steady rise in orders sits increased family spending on leisure activities, with over 70% of families visiting entertainment centers monthly. The rise in food and beverage offerings, which account for 30% of total revenue, also boosts overall profitability. Interest in AR and VR gaming zones attracts younger demographics, enriching the entertainment experience. Urban expansions are meeting the demand, particularly in Tokyo, where numerous centers cater to families.
Evaluation of Restraints in Japan Children Entertainment Centers Market
The following restraints limit how fast demand can grow.
| Market Restraint | Primary Segment Affected | Why It Matters (Evidence) |
| High operational costs can limit profitability for smaller centers. | Up to 5 | Smaller centers struggle to cover costs due to limited revenue streams. |
| Market saturation in urban areas restricts new center openings. | 1 to 10 acres | Existing centers face fierce competition, making new establishments challenging. |
| Delays in material supply can postpone construction and operational timelines. | 11 to 30 acres | Supply chain disruptions may delay new facility developments. |
| Seasonal fluctuations affect visitor numbers and revenue. | Families with Children (0-8) | Visitor numbers can drop during school holidays or off-peak seasons. |
| Limited marketing budgets hinder visibility for smaller centers. | Families with Children (9-12) | Smaller centers struggle to compete with larger, well-funded facilities. |
Japan Children Entertainment Centers Market Challenges
A shortage of skilled workers in the entertainment sector limits the ability of operators to provide quality experiences, resulting in longer wait times and frustration for families. Stringent safety regulations, such as the Japanese Standard for Safety in Children's Play Equipment, increase compliance costs, which can consume up to 20% of operating budgets for facilities. Rising construction material prices elevate the financial burden of establishing new centers, restricting options for families seeking recreational activities. The slow adoption of modern technologies like AR and VR reduces the attractiveness of centers to younger audiences, causing a potential decline in visitor numbers and revenue for operators.
Trends in the Japan Children Entertainment Centers Market
Several trends are reshaping the Japan Children Entertainment Centers Market; the most important are set out below.
- Shift towards Enhanced Safety Standards: In 2023, a new initiative was launched to improve safety standards in children's facilities, boosting consumer confidence. This shift is expected to increase attendance by families prioritising safety.
- Growing Popularity of Skill-Based Games: Skill-based games are becoming increasingly popular in entertainment centers, appealing to older children and teenagers. This trend is reflected in a growth rate of 7.8% for these activities.
- Expansion of AR and VR Gaming Zones: AR and VR gaming zones are gaining traction in entertainment centers, especially among younger demographics. Many facilities are incorporating these zones to enhance the overall experience.
- Increased Focus on Food and Beverage Offerings: Food and beverage sales are becoming a focal point for entertainment centers, accounting for 30% of total revenue. Facilities are improving their dining options to attract more visitors.
Investment Opportunities in the Japan Children Entertainment Centers Market
Several openings in the Japan Children Entertainment Centers Market merit attention from investors.
- Timing for Expansion is Ideal: Now is the time to invest in new entertainment centers, as families in urban areas seek more recreational options. The market size is projected to grow significantly by 2032.
- Growing Demand for Food Services: Food and beverage sales are expected to grow at 9.0%, presenting an opportunity for suppliers to improve dining experiences in centers. Family-oriented facilities are increasingly focusing on this area.
- Investment in Safety Equipment: The recent push for improved safety standards creates a demand for safety equipment suppliers. Facilities in urban areas are particularly looking to enhance their safety measures.
- Development of Larger Facilities: With an average size of 10,000 sq. ft., there is a need for larger facilities that can accommodate diverse activities. Urban centers are ideal for such developments.
Government Initiatives in the Japan Children Entertainment Centers Market
The 2023 initiative to improve safety standards in children's facilities builds on the Food Sanitation Act amendment from 2018, which introduced mandatory hygiene management. This measure requires entertainment centers to comply with updated safety protocols, ensuring a safer environment for children.
In 2023, funding was allocated to improve accessibility in entertainment centers, benefiting families seeking safe recreational spaces. The Ministry of Education supports initiatives aimed at enhancing children's recreational environments, ensuring compliance with safety regulations.
Future Insight of the Japan Children Entertainment Centers Market
By 2032, a government initiative to promote family-friendly recreational spaces will drive the establishment of new entertainment centers, enhancing options for families. Stricter safety standards will ensure a safer environment, encouraging more frequent visits from families. Technological advancements will transform entertainment experiences, appealing to a broader age range. With the average number of weekend visitors projected to reach 600 families, suppliers must adapt their offerings to meet the growing demand for diverse and engaging activities.
Market Segmentation Analysis
Japan Children Entertainment Centers Market report covers a detailed analysis of the following market segments:
By Visitor Demographics – Families with Children (0-8) Leads, Families with Children (9-12) Expected to Grow Fastest
According to Ravi Bhandari, Research Head at 6Wresearch, in 2025, Families with Children (0-8) led the visitor demographics split with a 39% share. Families with children aged 8 represent the largest segment due to their frequent visits to entertainment centers, seeking safe and engaging environments. This demographic's strong presence is reflected in the fact that over 70% of families with children visit these centers at least once a month. The quickest growth will come from Families with Children (9-12), forecast to expand at a CAGR of 8.2% between 2026 and 2032. The segment of families with children aged 12 is experiencing rapid growth as they seek more engaging and social experiences at entertainment venues. This trend is supported by the increasing popularity of skill-based games that appeal to older children. Suppliers should focus on creating tailored experiences that cater to the preferences of both younger and older children.
By Facility Size – 1 to 10 acres Lead, 11 to 30 acres Expected to Grow Fastest
1 to 10 acres held 15% of the Japan Children Entertainment Centers Market by facility size in 2025. The segment of 1 to 10 acres commands the largest share as it effectively accommodates a variety of outdoor activities that families seek. Many entertainment centers in urban areas are designed within this size range to maximise visitor engagement and satisfaction. Over 2026–2032, 11 to 30 acres are expected to post the fastest growth, at a CAGR of 8.6%. The segment of 11 to 30 acres is experiencing rapid growth due to the increasing demand for larger spaces that can host diverse family-oriented events. This trend indicates a shift towards larger facilities that can offer a wider range of activities for visitors. Investors should focus on the potential of larger facility sizes to attract more visitors and enhance the overall experience.
By Revenue Source – Entry Fees & Ticket Sales Leads, Food & Beverages Expected to Grow Fastest
Entry Fees & Ticket Sales accounted for 46% of the market by revenue source in 2025. Entry fees and ticket sales are the primary revenue source for children's entertainment centers, highlighting their importance in the overall financial model. The average entry fee of around 1,500 yen per child underscores the reliance on this revenue stream for operational sustainability. Food & Beverages are projected to grow fastest, at a CAGR of 9.0% during 2026–2032. Food and beverage sales are rapidly increasing, accounting for approximately 30% of total revenue, as families seek dining options during their visits. This growth reflects the necessity of enhancing visitor satisfaction through quality food services. Operators must prioritise food and beverage offerings to boost overall revenue and improve customer experience.
By Activity Area – Arcade Studios Lead, Skill/Competition Games Expected to Grow Fastest
Arcade Studios took 51% of activity area revenue in 2025, more than any other category. Arcade studios are the leading attraction in children's entertainment centers, appealing to a wide range of visitors with their diverse gaming options. The popularity of arcade games ensures a steady stream of families seeking entertainment during their outings. Skill/Competition Games are set to record the highest CAGR in this split, 7.8% over 2026–2032. Skill and competition games are gaining traction as they cater to older children, fostering a competitive environment that encourages repeat visits. This trend suggests that entertainment centers may need to expand their offerings to include more of these engaging games. Operators should consider diversifying their activity areas to include more skill-based games to attract a broader audience.
Key Attractiveness of the Report
- 10 Years of Market Numbers
- Historical Data Starting from 2022 to 2025
- Base Year 2025
- Forecast Data until 2032
- Key Performance Indicators Impacting the Market
- Major Upcoming Developments and Projects
Key Highlights of the Report:
- Japan Children Entertainment Centers Market Outlook
- Market Size of Japan Children Entertainment Centers Market, 2025
- Forecast of Japan Children Entertainment Centers Market, 2032
- Historical Data and Forecast of Japan Children Entertainment Centers Revenues & Volume for the Period 2022-2032
- Japan Children Entertainment Centers Market Trend Evolution
- Japan Children Entertainment Centers Market Drivers and Challenges
- Japan Children Entertainment Centers Price Trends
- Japan Children Entertainment Centers Porter's Five Forces
- Japan Children Entertainment Centers Industry Life Cycle
- Historical Data and Forecast of Japan Children Entertainment Centers Market Revenues & Volume By Visitor Demographics for the Period 2022-2032
- Historical Data and Forecast of Japan Children Entertainment Centers Market Revenues & Volume By Families with Children (0-8) for the Period 2022-2032
- Historical Data and Forecast of Japan Children Entertainment Centers Market Revenues & Volume By Families with Children (9-12) for the Period 2022-2032
- Historical Data and Forecast of Japan Children Entertainment Centers Market Revenues & Volume By Teenagers (12-18) for the Period 2022-2032
- Historical Data and Forecast of Japan Children Entertainment Centers Market Revenues & Volume By Young Adults (18-24) for the Period 2022-2032
- Historical Data and Forecast of Japan Children Entertainment Centers Market Revenues & Volume By Adults (Ages 24+) for the Period 2022-2032
- Historical Data and Forecast of Japan Children Entertainment Centers Market Revenues & Volume By Facility Size for the Period 2022-2032
- Historical Data and Forecast of Japan Children Entertainment Centers Market Revenues & Volume By Up to 5,000 sq. ft. for the Period 2022-2032
- Historical Data and Forecast of Japan Children Entertainment Centers Market Revenues & Volume By 5,001 to 10,000 sq. ft. for the Period 2022-2032
- Historical Data and Forecast of Japan Children Entertainment Centers Market Revenues & Volume By 10,001 to 20,000 sq. ft. for the Period 2022-2032
- Historical Data and Forecast of Japan Children Entertainment Centers Market Revenues & Volume By 20,001 to 40,000 sq. ft. for the Period 2022-2032
- Historical Data and Forecast of Japan Children Entertainment Centers Market Revenues & Volume By 1 to 10 acres for the Period 2022-2032
- Historical Data and Forecast of Japan Children Entertainment Centers Market Revenues & Volume By 11 to 30 acres for the Period 2022-2032
- Historical Data and Forecast of Japan Children Entertainment Centers Market Revenues & Volume By Over 30 acres for the Period 2022-2032
- Historical Data and Forecast of Japan Children Entertainment Centers Market Revenues & Volume By Revenue Source for the Period 2022-2032
- Historical Data and Forecast of Japan Children Entertainment Centers Market Revenues & Volume By Entry Fees & Ticket Sales for the Period 2022-2032
- Historical Data and Forecast of Japan Children Entertainment Centers Market Revenues & Volume By Food & Beverages for the Period 2022-2032
- Historical Data and Forecast of Japan Children Entertainment Centers Market Revenues & Volume By Merchandising for the Period 2022-2032
- Historical Data and Forecast of Japan Children Entertainment Centers Market Revenues & Volume By Advertisement for the Period 2022-2032
- Historical Data and Forecast of Japan Children Entertainment Centers Market Revenues & Volume By Others for the Period 2022-2032
- Historical Data and Forecast of Japan Children Entertainment Centers Market Revenues & Volume By Activity Area for the Period 2022-2032
- Historical Data and Forecast of Japan Children Entertainment Centers Market Revenues & Volume By Arcade Studios for the Period 2022-2032
- Historical Data and Forecast of Japan Children Entertainment Centers Market Revenues & Volume By AR and VR Gaming Zones for the Period 2022-2032
- Historical Data and Forecast of Japan Children Entertainment Centers Market Revenues & Volume By Physical Play Activities for the Period 2022-2032
- Historical Data and Forecast of Japan Children Entertainment Centers Market Revenues & Volume By Skill/Competition Games for the Period 2022-2032
- Historical Data and Forecast of Japan Children Entertainment Centers Market Revenues & Volume By Others for the Period 2022-2032
- Japan Children Entertainment Centers Import Export Trade Statistics
- Market Opportunity Assessment By Visitor Demographics
- Market Opportunity Assessment By Facility Size
- Market Opportunity Assessment By Revenue Source
- Market Opportunity Assessment By Activity Area
- Japan Children Entertainment Centers Top Companies Market Share
- Japan Children Entertainment Centers Competitive Benchmarking By Technical and Operational Parameters
- Japan Children Entertainment Centers Company Profiles
- Japan Children Entertainment Centers Key Strategic Recommendations
Market Covered
The following segment groups are covered in the report.
By Visitor Demographics
- Families with Children (0-8)
- Families with Children (9-12)
- Teenagers (12-18)
- Young Adults (18-24)
- Adults (Ages 24+)
By Facility Size
- Up to 5
- 000 sq. ft.
- 5
- 001 to 10
- 10
- 001 to 20
- 20
- 001 to 40
- 1 to 10 acres
- 11 to 30 acres
- Over 30 acres
By Revenue Source
- Entry Fees & Ticket Sales
- Food & Beverages
- Merchandising
- Advertisement
- Others
By Activity Area
- Arcade Studios
- AR and VR Gaming Zones
- Physical Play Activities
- Skill/Competition Games
- Others































