Japan Coffee and Tea Manufacturing Market (2025-2031) | Analysis, Competitive Landscape, Value, Companies, Size & Revenue, Growth, Forecast, Share, Trends, Outlook, Industry, Segmentation
Market Forecast By Type (Coffee, Tea), By Distribution Channel (Supermarkets/Hypermarkets, Convenience Stores, E-Commerce, Others), By Form (Liquid, Powder, Capsules), By Packaging (Containers, Bags, Packets, Pouches) And Competitive Landscape
| Product Code: ETC7734887 | Publication Date: Sep 2024 | Updated Date: Oct 2025 | Product Type: Market Research Report | |
| Publisher: 6Wresearch | Author: Vasudha | No. of Pages: 75 | No. of Figures: 35 | No. of Tables: 20 |
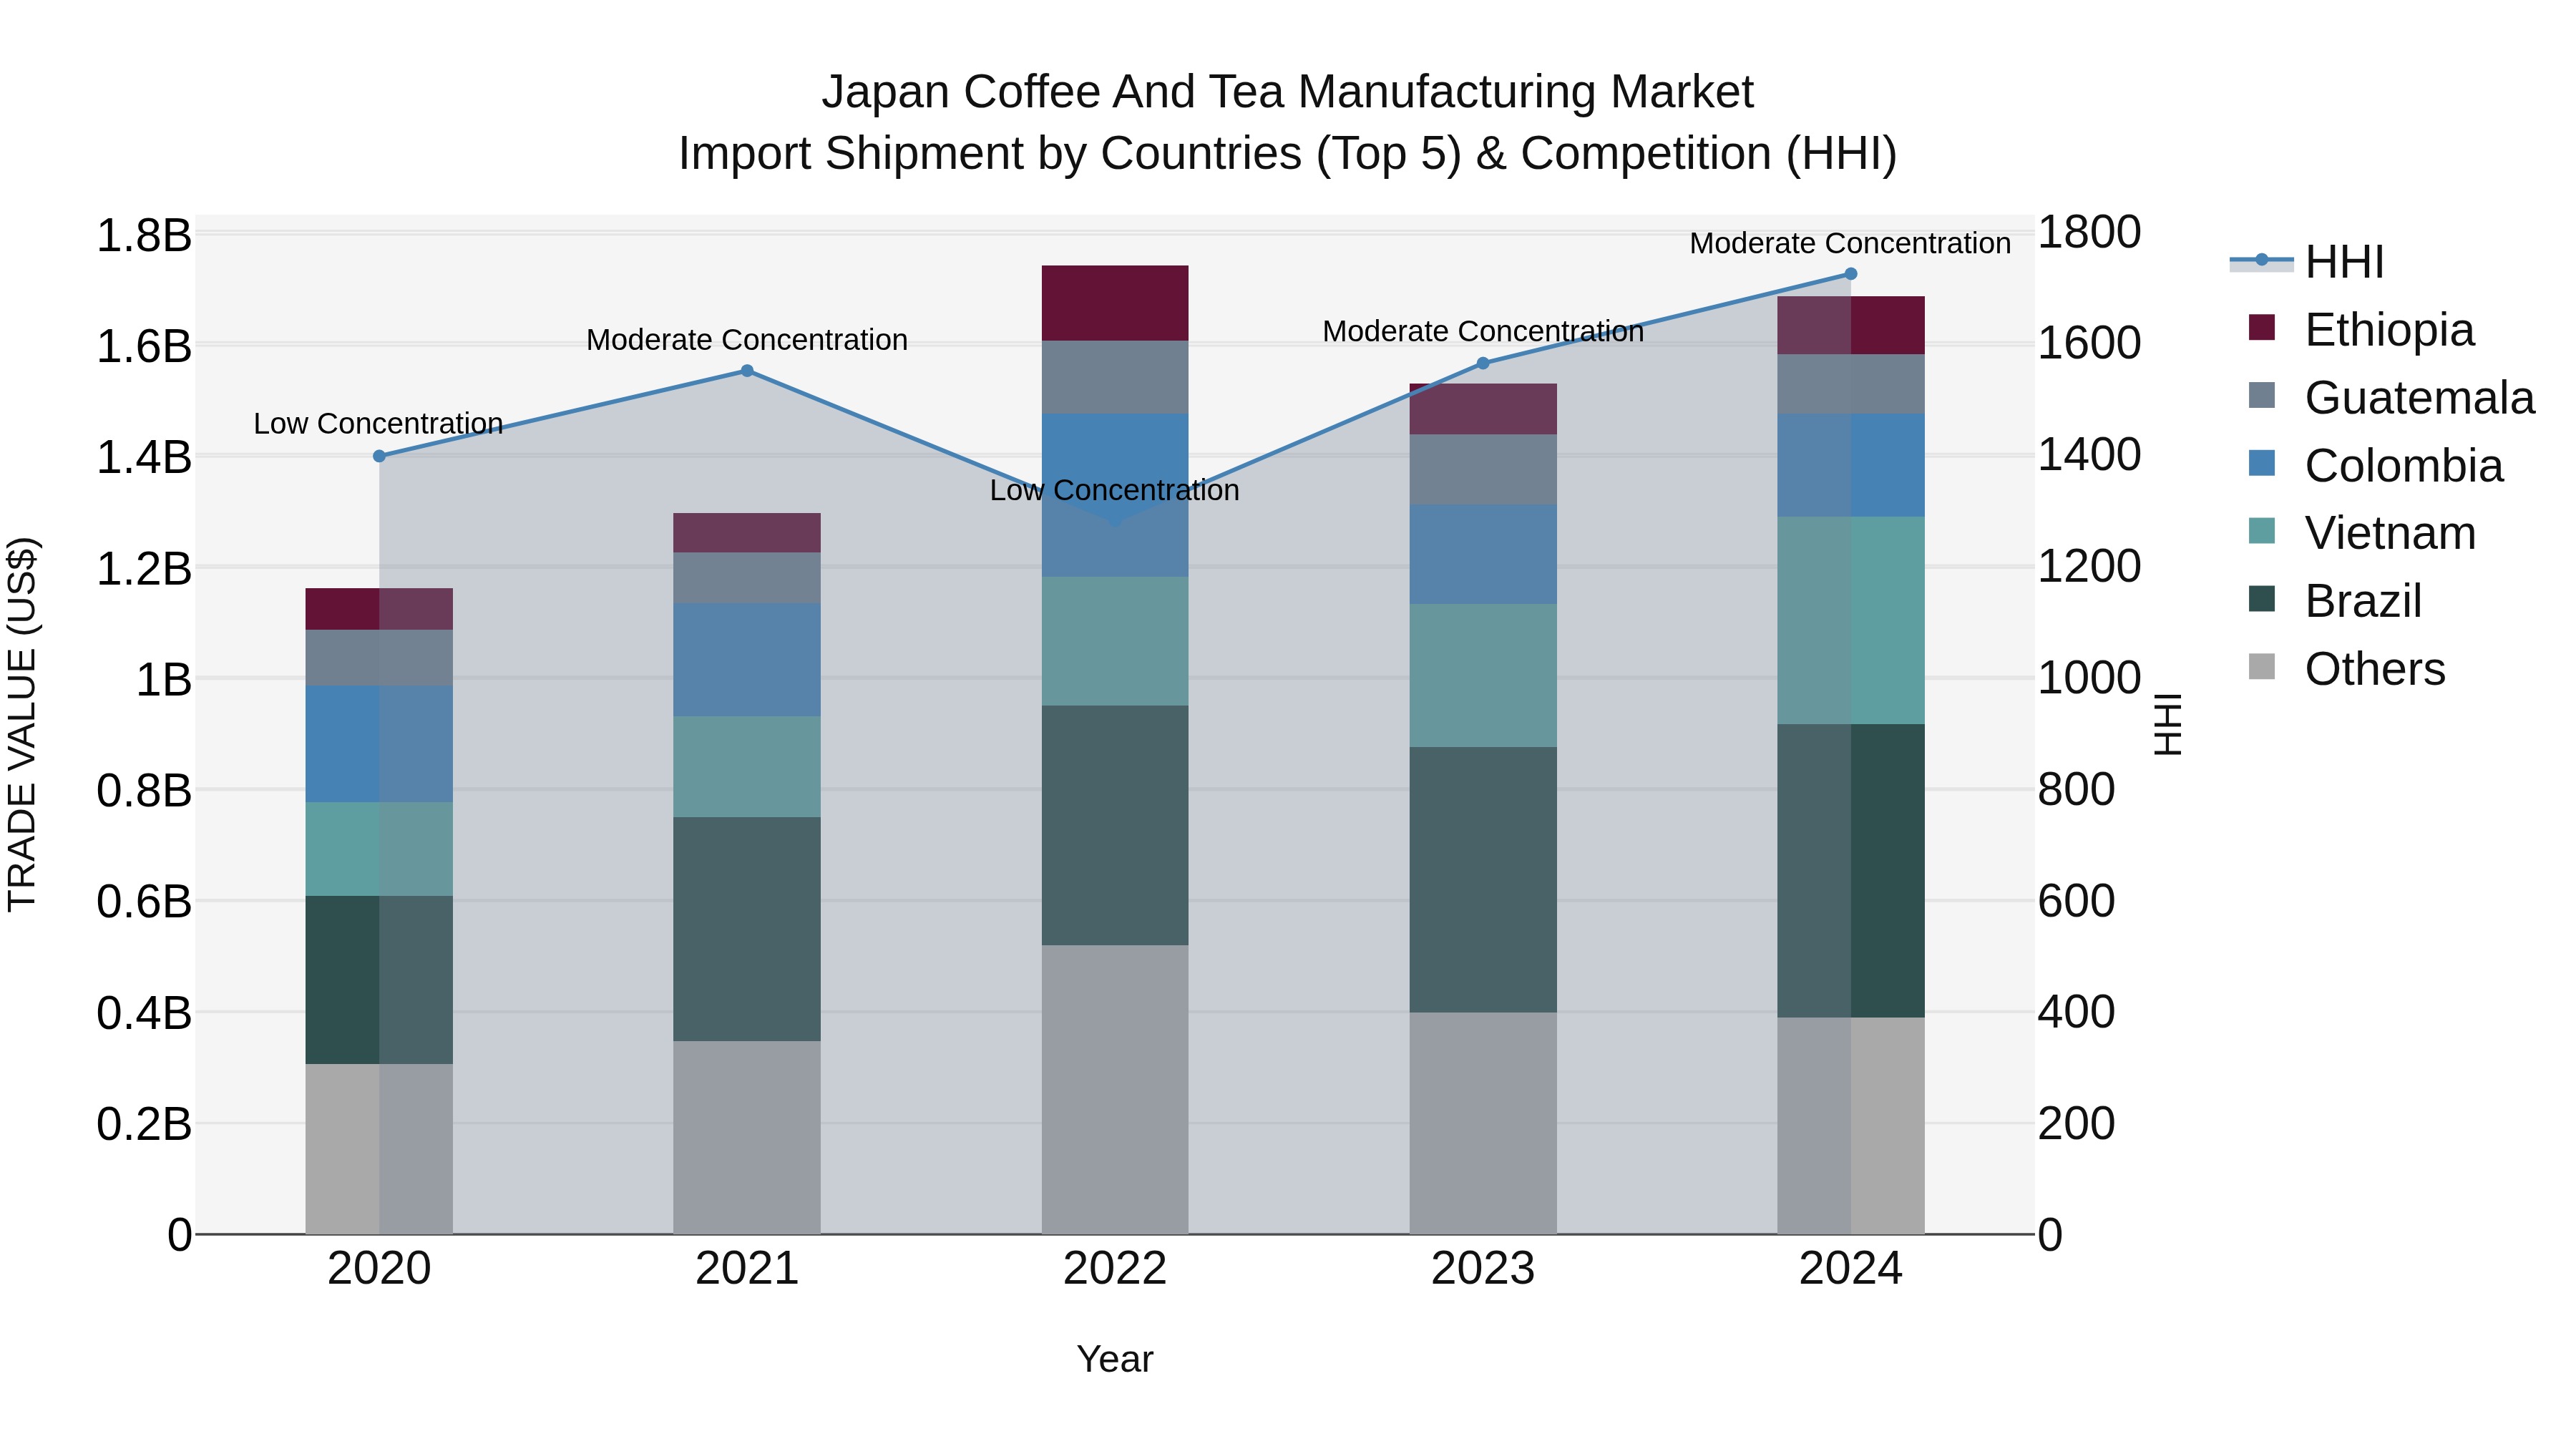
Japan Coffee And Tea Manufacturing Market Import Shipment by Countries (Top 5) & Competition (HHI)
In 2024, Japan experienced a steady increase in coffee and tea import shipments, with key exporting countries including Brazil, Vietnam, Colombia, Guatemala, and Ethiopia. The market remained moderately concentrated with a Herfindahl-Hirschman Index (HHI) indicating stable competition. The impressive compound annual growth rate (CAGR) of 9.77% from 2020 to 2024 showcases sustained demand for these products in Japan. Notably, the growth rate spiked to 10.24% from 2023 to 2024, indicating a potential upward trend in consumption. This data suggests a promising outlook for the coffee and tea manufacturing import market in Japan.
Key Highlights of the Report:
- Japan Coffee and Tea Manufacturing Market Outlook
- Market Size of Japan Coffee and Tea Manufacturing Market, 2024
- Forecast of Japan Coffee and Tea Manufacturing Market, 2031
- Historical Data and Forecast of Japan Coffee and Tea Manufacturing Revenues & Volume for the Period 2021- 2031
- Japan Coffee and Tea Manufacturing Market Trend Evolution
- Japan Coffee and Tea Manufacturing Market Drivers and Challenges
- Japan Coffee and Tea Manufacturing Price Trends
- Japan Coffee and Tea Manufacturing Porter's Five Forces
- Japan Coffee and Tea Manufacturing Industry Life Cycle
- Historical Data and Forecast of Japan Coffee and Tea Manufacturing Market Revenues & Volume By Type for the Period 2021- 2031
- Historical Data and Forecast of Japan Coffee and Tea Manufacturing Market Revenues & Volume By Coffee for the Period 2021- 2031
- Historical Data and Forecast of Japan Coffee and Tea Manufacturing Market Revenues & Volume By Tea for the Period 2021- 2031
- Historical Data and Forecast of Japan Coffee and Tea Manufacturing Market Revenues & Volume By Distribution Channel for the Period 2021- 2031
- Historical Data and Forecast of Japan Coffee and Tea Manufacturing Market Revenues & Volume By Supermarkets/Hypermarkets for the Period 2021- 2031
- Historical Data and Forecast of Japan Coffee and Tea Manufacturing Market Revenues & Volume By Convenience Stores for the Period 2021- 2031
- Historical Data and Forecast of Japan Coffee and Tea Manufacturing Market Revenues & Volume By E-Commerce for the Period 2021- 2031
- Historical Data and Forecast of Japan Coffee and Tea Manufacturing Market Revenues & Volume By Others for the Period 2021- 2031
- Historical Data and Forecast of Japan Coffee and Tea Manufacturing Market Revenues & Volume By Form for the Period 2021- 2031
- Historical Data and Forecast of Japan Coffee and Tea Manufacturing Market Revenues & Volume By Liquid for the Period 2021- 2031
- Historical Data and Forecast of Japan Coffee and Tea Manufacturing Market Revenues & Volume By Powder for the Period 2021- 2031
- Historical Data and Forecast of Japan Coffee and Tea Manufacturing Market Revenues & Volume By Capsules for the Period 2021- 2031
- Historical Data and Forecast of Japan Coffee and Tea Manufacturing Market Revenues & Volume By Packaging for the Period 2021- 2031
- Historical Data and Forecast of Japan Coffee and Tea Manufacturing Market Revenues & Volume By Containers for the Period 2021- 2031
- Historical Data and Forecast of Japan Coffee and Tea Manufacturing Market Revenues & Volume By Bags for the Period 2021- 2031
- Historical Data and Forecast of Japan Coffee and Tea Manufacturing Market Revenues & Volume By Packets for the Period 2021- 2031
- Historical Data and Forecast of Japan Coffee and Tea Manufacturing Market Revenues & Volume By Pouches for the Period 2021- 2031
- Japan Coffee and Tea Manufacturing Import Export Trade Statistics
- Market Opportunity Assessment By Type
- Market Opportunity Assessment By Distribution Channel
- Market Opportunity Assessment By Form
- Market Opportunity Assessment By Packaging
- Japan Coffee and Tea Manufacturing Top Companies Market Share
- Japan Coffee and Tea Manufacturing Competitive Benchmarking By Technical and Operational Parameters
- Japan Coffee and Tea Manufacturing Company Profiles
- Japan Coffee and Tea Manufacturing Key Strategic Recommendations
Frequently Asked Questions About the Market Study (FAQs):
6Wresearch actively monitors the Japan Coffee and Tea Manufacturing Market and publishes its comprehensive annual report, highlighting emerging trends, growth drivers, revenue analysis, and forecast outlook. Our insights help businesses to make data-backed strategic decisions with ongoing market dynamics. Our analysts track relevent industries related to the Japan Coffee and Tea Manufacturing Market, allowing our clients with actionable intelligence and reliable forecasts tailored to emerging regional needs.
Yes, we provide customisation as per your requirements. To learn more, feel free to contact us on sales@6wresearch.com
1 Executive Summary |
2 Introduction |
2.1 Key Highlights of the Report |
2.2 Report Description |
2.3 Market Scope & Segmentation |
2.4 Research Methodology |
2.5 Assumptions |
3 Japan Coffee and Tea Manufacturing Market Overview |
3.1 Japan Country Macro Economic Indicators |
3.2 Japan Coffee and Tea Manufacturing Market Revenues & Volume, 2021 & 2031F |
3.3 Japan Coffee and Tea Manufacturing Market - Industry Life Cycle |
3.4 Japan Coffee and Tea Manufacturing Market - Porter's Five Forces |
3.5 Japan Coffee and Tea Manufacturing Market Revenues & Volume Share, By Type, 2021 & 2031F |
3.6 Japan Coffee and Tea Manufacturing Market Revenues & Volume Share, By Distribution Channel, 2021 & 2031F |
3.7 Japan Coffee and Tea Manufacturing Market Revenues & Volume Share, By Form, 2021 & 2031F |
3.8 Japan Coffee and Tea Manufacturing Market Revenues & Volume Share, By Packaging, 2021 & 2031F |
4 Japan Coffee and Tea Manufacturing Market Dynamics |
4.1 Impact Analysis |
4.2 Market Drivers |
4.2.1 Growing health consciousness among consumers leading to increased demand for specialty and health-focused coffee and tea products. |
4.2.2 Rising popularity of coffee shops and cafes in Japan, driving the demand for high-quality coffee and tea products. |
4.2.3 Increasing disposable income and changing lifestyles contributing to the growth of the coffee and tea manufacturing market in Japan. |
4.3 Market Restraints |
4.3.1 Fluctuating prices of raw materials such as coffee beans and tea leaves impacting the production costs. |
4.3.2 Intense competition among coffee and tea manufacturers leading to pricing pressures and margin erosion. |
4.3.3 Stringent regulations and quality standards in the food and beverage industry affecting the manufacturing processes and product innovation. |
5 Japan Coffee and Tea Manufacturing Market Trends |
6 Japan Coffee and Tea Manufacturing Market, By Types |
6.1 Japan Coffee and Tea Manufacturing Market, By Type |
6.1.1 Overview and Analysis |
6.1.2 Japan Coffee and Tea Manufacturing Market Revenues & Volume, By Type, 2021- 2031F |
6.1.3 Japan Coffee and Tea Manufacturing Market Revenues & Volume, By Coffee, 2021- 2031F |
6.1.4 Japan Coffee and Tea Manufacturing Market Revenues & Volume, By Tea, 2021- 2031F |
6.2 Japan Coffee and Tea Manufacturing Market, By Distribution Channel |
6.2.1 Overview and Analysis |
6.2.2 Japan Coffee and Tea Manufacturing Market Revenues & Volume, By Supermarkets/Hypermarkets, 2021- 2031F |
6.2.3 Japan Coffee and Tea Manufacturing Market Revenues & Volume, By Convenience Stores, 2021- 2031F |
6.2.4 Japan Coffee and Tea Manufacturing Market Revenues & Volume, By E-Commerce, 2021- 2031F |
6.2.5 Japan Coffee and Tea Manufacturing Market Revenues & Volume, By Others, 2021- 2031F |
6.3 Japan Coffee and Tea Manufacturing Market, By Form |
6.3.1 Overview and Analysis |
6.3.2 Japan Coffee and Tea Manufacturing Market Revenues & Volume, By Liquid, 2021- 2031F |
6.3.3 Japan Coffee and Tea Manufacturing Market Revenues & Volume, By Powder, 2021- 2031F |
6.3.4 Japan Coffee and Tea Manufacturing Market Revenues & Volume, By Capsules, 2021- 2031F |
6.4 Japan Coffee and Tea Manufacturing Market, By Packaging |
6.4.1 Overview and Analysis |
6.4.2 Japan Coffee and Tea Manufacturing Market Revenues & Volume, By Containers, 2021- 2031F |
6.4.3 Japan Coffee and Tea Manufacturing Market Revenues & Volume, By Bags, 2021- 2031F |
6.4.4 Japan Coffee and Tea Manufacturing Market Revenues & Volume, By Packets, 2021- 2031F |
6.4.5 Japan Coffee and Tea Manufacturing Market Revenues & Volume, By Pouches, 2021- 2031F |
7 Japan Coffee and Tea Manufacturing Market Import-Export Trade Statistics |
7.1 Japan Coffee and Tea Manufacturing Market Export to Major Countries |
7.2 Japan Coffee and Tea Manufacturing Market Imports from Major Countries |
8 Japan Coffee and Tea Manufacturing Market Key Performance Indicators |
8.1 Sustainability metrics such as carbon footprint reduction initiatives and waste management practices. |
8.2 Customer satisfaction scores and feedback on product quality and taste. |
8.3 Innovation rate measured by the number of new product launches and adoption of new brewing technologies. |
8.4 Employee retention rates and training programs to ensure a skilled workforce. |
8.5 Brand reputation and recognition through surveys and market perception studies. |
9 Japan Coffee and Tea Manufacturing Market - Opportunity Assessment |
9.1 Japan Coffee and Tea Manufacturing Market Opportunity Assessment, By Type, 2021 & 2031F |
9.2 Japan Coffee and Tea Manufacturing Market Opportunity Assessment, By Distribution Channel, 2021 & 2031F |
9.3 Japan Coffee and Tea Manufacturing Market Opportunity Assessment, By Form, 2021 & 2031F |
9.4 Japan Coffee and Tea Manufacturing Market Opportunity Assessment, By Packaging, 2021 & 2031F |
10 Japan Coffee and Tea Manufacturing Market - Competitive Landscape |
10.1 Japan Coffee and Tea Manufacturing Market Revenue Share, By Companies, 2024 |
10.2 Japan Coffee and Tea Manufacturing Market Competitive Benchmarking, By Operating and Technical Parameters |
11 Company Profiles |
12 Recommendations |
13 Disclaimer |
Export potential assessment - trade Analytics for 2030
Export potential enables firms to identify high-growth global markets with greater confidence by combining advanced trade intelligence with a structured quantitative methodology. The framework analyzes emerging demand trends and country-level import patterns while integrating macroeconomic and trade datasets such as GDP and population forecasts, bilateral import–export flows, tariff structures, elasticity differentials between developed and developing economies, geographic distance, and import demand projections. Using weighted trade values from 2020–2024 as the base period to project country-to-country export potential for 2030, these inputs are operationalized through calculated drivers such as gravity model parameters, tariff impact factors, and projected GDP per-capita growth. Through an analysis of hidden potentials, demand hotspots, and market conditions that are most favorable to success, this method enables firms to focus on target countries, maximize returns, and global expansion with data, backed by accuracy.
By factoring in the projected importer demand gap that is currently unmet and could be potential opportunity, it identifies the potential for the Exporter (Country) among 190 countries, against the general trade analysis, which identifies the biggest importer or exporter.
To discover high-growth global markets and optimize your business strategy:
Click Here
Pricing
- Single User License$ 1,995
- Department License$ 2,400
- Site License$ 3,120
- Global License$ 3,795

Search
Thought Leadership and Analyst Meet


Our Clients
Latest Reports
- India Ultrasonic Smart Water Meter Market (2026-2032) | Outlook, Competition, Drivers, Trends, Demand, Competitive, Strategic Insights, Companies, Challenges, Strategy, Consumer Insights, Analysis, Opportunities, Growth, Size, Share, Industry, Revenue, Segments, Value, Segmentation, Supply, Forecast, Restraints,
- India Electromagnetic Bulk Flow Meter Market (2026-2032) | Analysis, Challenges, Strategic Insights, Supply, Forecast, Growth, Share, Consumer Insights, Competitive, Value, Outlook, Size & Demand,
- India Battery Powered Bulk Flow Meter Market (2026-2032) | Outlook, Analysis, Competitive Landscape, Growth, Size, Trends, Value, Revenue, Companies, Segmentation, Share & Forecast
- Bosnia and Herzegovina Fuel-Efficient Winglets Market (2026-2032) | Growth, Competition, Strategy, Restraints, Trends, Challenges, segmentation, Value, Outlook, Investment Opportunities, Analysis, Revenue, Companies, Insights, Pricing, Size, Drivers, Demand, Share, Forecast
- Canada Cloud CFD Market (2026-2032) | Size & Revenue, Industry, Growth, Competitive Landscape, Forecast, Segmentation, Value, Outlook, Trends, Share, Analysis, Companies
- Taiwan Food Delivery Platform Market (2026-2032) | Companies, Outlook, Analysis, Trends, Value, Revenue, Segmentation, Share, Forecast, Competitive Landscape, Growth, Size & Forecast
- United Kingdom (UK) Long-term Care Insurance Market (2026-2032) | Growth, Share, Consumer Insights, Drivers, Opportunities, Competition, Pricing Analysis, Segments, Restraints, Companies, Competitive, Value, Outlook, Size, Demand, Analysis, Challenges, Strategic Insights, Investment Trends, Revenue, Trends, Supply, Forecast
- United Kingdom (UK) Long Term Care Market (2026-2032) | Companies, Outlook, Analysis, Trends, Value, Revenue, Segmentation, Share, Forecast, Competitive Landscape, Growth, Size & Forecast
- Iraq Insulation and Waterproofing Market (2026-2032) | Outlook, Drivers, Growth, Size, Share, Industry, Revenue, Trends, Demand, Competitive, Strategic Insights, Opportunities, Segments, Companies, Challenges, Strategy, Consumer Insights, Analysis, Investment Trends, Value, Segmentation, Forecast, Restraints
- India Switchgear Market Outlook (2026-2032) | Size, Share, Trends, Growth, Revenue, Forecast, Analysis, Value, Outlook
Industry Events and Analyst Meet

India EV Show 2026

EV tech India Expo 2026

Auto Tech Asia 2026

Battery Tech India 2026

Smart Production Solutions Guangzhou 2026
Whitepaper
- Middle East & Africa Commercial Security Market Click here to view more.
- Middle East & Africa Fire Safety Systems & Equipment Market Click here to view more.
- GCC Drone Market Click here to view more.
- Middle East Lighting Fixture Market Click here to view more.
- GCC Physical & Perimeter Security Market Click here to view more.
6WResearch In News
- Doha a strategic location for EV manufacturing hub: IPA Qatar
- Demand for luxury TVs surging in the GCC, says Samsung
- Empowering Growth: The Thriving Journey of Bangladesh’s Cable Industry
- Demand for luxury TVs surging in the GCC, says Samsung
- Video call with a traditional healer? Once unthinkable, it’s now common in South Africa
- Intelligent Buildings To Smooth GCC’s Path To Net Zero