Japan Electromagnetic NDT Market (2026-2032) | Size, Share, Analysis, Value, Trends, Forecast, Industry, Revenue, Companies & Growth
Market Forecast By Method (Eddy Current Testing, Remote Field Testing, Magnetic Flux Leakage Testing), By Vertical (Oil & Gas, Power Generation, Automotive, Aerospace) And Competitive Landscape
| Product Code: ETC4591583 | Publication Date: Jul 2023 | Updated Date: May 2026 | Product Type: Report | |
| Publisher: 6Wresearch | Author: Ravi Bhandari | No. of Pages: 85 | No. of Figures: 45 | No. of Tables: 25 |
Japan Electromagnetic NDT Market Growth Rate
According to 6Wresearch internal database and industry insights, the Japan Electromagnetic Non-Destructive Testing (NDT) Market is growing at a compound annual growth rate (CAGR) of 9.85% during the forecast period (2026-2032).
Japan Electromagnetic NDT Market Year-wise Growth Rate and Key Drivers
This graph highlights how the Japan Electromagnetic NDT Market has steadily grown over the past five years, supported by major growth factors.
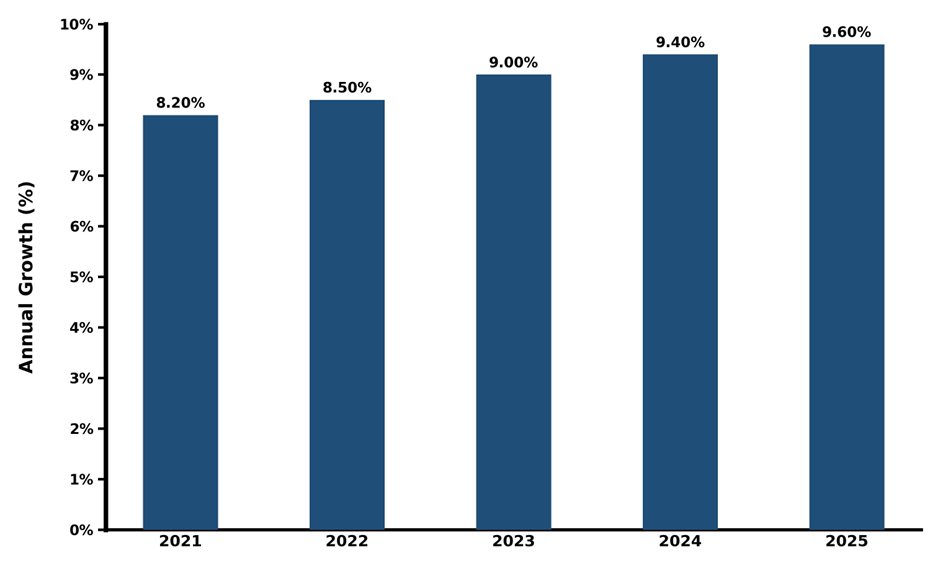
The table below presents the year‑wise growth rates along with the key drivers influencing the market
| Years | Est. Annual Growth in % | Growth Drivers |
| 2021 | 8.2% | Increasing demand for quality assurance and safety standards across industries. |
| 2022 | 8.5% | The rapid adoption of automation in testing processes results in a decline in human errors. |
| 2023 | 9% | Government regulations indicating the importance of security & safety levels. |
| 2024 | 9.4% | Rise of demand for electromagnetic testing in the automotive and aerospace industries. |
| 2025 | 9.6% | Technological advancements in NDT equipment, improving efficiency and accuracy. |
Topics Covered in the Japan Electromagnetic NDT Market Report
Japan Electromagnetic NDT Market report thoroughly covers the market by method, vertical, and regional trends. The market report provides an unbiased and detailed analysis of ongoing market trends, opportunities/high growth areas, and market drivers, which would help stakeholders devise and align their market strategies according to the current and future market dynamics.
Japan Electromagnetic NDT Market Highlights
| Report Name |
Japan Electromagnetic NDT Market |
| Forecast period | 2026-2032 |
| CAGR | 9.85% |
| Market Size |
Power Generation |
Japan Electromagnetic NDT Market Synopsis
The Japan Electromagnetic NDT Market is predicted to experience a steady growth, owned by increasing safety standards across several industries, including automotive, aerospace, and power generation. Also, the adoption of electromagnetic NDT methods such as Eddy Current Testing, Magnetic Flux Leakage Testing, and Remote Field Testing are leading to the growth of the market. Additionally, the government regulations mandating strict quality checks for industrial equipment and increasing technological advancements are also significant contributors to market’s expansion.
Evaluation of Growth Drivers in the Japan Electromagnetic NDT Market (2026-2032)
Below mentioned are some growth drivers and their impact on market dynamics:
| Drivers | Primary Segments Affected | Why It Matters |
| Government Regulations | All Segments | Enhances the importance of compliance, safety, and quality assurance. |
| Technological Advancements | Method (Eddy Current, Remote Field, Magnetic Flux Leakage) | Drives accuracy, efficiency, and cost-effectiveness in testing processes. |
| Rising Demand for Safety | Vertical (Oil & Gas, Power Generation, Automotive, Aerospace) | Increases need for electromagnetic NDT to maintain industry standards. |
| Automation Integration | All Segments | Reduces human error and increases testing speed. |
| Growth in Critical Industries | Vertical (Aerospace, Automotive) | Expands market potential due to high importance on product reliability |
Japan Electromagnetic NDT Market is projected to grow significantly, with a CAGR of 9.85% during the forecast period of 2026-2032. The market is expanding owing to the increasing need for security standards in industries such as oil & gas, power generation, and automotive. Along with that, the technological innovations in electromagnetic NDT testing equipment are enhancing the effectiveness of testing procedures, while government regulations around industrial safety are also expanding market’s growth.
Evaluation of Restraints in the Japan Electromagnetic NDT Market
Below mentioned are some major restraints and their influence on market dynamics:
| Restraints | Primary Segments Affected | What This Means |
| High Equipment Costs | All Segments | Limits market growth by reducing affordability, especially for small-scale industries. |
| Skilled Labor Shortages | All Segments | Creates delays in implementation of advanced NDT methods. |
| Market Competition | Method (Eddy Current, Remote Field, Magnetic Flux Leakage) | Reduces pricing power, resulting in lower profit margins for companies. |
| Regulatory Barriers | Vertical (Oil & Gas, Aerospace) | The rise in operational costs due to adherence and certification requirements. |
| Lack of Awareness | Vertical (Automotive, Aerospace) | Slows adoption of electromagnetic NDT in industries where traditional methods dominate |
Japan Electromagnetic NDT Market Challenges
The Japan Electromagnetic NDT Market faces challenges such as high equipment costs, limited skilled labor, and market competition which reduces pricing power and resultes in lower profit margins for companies. Also, strict regulatory requirements create barriers to entry, especially for smaller businesses. Additionally, the lack of awareness about the benefits of electromagnetic NDT methods is another factor restricting market’s adoption in certain sectors.
Japan Electromagnetic NDT Market Trends
Some major trends contributing to the Japan Electromagnetic NDT Market Growth are:
- Technological Advancements: Continuous investments are driving the creation of cutting-edge electromagnetic testing equipment, enhancing accuracy, speed, and operational efficiency in NDT processes.
- Rising Safety Standards: Governments and regulatory bodies are implementing stricter safety regulations, with an increase in the demand for reliable and precise electromagnetic testing methods to ensure adherence.
- Industry-Specific Demand: Industries such as aerospace, automotive, and power generation are placing emphasis on reliability and safety, thereby driving the demand for electromagnetic NDT.
Investment Opportunities in the Japan Electromagnetic NDT Market
Here are some investment opportunities in the Japan Electromagnetic NDT Industry:
- Training and Skill Development: Expanding of training programs and certification programs is significant to overcoming the shortage of skilled labor, expanding the adoption and proficiency of NDT techniques.
- R&D in NDT Technologies: The investments are huge in research and development to develop innovative NDT technologies that will improve the testing speed, accuracy and cost effectiveness.
- Automation and Robotics Integration: The combination of automation and robotics into NDT processes is optimizing testing efficiency, minimizing human error, and enhancing overall system reliability.
Top 5 Leading Players in the Japan Electromagnetic NDT Market
Here are some top companies contributing to Japan Electromagnetic NDT Market Share:
1. Olympus Corporation
| Company Name | Olympus Corporation |
|---|---|
| Established Year | 1919 |
| Headquarters | Tokyo, Japan |
| Official Website | Click Here |
Olympus is a leading player in the NDT market, specializing in electromagnetic testing equipment like Eddy Current and Remote Field-Testing systems. The company is known for its high-quality, innovative solutions that meet industry safety standards.
2. Fujifilm Holdings Corporation
| Company Name | Fujifilm Holdings Corporation |
|---|---|
| Established Year | 1934 |
| Headquarters | Tokyo, Japan |
| Official Website | Click Here |
Fujifilm manufactures a range of NDT systems, including magnetic flux leakage testing equipment. Their emphasis on providing accurate testing systems enhances their position as a key player in the Japanese NDT market.
3. GE Inspection Technologies
| Company Name | GE Inspection Technologies |
|---|---|
| Established Year | 1994 |
| Headquarters | Tokyo, Japan |
| Official Website | - |
GE Inspection Technologies is a global leader in NDT solutions, offering a variety of electromagnetic testing systems including Eddy Current and Magnetic Flux Leakage systems. They focus on industrial applications, especially in the aerospace and automotive sectors.
4. Testia Airbus Group
| Company Name | Testia (Airbus Group) |
|---|---|
| Established Year | 2004 |
| Headquarters | Toulouse, France (Japan branch) |
| Official Website | Click Here |
Testia provides advanced electromagnetic NDT solutions, particularly for the aerospace sector. Their high-precision testing equipment is designed to meet stringent safety and quality requirements in the aerospace industry.
5. MISTRAS Group Inc
| Company Name | MISTRAS Group, Inc. |
|---|---|
| Established Year | 1978 |
| Headquarters | Princeton, New Jersey, USA (Japan branch) |
| Official Website | Click Here |
MISTRAS Group provides a wide array of NDT services, including electromagnetic testing. Their focus on oil & gas, power generation, and aerospace industries has made them a major player in the Japanese market.
Government Regulations Introduced in the Japan Electromagnetic NDT Market
According to Japanese government data, it has launched regulations to play a critical role in the development of the Japan Electromagnetic NDT Market. The Japan Industrial Standards (JIS) ensures the quality and safety of NDT practices in various industries. Government policies also emphasize the adoption of electromagnetic testing methods in sectors like aerospace, oil & gas, and automotive to maintain high safety standards. Additionally, Japan’s Safety & Security of Critical Infrastructure initiative mandates NDT procedures for ensuring the safety and operational efficiency of critical infrastructure.
Future Insights of the Japan Electromagnetic NDT Market
The outcome of Japan Electromagnetic NDT Market is predicted to witness a significant growth in the coming years. Also, the rise in industrial safety concerns, government regulations, and technological innovations are fueling the adoption of electromagnetic testing techniques. Apart from that, the industries like automotive, aerospace, and power generation are mostly relying on NDT methods to ensure product quality and security. Government support for advanced testing technologies is expected to further boost market growth.
Market Segmentation Analysis
The report offers a comprehensive study of the subsequent market segments and their leading categories.
Eddy Current Testing to Dominate the Market – By Method
According to Kanak Phartiyal, Senior Research Analyst at 6Wresarch, eddy current testing (ECT) is the most widely used electromagnetic NDT method due to its versatility, sensitivity, and ability to detect surface and sub-surface defects in conductive materials. The technology's efficiency in testing several materials and thicknesses makes it the dominant method in the market.
Oil & Gas to Dominate the Market – By Vertical
The oil & gas industry dominates the market as it requires regular inspections and maintenance to ensure the safety and reliability of pipelines, storage tanks, and other infrastructure. Along with that, the electromagnetic NDT techniques like Eddy Current and Magnetic Flux Leakage Testing are extensively used to inspect corrosion and defects in pipelines.
Key attractiveness of the report
- 10 Years Market Numbers.
- Historical Data Starting from 2022 to 2025.
- Base Year: 2025
- Forecast Data until 2032.
- Key Performance Indicators Impacting the Market.
- Major Upcoming Developments and Projects.
Key Highlights of the Report:
- Japan Electromagnetic NDT Market Outlook
- Market Size of Japan Electromagnetic NDT Market, 2025
- Forecast of Japan Electromagnetic NDT Market, 2032
- Historical Data and Forecast of Japan Electromagnetic NDT Revenues & Volume for the Period 2022- 2032
- Japan Electromagnetic NDT Market Trend Evolution
- Japan Electromagnetic NDT Market Drivers and Challenges
- Japan Electromagnetic NDT Price Trends
- Japan Electromagnetic NDT Porter's Five Forces
- Japan Electromagnetic NDT Industry Life Cycle
- Historical Data and Forecast of Japan Electromagnetic NDT Market Revenues & Volume By Method for the Period 2022- 2032
- Historical Data and Forecast of Japan Electromagnetic NDT Market Revenues & Volume By Eddy Current Testing for the Period 2022- 2032
- Historical Data and Forecast of Japan Electromagnetic NDT Market Revenues & Volume By Remote Field Testing for the Period 2022- 2032
- Historical Data and Forecast of Japan Electromagnetic NDT Market Revenues & Volume By Magnetic Flux Leakage Testing for the Period 2022- 2032
- Historical Data and Forecast of Japan Electromagnetic NDT Market Revenues & Volume By Vertical for the Period 2022- 2032
- Historical Data and Forecast of Japan Electromagnetic NDT Market Revenues & Volume By Oil & Gas for the Period 2022- 2032
- Historical Data and Forecast of Japan Electromagnetic NDT Market Revenues & Volume By Power Generation for the Period 2022- 2032
- Historical Data and Forecast of Japan Electromagnetic NDT Market Revenues & Volume By Automotive for the Period 2022- 2032
- Historical Data and Forecast of Japan Electromagnetic NDT Market Revenues & Volume By Aerospace for the Period 2022- 2032
- Japan Electromagnetic NDT Import Export Trade Statistics
- Market Opportunity Assessment By Method
- Market Opportunity Assessment By Vertical
- Japan Electromagnetic NDT Top Companies Market Share
- Japan Electromagnetic NDT Competitive Benchmarking By Technical and Operational Parameters
- Japan Electromagnetic NDT Company Profiles
- Japan Electromagnetic NDT Key Strategic Recommendations
Market Covered
The report subsequently covers the market by following segments and subsegments.
By Method
- Eddy Current Testing
- Remote Field Testing
- Magnetic Flux Leakage Testing
By Vertical
- Oil & Gas
- Power Generation
- Automotive
- Aerospace
Japan Electromagnetic NDT Market (2026-2032): FAQs
The Japan Electromagnetic NDT Market is projected to grow at a CAGR of 9.85% during the forecast period (2026-2032)
The technological advancements in testing equipment and data analytics are leading the efficiency & accuracy of electromagnetic NDT methods.
The market is driven by government regulations, changes in NDT technologies, and the increasing demand for quality assurance across various industries.
The key challenges include high equipment costs, shortage of skilled labours, and intense competition from traditional testing methods.
6Wresearch actively monitors the Japan Electromagnetic NDT Market and publishes its comprehensive annual report, highlighting emerging trends, growth drivers, revenue analysis, and forecast outlook. Our insights help businesses to make data-backed strategic decisions with ongoing market dynamics. Our analysts track relevent industries related to the Japan Electromagnetic NDT Market, allowing our clients with actionable intelligence and reliable forecasts tailored to emerging regional needs.
Yes, we provide customisation as per your requirements. To learn more, feel free to contact us on sales@6wresearch.com
| 1 Executive Summary |
| 2 Introduction |
| 2.1 Key Highlights of the Report |
| 2.2 Report Description |
| 2.3 Market Scope & Segmentation |
| 2.4 Research Methodology |
| 2.5 Assumptions |
| 3 Japan Electromagnetic NDT Market Overview |
| 3.1 Japan Country Macro Economic Indicators |
| 3.2 Japan Electromagnetic NDT Market Revenues & Volume, 2022 & 2032F |
| 3.3 Japan Electromagnetic NDT Market - Industry Life Cycle |
| 3.4 Japan Electromagnetic NDT Market - Porter's Five Forces |
| 3.5 Japan Electromagnetic NDT Market Revenues & Volume Share, By Method, 2022 & 2032F |
| 3.6 Japan Electromagnetic NDT Market Revenues & Volume Share, By Vertical, 2022 & 2032F |
| 4 Japan Electromagnetic NDT Market Dynamics |
| 4.1 Impact Analysis |
| 4.2 Market Drivers |
| 4.2.1 Increasing demand for non-destructive testing technologies in various industries in Japan, such as automotive, aerospace, and electronics. |
| 4.2.2 Technological advancements in electromagnetic NDT methods leading to higher accuracy and efficiency. |
| 4.2.3 Stringent government regulations and quality standards promoting the adoption of electromagnetic NDT solutions. |
| 4.3 Market Restraints |
| 4.3.1 High initial investment costs associated with electromagnetic NDT equipment and training. |
| 4.3.2 Lack of skilled professionals proficient in operating and interpreting electromagnetic NDT systems in Japan. |
| 5 Japan Electromagnetic NDT Market Trends |
| 6 Japan Electromagnetic NDT Market, By Types |
| 6.1 Japan Electromagnetic NDT Market, By Method |
| 6.1.1 Overview and Analysis |
| 6.1.2 Japan Electromagnetic NDT Market Revenues & Volume, By Method, 2022 - 2032F |
| 6.1.3 Japan Electromagnetic NDT Market Revenues & Volume, By Eddy Current Testing, 2022 - 2032F |
| 6.1.4 Japan Electromagnetic NDT Market Revenues & Volume, By Remote Field Testing, 2022 - 2032F |
| 6.1.5 Japan Electromagnetic NDT Market Revenues & Volume, By Magnetic Flux Leakage Testing, 2022 - 2032F |
| 6.2 Japan Electromagnetic NDT Market, By Vertical |
| 6.2.1 Overview and Analysis |
| 6.2.2 Japan Electromagnetic NDT Market Revenues & Volume, By Oil & Gas, 2022 - 2032F |
| 6.2.3 Japan Electromagnetic NDT Market Revenues & Volume, By Power Generation, 2022 - 2032F |
| 6.2.4 Japan Electromagnetic NDT Market Revenues & Volume, By Automotive, 2022 - 2032F |
| 6.2.5 Japan Electromagnetic NDT Market Revenues & Volume, By Aerospace, 2022 - 2032F |
| 7 Japan Electromagnetic NDT Market Import-Export Trade Statistics |
| 7.1 Japan Electromagnetic NDT Market Export to Major Countries |
| 7.2 Japan Electromagnetic NDT Market Imports from Major Countries |
| 8 Japan Electromagnetic NDT Market Key Performance Indicators |
| 8.1 Adoption rate of electromagnetic NDT technologies in key industries in Japan. |
| 8.2 Rate of technological innovation and improvement in electromagnetic NDT equipment. |
| 8.3 Number of training programs and certifications offered for electromagnetic NDT professionals in Japan. |
| 8.4 Utilization rate of electromagnetic NDT equipment in different sectors in Japan. |
| 8.5 Compliance rate with industry-specific regulations and standards related to electromagnetic NDT in Japan. |
| 9 Japan Electromagnetic NDT Market - Opportunity Assessment |
| 9.1 Japan Electromagnetic NDT Market Opportunity Assessment, By Method, 2022 & 2032F |
| 9.2 Japan Electromagnetic NDT Market Opportunity Assessment, By Vertical, 2022 & 2032F |
| 10 Japan Electromagnetic NDT Market - Competitive Landscape |
| 10.1 Japan Electromagnetic NDT Market Revenue Share, By Companies, 2025 |
| 10.2 Japan Electromagnetic NDT Market Competitive Benchmarking, By Operating and Technical Parameters |
| 11 Company Profiles |
| 12 Recommendations |
| 13 Disclaimer |
Global Go To Market Strategy - 2030
Export potential enables firms to identify high-growth global markets with greater confidence by combining advanced trade intelligence with a structured quantitative methodology. The framework analyzes emerging demand trends and country-level import patterns while integrating macroeconomic and trade datasets such as GDP and population forecasts, bilateral import–export flows, tariff structures, elasticity differentials between developed and developing economies, geographic distance, and import demand projections. Using weighted trade values from 2020–2024 as the base period to project country-to-country export potential for 2030, these inputs are operationalized through calculated drivers such as gravity model parameters, tariff impact factors, and projected GDP per-capita growth. Through an analysis of hidden potentials, demand hotspots, and market conditions that are most favorable to success, this method enables firms to focus on target countries, maximize returns, and global expansion with data, backed by accuracy.
By factoring in the projected importer demand gap that is currently unmet and could be potential opportunity, it identifies the potential for the Exporter (Country) among 190 countries, against the general trade analysis, which identifies the biggest importer or exporter.
To discover high-growth global markets and optimize your business strategy:
Click Here
Pricing
- Single User License$ 1,995
- Department License$ 2,400
- Site License$ 3,120
- Global License$ 3,795

Leadership Perspectives from Industry Events
Search
Thought Leadership and Analyst Meet


Our Clients
6WResearch In News
- India Export Attractiveness Tracker 2026
- India Air Conditioner Market Set for Strong Rebound in 2026 After Weather-Led Correction and GST-Driven Recovery: 6Wresearch
- ADAS in India: How Automatic Emergency Braking, Blind Spot Detection & Driver Monitoring are Transforming Road Safety
- Doha a strategic location for EV manufacturing hub: IPA Qatar
- Demand for luxury TVs surging in the GCC, says Samsung
- Empowering Growth: The Thriving Journey of Bangladesh’s Cable Industry
Latest Reports
- Nicaragua RPG Gaming Market (2026-2032)
- New Zealand RPG Gaming Market (2026-2032)
- Netherlands RPG Gaming Market (2026-2032)
- Nauru RPG Gaming Market (2026-2032)
- Namibia RPG Gaming Market (2026-2032)
- Mozambique RPG Gaming Market (2026-2032)
- Montenegro RPG Gaming Market (2026-2032)
- Mongolia RPG Gaming Market (2026-2032)
- Monaco RPG Gaming Market (2026-2032)
- Micronesia RPG Gaming Market (2026-2032)
Industry Events and Analyst Meet

EV India Expo 2026

HIMTEX 2026

India Refining Summit 2026

India EV Show 2026

EV tech India Expo 2026
Whitepaper
- Middle East & Africa Commercial Security Market Click here to view more.
- Middle East & Africa Fire Safety Systems & Equipment Market Click here to view more.
- GCC Drone Market Click here to view more.
- Middle East Lighting Fixture Market Click here to view more.
- GCC Physical & Perimeter Security Market Click here to view more.