Japan Financial AR Market Size & Growth Rate
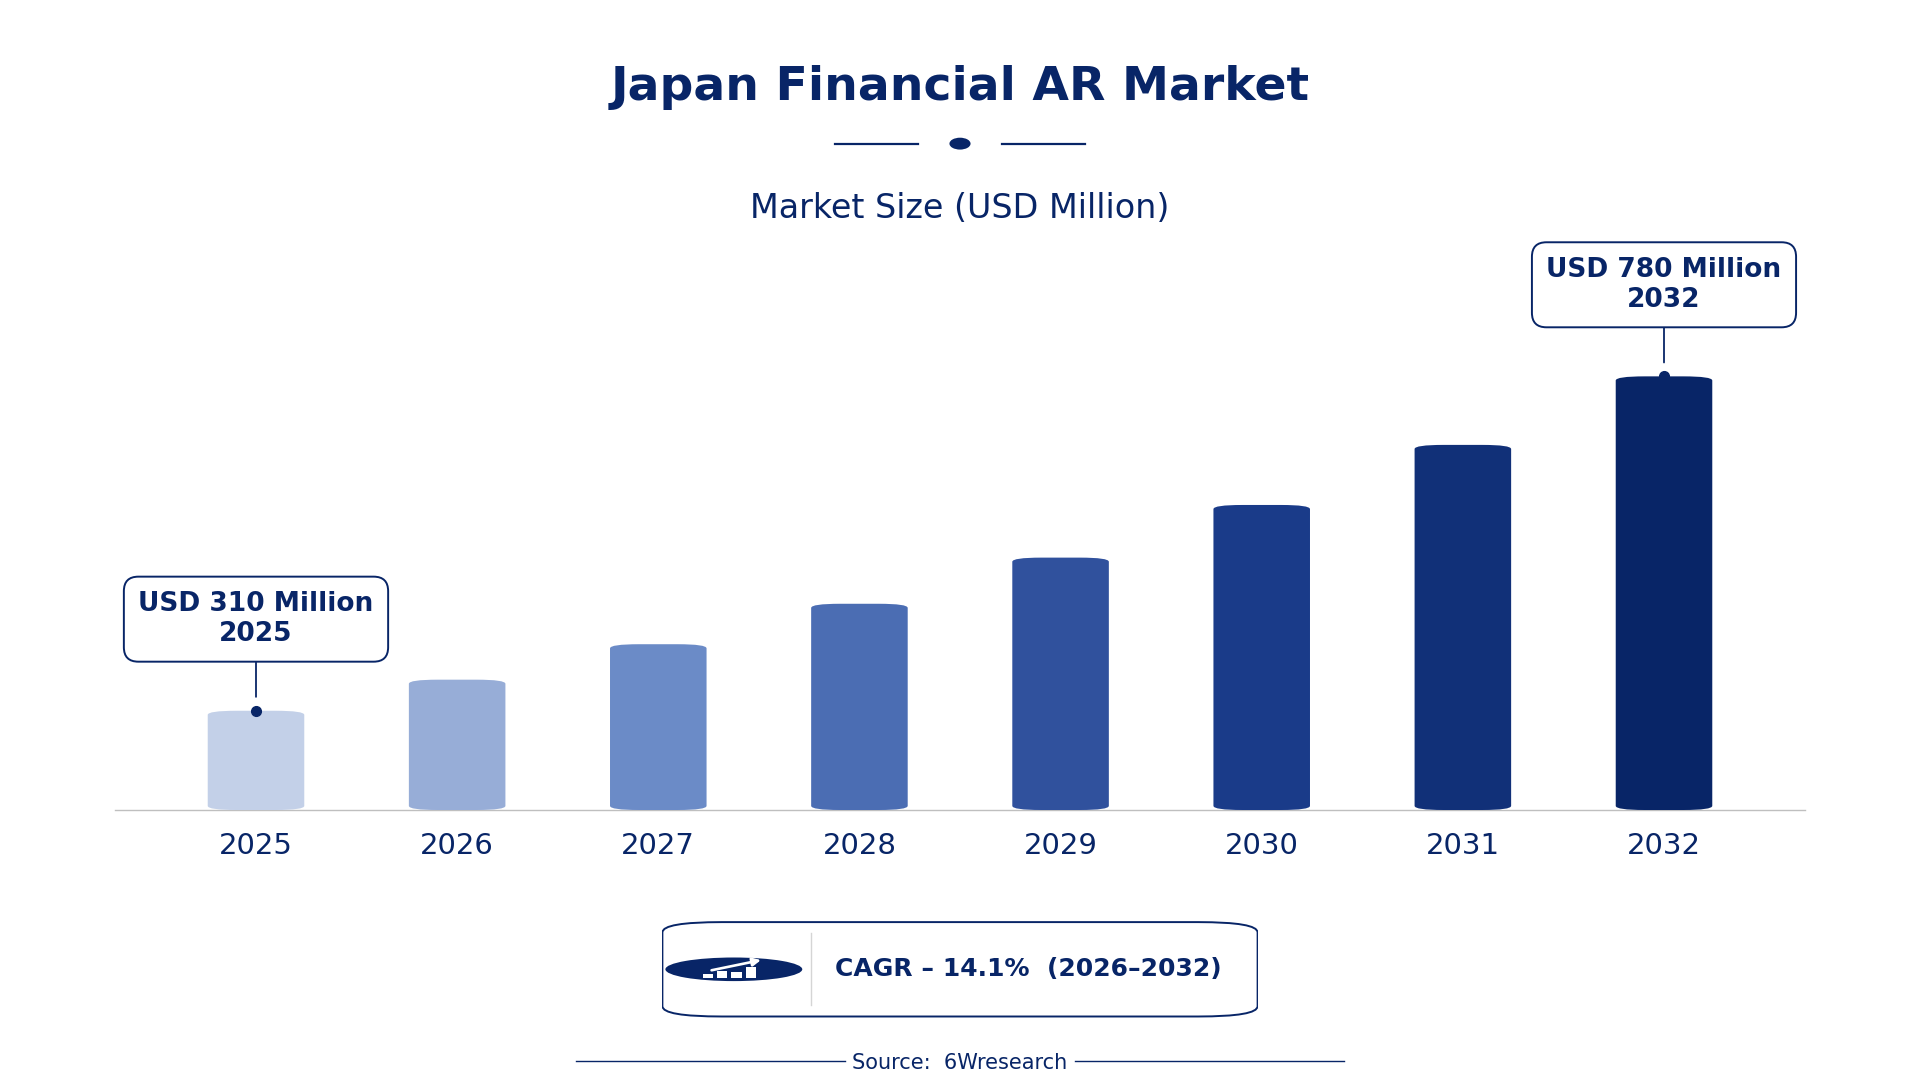
According to 6Wresearch internal database and industry insights, the Japan Financial AR Market was valued at USD 310 Million in 2025 and is projected to reach USD 780 Million by 2032, growing at a CAGR of approximately 14.1% during 2026–2032.
Japan Financial AR Market Highlights
| Report Metric | Details |
| Report Name | Japan Financial AR Market (2026-2032) |
| Market Size 2025 | USD 310 Million |
| Market Size 2032 | USD 780 Million |
| Absolute Growth 2025–2032 | USD 470 Million |
| CAGR 2026–2032 | 14.1% |
| Peak Annual Growth | 16.8% in 2026 |
| Forecast Period | 2026–2032 |
| Historical Data | 2022–2025 |
| Base Year | 2025 |
| Leading AR Type, 2025 | Virtual Banking (41% share) |
| Leading Application Area, 2025 | Mobile Interface (48% share) |
| Leading Distribution Channel, 2025 | App Stores (41% share) |
| Leading End User, 2025 | FinTech Users (39% share) |
| Fastest-Growing AR Type | Investment Education (18.9% CAGR) |
| Fastest-Growing Application Area | Interactive Guides (16.4% CAGR) |
| Fastest-Growing Distribution Channel | SaaS Providers (17.5% CAGR) |
| Fastest-Growing End User | Students and Advisors (17.7% CAGR) |
| Growing Sector | Fintech |
| Key End Users | FinTech Users, Financial Analysts, Tech-Savvy Customers, Students and Advisors |
Japan Financial AR Market Year-wise Growth Rate and Key Drivers (2022–2032)
This graph illustrates the annual growth rates of the market from 2022 to 2032, highlighting a steady upward trajectory and projected market expansion over the forecast period.
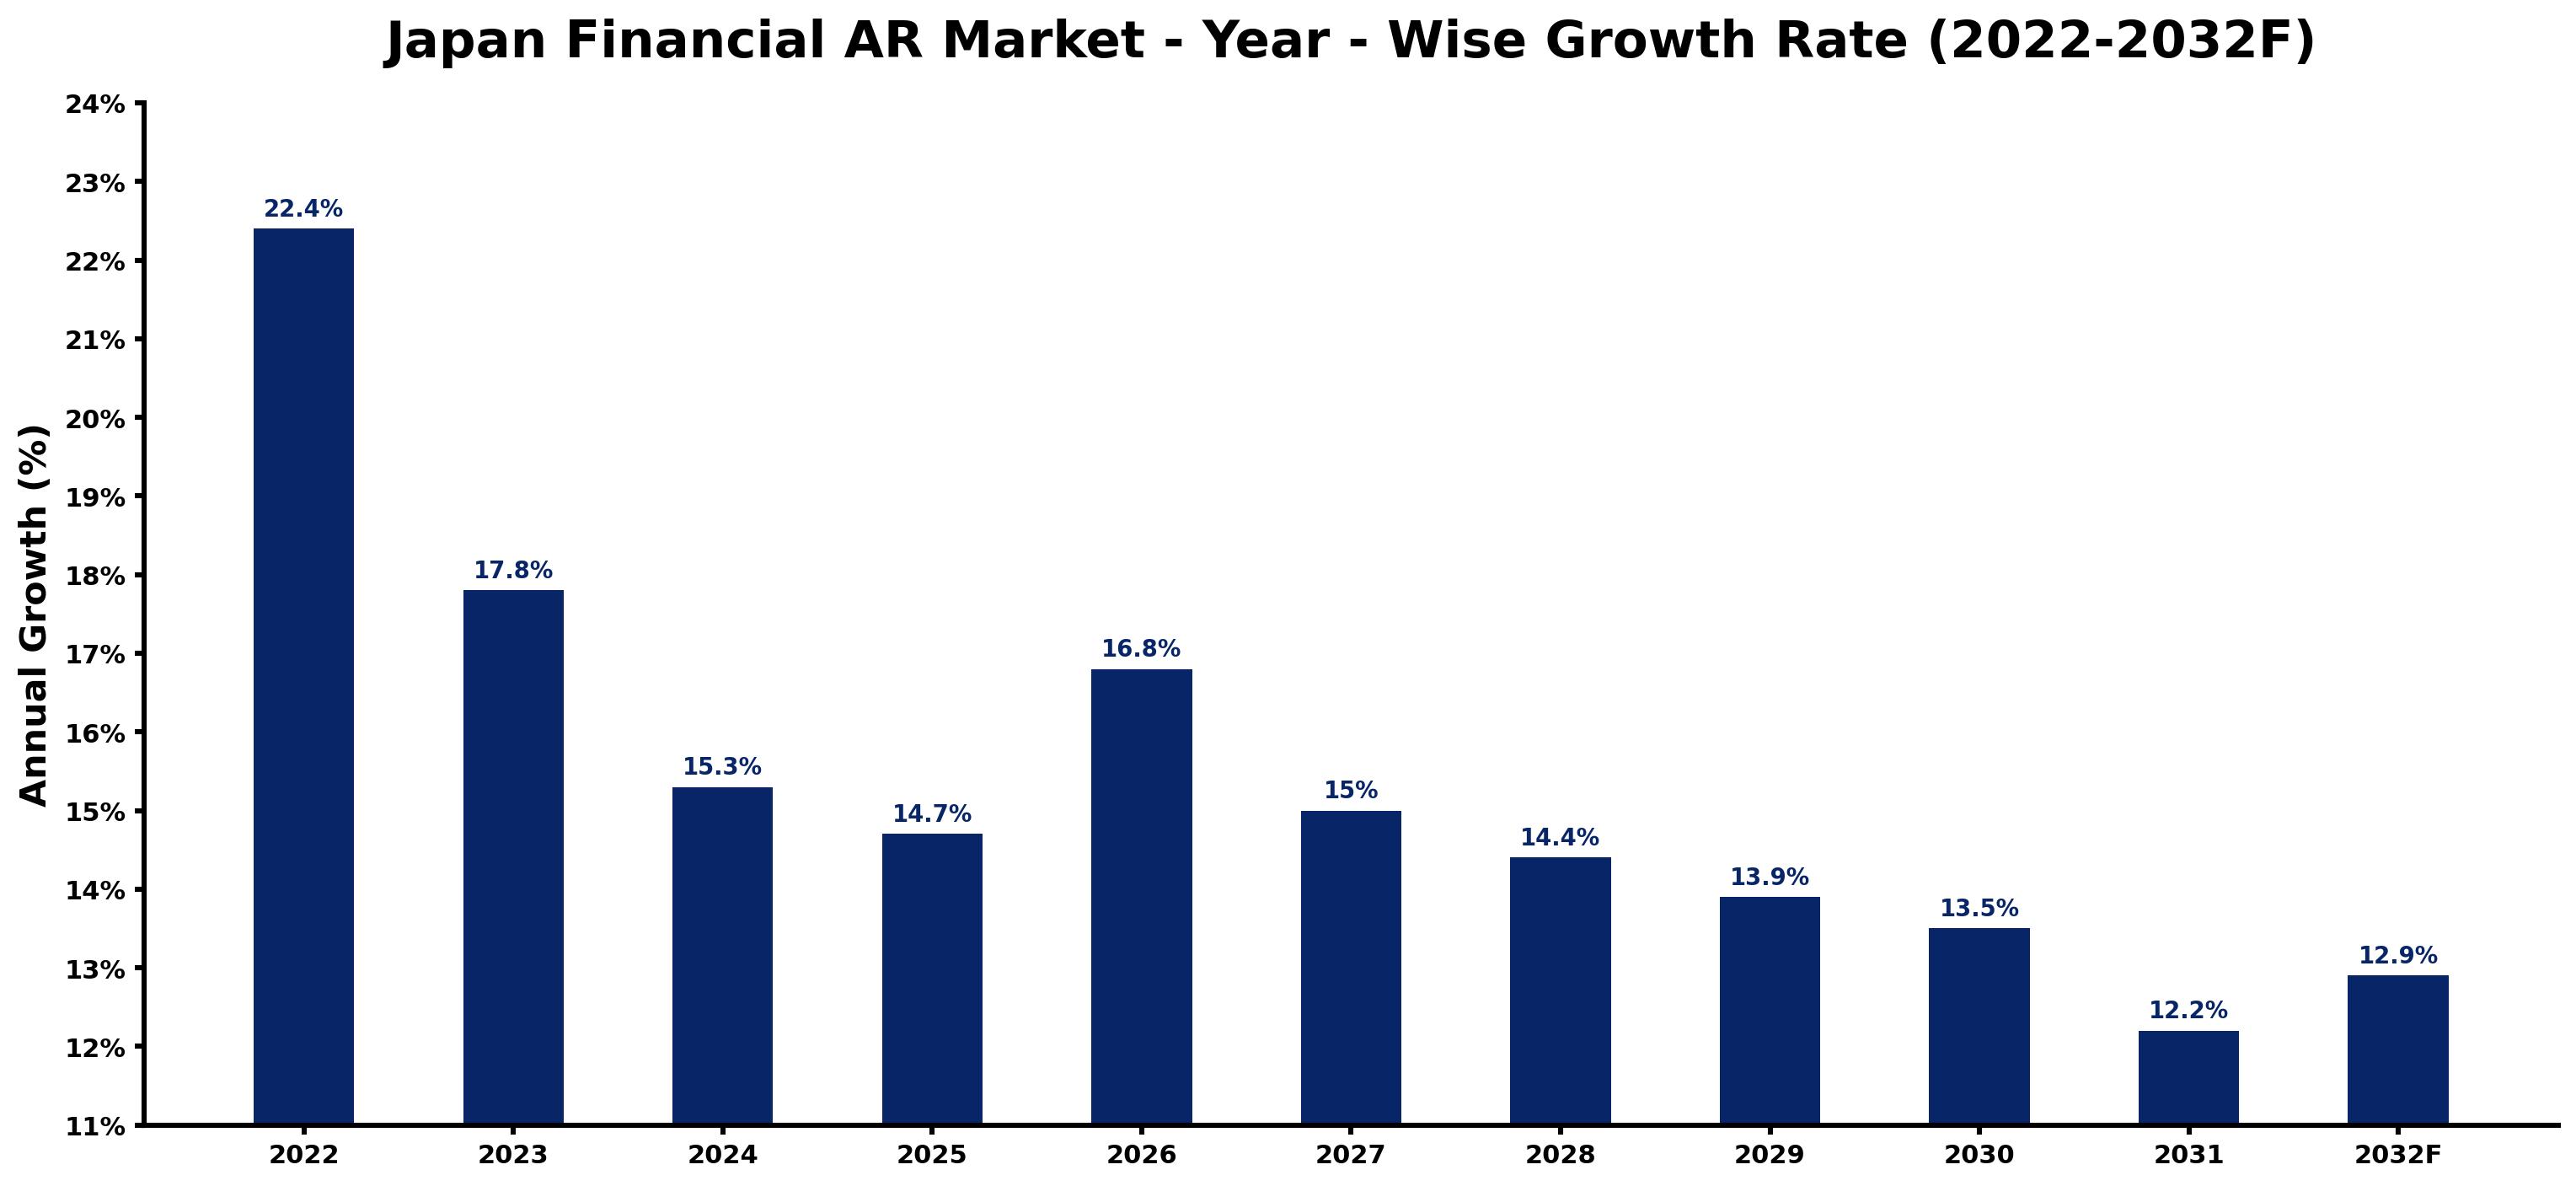
The following figures match every annual growth estimate with the main market development of that year, giving the reasoning behind each rise or slowdown.
| Year | Estimated Annual Growth (%) | Market Rationale |
| 2022 | 22.4 | The market experienced growth due to increased adoption of AR technologies in finance. |
| 2023 | 17.8 | Growth slowed as the market adjusted to previous high levels of investment and innovation. |
| 2024 | 15.3 | The market continued to grow, driven by ongoing interest in fintech solutions and AR applications. |
| 2025 | 14.7 | Growth moderated as the market matured, reflecting a normalisation after rapid expansion. |
| 2026 | 16.8 | Demand is expected to surge again, supported by the introduction of new AR features in mobile banking apps. |
| 2027 | 15.0 | Growth will slow slightly as the market stabilises after reaching new heights in previous years. |
| 2028 | 14.4 | The market is projected to maintain steady growth, driven by ongoing consumer interest in AR financial tools. |
| 2029 | 13.9 | Growth is expected to continue slowing, reflecting a more competitive environment in financial services. |
| 2030 | 13.5 | The market will see further moderation as saturation in certain segments becomes evident. |
| 2031 | 12.2 | Growth is projected to slow as the market approaches maturity, with established players dominating. |
| 2032 | 12.9 | Demand is expected to rise again as new educational tools are introduced in financial services. |
Note: Market size estimations and growth projections presented in this report are based on 6Wresearch's proprietary forecasting methodology, utilizing the latest available industry data, government publications, and primary research inputs.
Japan Financial AR Market Synopsis
Financial Augmented Reality (AR) integrates advanced technologies to improve financial services, engaging users in mobile banking and facilitating stock visualization. The Japan Financial AR Market is expanding due to rising demand from fintech users, with investment education programs increasing by 30% since 2022. The Tokyo Stock Exchange's introduction of AR visualization tools and the government's ¥2 billion budget for fintech innovation further stimulate market growth, indicating a strong future for AR in finance.
Market Dynamics Impact Analysis (2026–2032)
| Factor | Type | Impact | Primary Segment Affected |
| Increasing adoption of AR technology in mobile banking applications | Driver | High | Mobile Interface |
| Growing interest in interactive investment education tools | Driver | High | Investment Education |
| Expansion of fintech startups seeking AR solutions | Opportunity | High | FinTech Users |
| Rising demand for AR stock visualization tools in major financial institutions | Opportunity | Medium | AR Stock Visualization |
| Limited awareness among traditional financial institutions about AR benefits | Restraint | Medium | Virtual Banking |
| High development costs associated with AR technology integration | Restraint | High | Budgeting Interfaces |
| Competition from alternative financial technologies | Challenge | High | Trading Platforms |
| Regulatory hurdles in AR technology implementation | Challenge | Medium | Consumer Finance |
Evaluation of Drivers in Japan Financial AR Market (2026–2032)
The following drivers explain most of the expected growth.
| Drivers | Primary Segment Affected | Why It Matters (Evidence) |
| Increased mobile banking app downloads | Mobile Interface | Mobile banking apps with AR features saw a 40% increase in downloads in 2023, driving demand for improved user experiences. |
| Growth in fintech investment education programs | Investment Education | Investment education programs increased by 30% since 2022, resulting in higher demand for interactive learning tools. |
| Support from government initiatives for AR integration | AR Stock Visualization | The Ministry of Economy, Trade and Industry supports AR technology adoption, encouraging financial institutions to invest in visualization tools. |
| Rising number of fintech startups | FinTech Users | The total number of fintech startups in Japan reached 1,200 in 2023, increasing the demand for new AR solutions. |
| Development of AR-enhanced budgeting tools | Budgeting Interfaces | AR-based budgeting tools are integrated into 50% of new banking apps, improving user engagement and financial management. |
Buyers are adding capacity as the number of fintech startups in Japan reached 1,200 in 2023, increasing demand for new AR solutions. Mobile banking apps with AR features experienced a 40% increase in downloads in 2023, improving user experiences. AR-based budgeting tools are now integrated into half of new banking apps, enhancing user engagement in financial management.
Evaluation of Restraints in Japan Financial AR Market
Several factors work against faster growth; the main ones are summarised below.
| Market Restraint | Primary Segment Affected | Why It Matters (Evidence) |
| Limited awareness among traditional financial institutions about AR benefits | Virtual Banking | Many traditional institutions remain unaware of AR's potential, slowing adoption rates and limiting market growth. |
| High development costs associated with AR technology integration | Budgeting Interfaces | The financial burden of integrating AR technology can deter smaller institutions from adopting these tools. |
| Regulatory hurdles in AR technology implementation | Consumer Finance | Regulatory challenges can slow down the implementation of AR solutions in consumer finance applications. |
| Competition from alternative financial technologies | Trading Platforms | The rise of alternative technologies can divert investment away from AR solutions in trading platforms. |
| Skepticism about AR effectiveness among some users | Investment Education | Some users are hesitant to adopt AR tools due to doubts about their effectiveness in enhancing learning. |
Japan Financial AR Market Challenges
High marketing costs for new fintech startups in Japan reach up to ¥500 million, making it challenging for them to gain market entry in a competitive environment. A shortage of skilled AR developers delays project timelines, causing product launches to be pushed back by an average of six months, which frustrates producers and limits their market opportunities. Difficulties in sourcing advanced AR software can inflate production costs by 20%, impacting producers' ability to deliver timely solutions to clients. Regulatory requirements from the Financial Services Agency increase operational costs by approximately 15%, hindering innovation for many firms.
Trends in the Japan Financial AR Market
Buyers and suppliers in the Japan Financial AR Market are adjusting to the following trends.
- Shift towards Interactive Investment Education: The trend towards interactive investment education tools began in 2022, with programs increasing by 30%. Educational platforms targeting high school students are improving engagement and understanding of financial concepts.
- Transition from Traditional Banking to Mobile AR Solutions: In 2023, mobile banking apps began incorporating AR features, resulting in a 40% increase in downloads. This trend reflects the growing preference for digital solutions among younger consumers in urban areas.
- Emergence of AR Stock Visualization Tools: Since 2023, AR stock visualization tools have been tested in five major financial institutions in Tokyo. This development allows investors to interactively engage with real-time data, improving decision-making processes.
- Prioritisation of User Engagement in Financial Apps: The focus on user engagement in financial applications has intensified, with AR-based budgeting tools integrated into half of new banking apps. This trend aims to attract younger users seeking interactive financial management.
Investment Opportunities in the Japan Financial AR Market
Several openings in the Japan Financial AR Market merit attention from investors.
- Local Partnerships for AR Development: Partnering with local fintech startups presents an opportunity to develop tailored AR solutions, especially as the total number of startups reached 1,200 in 2023. This collaboration can improve product offerings and market reach.
- Investment in Educational AR Tools: The increasing demand for interactive investment education tools creates opportunities for suppliers to develop AR solutions. Educational institutions are actively seeking these tools to improve learning experiences for students.
- Approval Pathways for AR Integration: Navigating approval pathways for AR solutions in financial services is essential, especially with the support of the Japan Fintech Association. This can facilitate smoother market entry for new technologies.
- Expansion in Tokyo's Fintech Hub: Tokyo's status as a leading fintech hub offers opportunities for AR technology suppliers. The government's ¥2 billion budget for fintech innovation in 2023 supports the development of new AR applications.
Government Initiatives in the Japan Financial AR Market
The Financial Services Agency of Japan has established guidelines for fintech development, ensuring that AR solutions meet regulatory standards. These guidelines promote the safe integration of AR technologies in financial services, benefiting both producers and consumers. The government allocated ¥2 billion for fintech innovation in 2023, supporting AR technology integration in financial services.
The Digital Agency oversees government digital transformation efforts, approving funding for projects that improve financial services through technology. This agency's support encourages the development of AR applications, fostering innovation in the financial sector.
Future Insight of the Japan Financial AR Market
AR-enabled budgeting tools will be integrated into 50% of new banking apps by 2032, improving user engagement and financial literacy. Investment education programs will expand, increasing user engagement in financial services by 25%. The adoption of ISO 20022 standards will facilitate smoother financial data exchange, enhancing the functionality of AR applications. By 2025, AR-enabled trading platforms are expected to attract a broader audience to financial services, benefiting both buyers and suppliers.
Market Segmentation Analysis
Japan Financial AR Market report covers a detailed analysis of the following market segments:
By AR Type – Virtual Banking Leads, Investment Education Expected to Grow Fastest
According to Saurav Kr Singh, Senior Research Analyst at 6Wresearch, Virtual Banking took 41% of ar type revenue in 2025, more than any other category. Virtual Banking holds the largest share as it directly enhances user experience in banking applications, which is essential for attracting and retaining customers. The increase in mobile banking app downloads, which surged by 40% in 2023, demonstrates the strong demand for this segment. Investment Education is projected to grow fastest, at a CAGR of 18.9% during 2026–2032. Investment Education is growing rapidly as it provides interactive learning tools for investors, particularly appealing to younger audiences eager to improve their financial knowledge. The 30% rise in investment education programs since 2022 reflects the increasing emphasis on financial literacy among this demographic. Suppliers should focus on developing AR solutions that prioritise educational tools to capitalise on the expanding market for financial literacy.
By Application Area – Mobile Interface Leads, Interactive Guides Expected to Grow Fastest
Mobile Interface held 48% of the Japan Financial AR Market by application area in 2025. Mobile Interface leads the market by integrating AR features into mobile banking apps, significantly enhancing user functionalities and engagement. The notable rise in app downloads indicates a strong consumer preference for improved financial services through mobile platforms. The quickest growth will come from Interactive Guides, forecast to expand at a CAGR of 16.4% between 2026 and 2032. Interactive Guides are experiencing rapid growth as they provide step-by-step assistance in financial processes, appealing to users who seek clarity in their financial decisions. The increase in user engagement on investment education platforms supports this trend. Suppliers should prioritise the creation of interactive guide solutions to meet the rising demand for accessible financial tools.
By Distribution Channel – App Stores Lead, SaaS Providers Expected to Grow Fastest
In 2025, App Stores led the distribution channel split with a 41% share. App Stores are the primary distribution channel, facilitating the widespread availability of financial AR applications and ensuring broad user access. The growing number of fintech startups in Japan enhances the diversity of applications available through these platforms. SaaS Providers are set to record the highest CAGR in this split, 17.5% over 2026–2032. SaaS Providers are rapidly expanding by offering AR solutions as a service to businesses, simplifying the integration of AR technology into existing systems. The surge in fintech startups in Japan drives the demand for these services. This suggests that suppliers should explore partnerships with SaaS providers to expand their market reach and enhance service offerings.
By End User – FinTech Users Lead, Students and Advisors Expected to Grow Fastest
The largest end user category in 2025 was FinTech Users, at 39% of revenue. FinTech Users represent the largest segment as they are the main consumers of financial AR technology, utilising it for various banking and investment activities. The robust growth of fintech startups in Japan indicates a strong and expanding user base for these technologies. Over 2026–2032, Students and Advisors are expected to post the fastest growth, at a CAGR of 17.7%. Students and Advisors are the fastest-growing group, using AR for educational purposes in finance, reflecting an increasing focus on financial literacy among younger demographics. The development of interactive financial guides for high school students supports this trend. This indicates a need for suppliers to create targeted AR solutions specifically designed for educational institutions and younger users.
Key Attractiveness of the Report
- 10 Years of Market Numbers
- Historical Data Starting from 2022 to 2025
- Base Year 2025
- Forecast Data until 2032
- Key Performance Indicators Impacting the Market
- Major Upcoming Developments and Projects
Key Highlights of the Report:
- Japan Financial AR Market Outlook
- Market Size of Japan Financial AR Market, 2025
- Forecast of Japan Financial AR Market, 2032
- Historical Data and Forecast of Japan Financial AR Revenues & Volume for the Period 2022-2032F
- Japan Financial AR Market Trend Evolution
- Japan Financial AR Market Drivers and Challenges
- Japan Financial AR Price Trends
- Japan Financial AR Porter's Five Forces
- Japan Financial AR Industry Life Cycle
- Historical Data and Forecast of Japan Financial AR Market Revenues & Volume By AR Type for the Period 2022-2032F
- Historical Data and Forecast of Japan Financial AR Market Revenues & Volume By Virtual Banking for the Period 2022-2032F
- Historical Data and Forecast of Japan Financial AR Market Revenues & Volume By AR Stock Visualization for the Period 2022-2032F
- Historical Data and Forecast of Japan Financial AR Market Revenues & Volume By Budgeting Interfaces for the Period 2022-2032F
- Historical Data and Forecast of Japan Financial AR Market Revenues & Volume By Investment Education for the Period 2022-2032F
- Historical Data and Forecast of Japan Financial AR Market Revenues & Volume By Application Area for the Period 2022-2032F
- Historical Data and Forecast of Japan Financial AR Market Revenues & Volume By Mobile Interface for the Period 2022-2032F
- Historical Data and Forecast of Japan Financial AR Market Revenues & Volume By Trading Platforms for the Period 2022-2032F
- Historical Data and Forecast of Japan Financial AR Market Revenues & Volume By Consumer Finance for the Period 2022-2032F
- Historical Data and Forecast of Japan Financial AR Market Revenues & Volume By Interactive Guides for the Period 2022-2032F
- Historical Data and Forecast of Japan Financial AR Market Revenues & Volume By Distribution Channel for the Period 2022-2032F
- Historical Data and Forecast of Japan Financial AR Market Revenues & Volume By App Stores for the Period 2022-2032F
- Historical Data and Forecast of Japan Financial AR Market Revenues & Volume By SaaS Providers for the Period 2022-2032F
- Historical Data and Forecast of Japan Financial AR Market Revenues & Volume By AR Device Channels for the Period 2022-2032F
- Historical Data and Forecast of Japan Financial AR Market Revenues & Volume By e-Learning Platforms for the Period 2022-2032F
- Historical Data and Forecast of Japan Financial AR Market Revenues & Volume By End User for the Period 2022-2032F
- Historical Data and Forecast of Japan Financial AR Market Revenues & Volume By FinTech Users for the Period 2022-2032F
- Historical Data and Forecast of Japan Financial AR Market Revenues & Volume By Financial Analysts for the Period 2022-2032F
- Historical Data and Forecast of Japan Financial AR Market Revenues & Volume By Tech-Savvy Customers for the Period 2022-2032F
- Historical Data and Forecast of Japan Financial AR Market Revenues & Volume By Students and Advisors for the Period 2022-2032F
- Japan Financial AR Import Export Trade Statistics
- Market Opportunity Assessment By AR Type
- Market Opportunity Assessment By Application Area
- Market Opportunity Assessment By Distribution Channel
- Market Opportunity Assessment By End User
- Japan Financial AR Top Companies Market Share
- Japan Financial AR Competitive Benchmarking By Technical and Operational Parameters
- Japan Financial AR Company Profiles
- Japan Financial AR Key Strategic Recommendations
Market Covered
The study includes the following segmentation.
By AR Type
- Virtual Banking
- AR Stock Visualization
- Budgeting Interfaces
- Investment Education
By Application Area
- Mobile Interface
- Trading Platforms
- Consumer Finance
- Interactive Guides
By Distribution Channel
- App Stores
- SaaS Providers
- AR Device Channels
- e-Learning Platforms
By End User
- FinTech Users
- Financial Analysts
- Tech-Savvy Customers
- Students and Advisors