Japan Home Theater Connectivity Market Size & Growth Rate
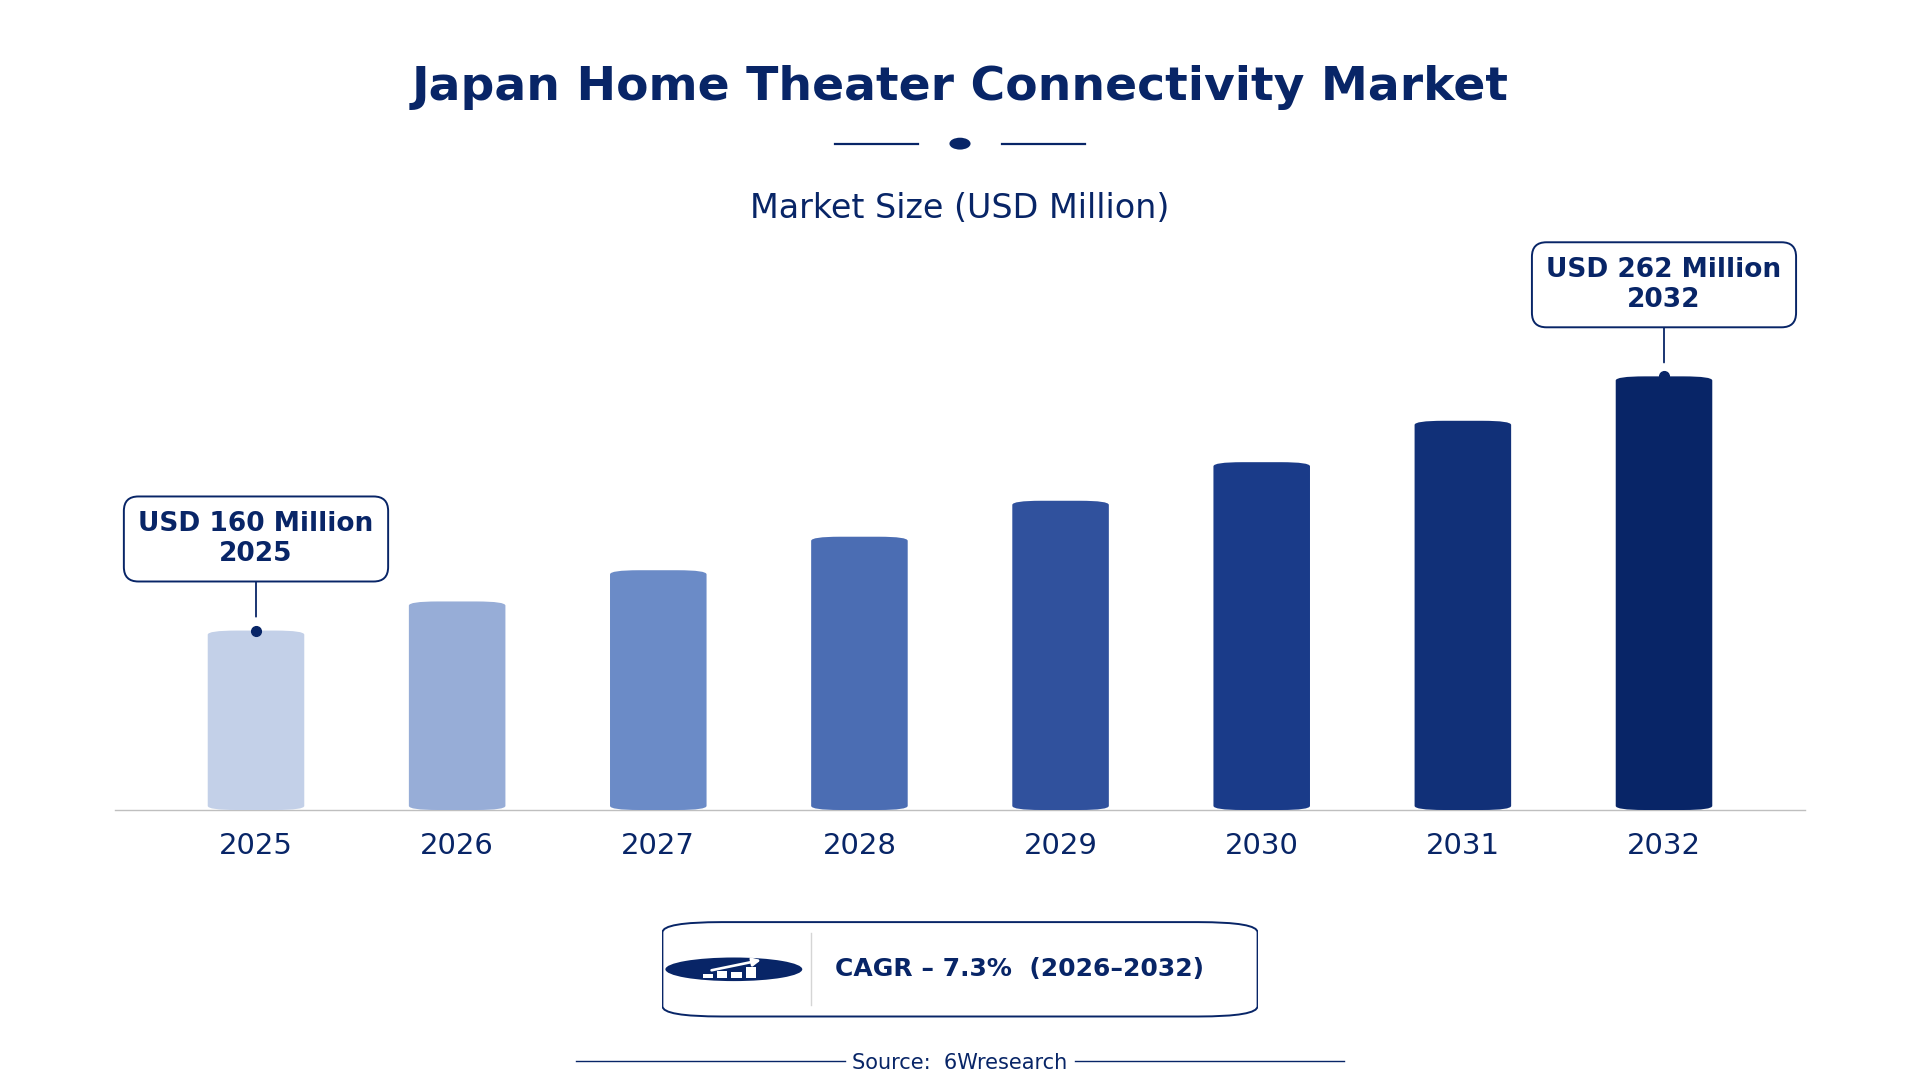
According to 6Wresearch internal database and industry insights, the Japan Home Theater Connectivity Market was valued at USD 160 Million in 2025 and is projected to reach USD 262 Million by 2032, growing at a CAGR of approximately 7.3% during 2026–2032.
Japan Home Theater Connectivity Market Highlights
| Report Metric | Details |
| Report Name | Japan Home Theater Connectivity Market (2026-2032) |
| Market Size 2025 | USD 160 Million |
| Market Size 2032 | USD 262 Million |
| Absolute Growth 2025–2032 | USD 102 Million |
| CAGR 2026–2032 | 7.3% |
| Peak Annual Growth | 8.0% in 2032 |
| Forecast Period | 2026–2032 |
| Historical Data | 2022–2025 |
| Base Year | 2025 |
| Leading Product Type, 2025 | Audio Receivers (42% share) |
| Leading Connectivity Type, 2025 | Wired (43% share) |
| Leading Distribution Channel, 2025 | Online Retailers (41% share) |
| Leading End User, 2025 | Homeowners (44% share) |
| Fastest-Growing Product Type | Bluetooth Transmitters (10.1% CAGR) |
| Fastest-Growing Connectivity Type | Wireless (10.4% CAGR) |
| Fastest-Growing End User | Smart TV Users (9.6% CAGR) |
| Growing Sector | home entertainment |
| Key End Users | Homeowners, Smart TV Users, Audiophiles, Movie Buffs |
Japan Home Theater Connectivity Market Year-wise Growth Rate and Key Drivers (2022–2032)
This graph illustrates the annual growth rates of the market from 2022 to 2032, highlighting a steady upward trajectory and projected market expansion over the forecast period.
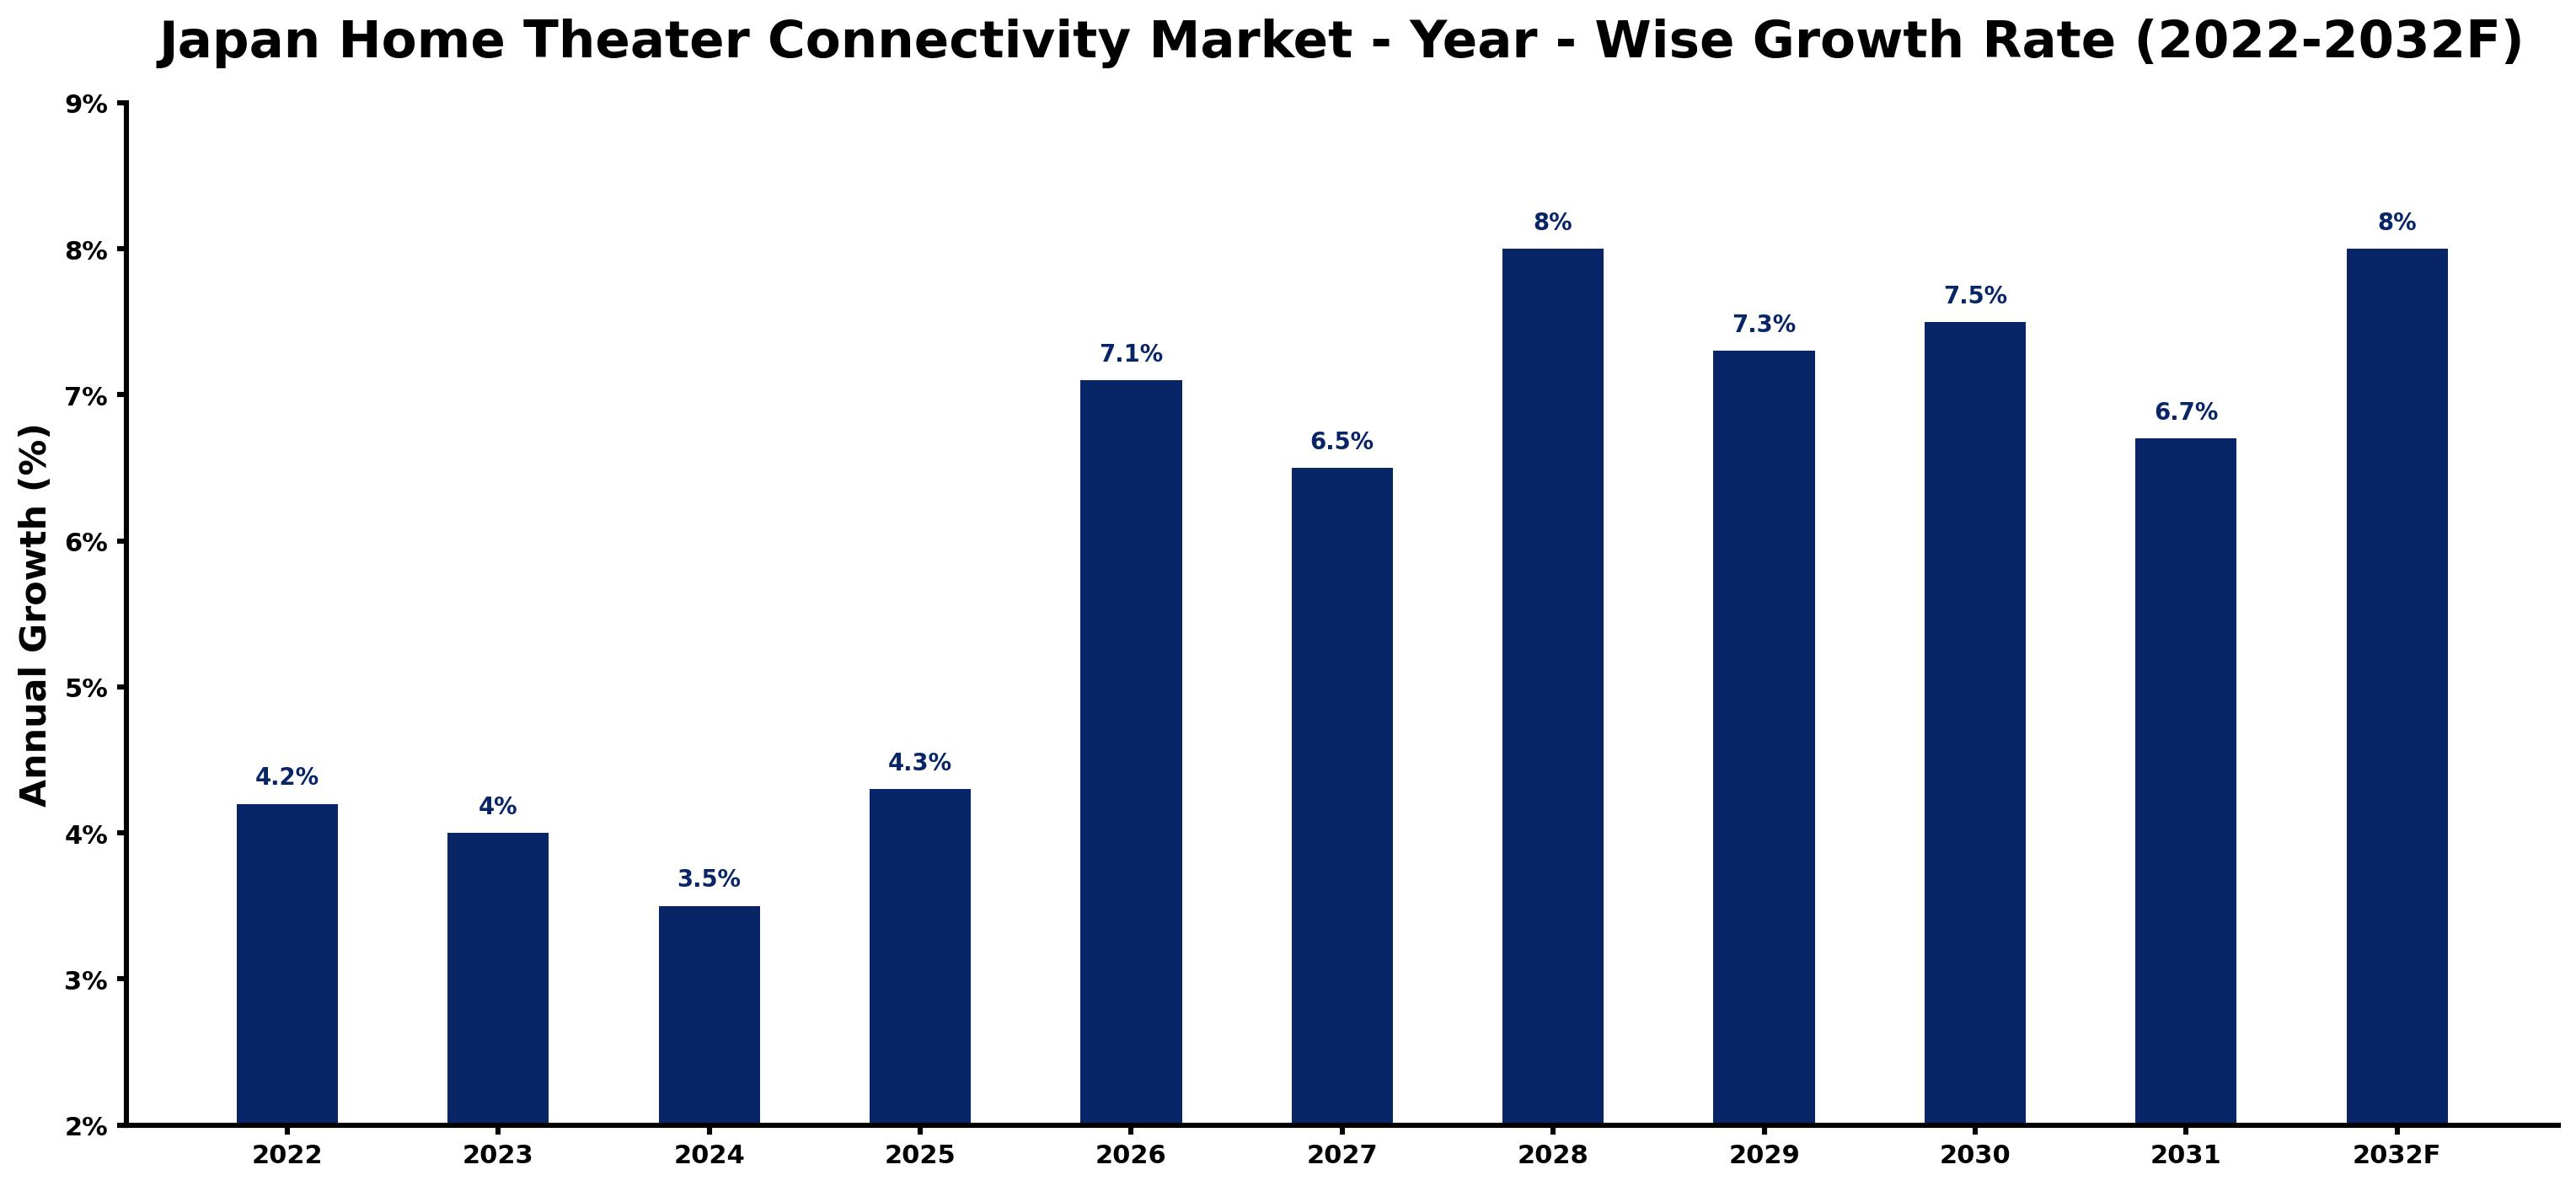
The yearly estimates that follow link every growth rate to its principal driver, so readers can see why the pace changed in each period.
| Year | Estimated Annual Growth (%) | Market Rationale |
| 2022 | 4.2 | The market showed stable growth due to consistent consumer interest in home entertainment systems. |
| 2023 | 4.0 | Growth slowed as consumers faced economic uncertainty affecting discretionary spending on electronics. |
| 2024 | 3.5 | Market growth continued to slow as competition increased among home theater product offerings. |
| 2025 | 4.3 | Demand rose as households upgraded to modern home theater systems for improved experiences. |
| 2026 | 7.1 | Investment in smart home technology is expected to spur increased purchases of connectivity devices. |
| 2027 | 6.5 | Growth is projected to slow as the market adjusts to the saturation of certain product types. |
| 2028 | 8.0 | A surge in wireless technology adoption will drive demand for connectivity solutions. |
| 2029 | 7.3 | Market growth is expected to slow as consumers become more selective with their home entertainment investments. |
| 2030 | 7.5 | Demand is projected to increase as new smart home integrations become more mainstream among users. |
| 2031 | 6.7 | Growth is expected to slow as competition intensifies among various connectivity product segments. |
| 2032 | 8.0 | The market is projected to peak as consumers embrace advanced connectivity options for home entertainment. |
Note: Market size estimations and growth projections presented in this report are based on 6Wresearch's proprietary forecasting methodology, utilizing the latest available industry data, government publications, and primary research inputs.
Japan Home Theater Connectivity Market Synopsis
Home Theater Connectivity encompasses technologies that transmit audio and video signals between home entertainment components, enhancing user experiences. In Japan, approximately 50 million households have home entertainment systems, with the Tokyo region accounting for 30% of sales. The Japan Home Theater Connectivity Market is growing due to rising smart home technology adoption, increased consumer spending on home entertainment, and a shift towards wireless solutions. The average household expenditure on home entertainment systems is around 150,000 JPY annually, reflecting strong demand from homeowners and audiophiles.
Market Dynamics Impact Analysis (2026–2032)
| Factor | Type | Impact | Primary Segment Affected |
| Rising demand for smart home technology | Driver | High | Wireless |
| Increased household expenditure on home entertainment systems | Driver | High | Audio Receivers |
| Growing interest in wireless audio solutions | Opportunity | High | Bluetooth Transmitters |
| Expansion of online retail channels for home theater products | Opportunity | High | Online Retailers |
| Intense competition among product offerings | Restraint | Medium | HDMI Splitters |
| Economic fluctuations affecting consumer spending | Restraint | Medium | Media Streaming Hubs |
| Challenges in meeting safety regulations | Challenge | High | Audio Receivers |
| Supply chain disruptions impacting product availability | Challenge | Medium | Bluetooth Transmitters |
Evaluation of Drivers in Japan Home Theater Connectivity Market (2026–2032)
Demand rests on the following drivers, each shown with the segment it touches most.
| Drivers | Primary Segment Affected | Why It Matters (Evidence) |
| Increased investment in smart home technology | Wireless | The government aims to increase smart home technology adoption by 25% by 2025, driving demand for wireless connectivity products. |
| Higher household expenditure on home entertainment systems | Audio Receivers | The average household spends around 150,000 JPY annually on home entertainment, boosting demand for audio receivers. |
| Rising popularity of Bluetooth audio devices | Bluetooth Transmitters | Bluetooth audio devices accounted for 40% of audio equipment sales in 2023, increasing demand for transmitters. |
| Growth of online retail channels | Online Retailers | Online retailers captured 41% of the distribution channel share in 2025, enhancing accessibility for consumers. |
| Increased streaming service subscriptions | HDMI Splitters | The demand for HDMI splitters increased by 15% due to rising subscriptions, driving purchases. |
The popularity of audio devices surged, accounting for 40% of audio equipment sales in 2023, which drives demand for Bluetooth transmitters. The growth of online retail channels, capturing 41% of the market share in 2025, increases accessibility for consumers seeking home theater products. Rising streaming service subscriptions further boost the demand for HDMI splitters, essential for connecting multiple devices.
Evaluation of Restraints in Japan Home Theater Connectivity Market
The main factors holding the market back are set out below.
| Market Restraint | Primary Segment Affected | Why It Matters (Evidence) |
| Intense competition among various product offerings | HDMI Splitters | The competitive environment limits pricing flexibility, impacting profit margins for suppliers. |
| Economic fluctuations affecting consumer spending | Media Streaming Hubs | Economic uncertainty leads consumers to prioritize essential purchases over luxury home entertainment systems. |
| Challenges in meeting safety regulations | Audio Receivers | Producers face increased operational costs due to compliance with the Electrical Appliance and Material Safety Act. |
| Supply chain disruptions impacting product availability | Bluetooth Transmitters | Global supply chain issues delay product delivery, affecting market responsiveness and sales. |
| Market saturation in certain product categories | Media Streaming Hubs | An oversupply of similar products leads to reduced consumer interest and slower sales growth. |
Japan Home Theater Connectivity Market Challenges
Japan's declining population limits the pool of potential buyers for home theater systems, causing producers to struggle with sales. With 29.3% of the population aged 65 or older, younger consumers are less engaged, which restricts market growth for suppliers. Rapid technological advancements require substantial investments in R&D, costing suppliers millions each year to keep pace with evolving standards. Increased competition from streaming services pressures producers to lower prices, risking profit margins and potentially forcing many manufacturers to adopt unsustainable pricing strategies.
Trends in the Japan Home Theater Connectivity Market
Below are the shifts with the largest effect on the Japan Home Theater Connectivity Market.
- Transition to Wireless Connectivity: The shift towards wireless connectivity is accelerating as consumers prefer Bluetooth and Wi-Fi enabled devices. In 2023, wireless connectivity products are projected to dominate the market by 2025, reflecting a growing preference for convenience.
- Integration of Smart Home Systems: The adoption of smart home systems is increasing, with 60% of new homes built with integrated technology in 2023. This trend drives demand for home theater connectivity solutions that work seamlessly with smart devices.
- Expansion of Streaming Services: The rise in streaming services has transformed consumer behaviour, leading to a notable demand for HDMI splitters. This trend highlights the need for efficient connectivity solutions in home entertainment.
- Focus on Audio Quality: Consumers are increasingly prioritising audio quality, especially among audiophiles. In 2023, around 3 million audiophiles in Japan are driving demand for high-end audio products, influencing purchasing decisions.
Investment Opportunities in the Japan Home Theater Connectivity Market
The openings below show where demand in the Japan Home Theater Connectivity Market is visible and how suppliers can enter.
- Supply of Wireless Connectivity Devices: With wireless connectivity products expected to dominate by 2025, suppliers can focus on Bluetooth transmitters and Wi-Fi enabled devices. The demand is driven by smart TV users, who seek improved audio-visual experiences.
- Smart Home Technology Investment: The government's aim to increase smart home technology adoption by 25% by 2025 creates an opportunity for suppliers. Collaborating with electronics stores can facilitate market entry.
- Online Retail Channel Expansion: The growth of online retailers, capturing 41% of the distribution channel share, presents an opportunity for suppliers to reach a broader audience. Establishing partnerships with leading online platforms can improve visibility.
- High-Quality Audio Product Development: The increasing number of audiophiles, estimated at 3 million, indicates a strong market for high-end audio products. Suppliers can focus on premium offerings to cater to this niche.
Government Initiatives in the Japan Home Theater Connectivity Market
The Electrical Appliance and Material Safety Act regulates the safety of electrical appliances, ensuring that producers meet safety standards. This law affects buyers by ensuring that products are safe for home use, building consumer confidence in home theater connectivity devices. Compliance with these regulations is essential for manufacturers to maintain market access.
The Digital Agency oversees the implementation of digital transformation initiatives, funding projects that support smart home technology adoption. This agency approves various programs aimed at improving digital infrastructure, which directly benefits producers and buyers by improving the quality and availability of home theater connectivity solutions.
Future Insight of the Japan Home Theater Connectivity Market
By 2032, the push for smart home technology will transform the home theater connectivity market. With 60% of new homes incorporating integrated smart systems, suppliers will have opportunities to create compatible products. Wireless connectivity devices will likely dominate, improving user convenience and integration. The Tokyo International Audio Show will continue to showcase advancements, influencing consumer preferences and driving innovation in product development.
Market Segmentation Analysis
Japan Home Theater Connectivity Market report covers a detailed analysis of the following market segments:
By Product Type – Audio Receivers Lead, Bluetooth Transmitters Expected to Grow Fastest
According to Saurav Kr Singh, Senior Research Analyst at 6Wresearch, Audio Receivers accounted for 42% of the market by product type in 2025. Audio receivers hold the largest market share as they are crucial for managing audio signals from multiple sources, essential for home theater setups. Their importance is highlighted by their presence in approximately 50 million households equipped with home entertainment systems. The quickest growth will come from Bluetooth Transmitters, forecast to expand at a CAGR of 10.1% between 2026 and 2032. The surge in Bluetooth transmitters is attributed to the increasing preference for wireless audio solutions, particularly as streaming services become more prevalent. This growth is expected to continue as consumers opt for the convenience offered by wireless connectivity in their audio devices. Suppliers should focus on developing advanced Bluetooth transmitters to cater to the rising demand for wireless audio connectivity.
By Connectivity Type – Wired Leads, Wireless Expected to Grow Fastest
Wired held 43% of the Japan Home Theater Connectivity Market by connectivity type in 2025. Wired connectivity is the leading segment due to its ability to provide stable connections for high-quality audio and video, which is vital for home theater performance. Many consumers prioritise wired solutions to ensure optimal audio-visual experiences in their homes. Wireless is projected to grow fastest, at a CAGR of 10.4% during 2026–2032. Wireless connectivity is experiencing rapid growth as consumers value the convenience and flexibility it offers for device placement. The trend towards smart home systems, with a notable percentage of new homes featuring integrated technology, further propels this shift. Suppliers must concentrate on advancing wireless technologies to align with the increasing consumer preference for flexible home entertainment setups.
By Distribution Channel – Online Retailers Lead and Record the Fastest Growth
The largest distribution channel category in 2025 was Online Retailers, at 41% of revenue. Online retailers dominate the distribution channel for home theater products, reflecting the shift towards e-commerce in consumer electronics. Their leading position is bolstered by the convenience they provide to a tech-savvy population that prefers online shopping. The same category are also set to grow fastest, at a CAGR of 9.2% during 2026–2032. The growth of online retailers is ongoing as more consumers appreciate the ease of purchasing home entertainment systems online. This trend is likely to persist as digital shopping becomes a staple in consumer behaviour. Suppliers should enhance their online marketing strategies to capitalise on the growing trend of e-commerce in the home theater market.
By End User – Homeowners Lead, Smart TV Users Expected to Grow Fastest
In 2025, Homeowners led the end user split with a 44% share. Homeowners represent the largest user group for home theater systems, as they are primarily responsible for the investment and installation of these systems. Their commitment to enhancing their home entertainment experience drives substantial market demand. Over 2026–2032, Smart TV Users are expected to post the fastest growth, at a CAGR of 9.6%. The number of smart TV users is rapidly increasing, with many seeking improved audio-visual experiences to complement their viewing habits. As smart TV adoption rises, so does the demand for compatible home theater solutions. Suppliers should tailor their offerings to meet the specific needs of smart TV users, ensuring compatibility and optimal performance.
Key Attractiveness of the Report
- 10 Years of Market Numbers
- Historical Data Starting from 2022 to 2025
- Base Year 2025
- Forecast Data until 2032
- Key Performance Indicators Impacting the Market
- Major Upcoming Developments and Projects
Key Highlights of the Report:
- Japan Home Theater Connectivity Market Outlook
- Market Size of Japan Home Theater Connectivity Market, 2025
- Forecast of Japan Home Theater Connectivity Market, 2032
- Historical Data and Forecast of Japan Home Theater Connectivity Revenues & Volume for the Period 2022-2032F
- Japan Home Theater Connectivity Market Trend Evolution
- Japan Home Theater Connectivity Market Drivers and Challenges
- Japan Home Theater Connectivity Price Trends
- Japan Home Theater Connectivity Porter's Five Forces
- Japan Home Theater Connectivity Industry Life Cycle
- Historical Data and Forecast of Japan Home Theater Connectivity Market Revenues & Volume By Product Type for the Period 2022-2032F
- Historical Data and Forecast of Japan Home Theater Connectivity Market Revenues & Volume By HDMI Splitters for the Period 2022-2032F
- Historical Data and Forecast of Japan Home Theater Connectivity Market Revenues & Volume By Bluetooth Transmitters for the Period 2022-2032F
- Historical Data and Forecast of Japan Home Theater Connectivity Market Revenues & Volume By Audio Receivers for the Period 2022-2032F
- Historical Data and Forecast of Japan Home Theater Connectivity Market Revenues & Volume By Media Streaming Hubs for the Period 2022-2032F
- Historical Data and Forecast of Japan Home Theater Connectivity Market Revenues & Volume By Connectivity Type for the Period 2022-2032F
- Historical Data and Forecast of Japan Home Theater Connectivity Market Revenues & Volume By Wired for the Period 2022-2032F
- Historical Data and Forecast of Japan Home Theater Connectivity Market Revenues & Volume By Wireless for the Period 2022-2032F
- Historical Data and Forecast of Japan Home Theater Connectivity Market Revenues & Volume By Wi-Fi Enabled for the Period 2022-2032F
- Historical Data and Forecast of Japan Home Theater Connectivity Market Revenues & Volume By App Integrated for the Period 2022-2032F
- Historical Data and Forecast of Japan Home Theater Connectivity Market Revenues & Volume By Distribution Channel for the Period 2022-2032F
- Historical Data and Forecast of Japan Home Theater Connectivity Market Revenues & Volume By Online Retailers for the Period 2022-2032F
- Historical Data and Forecast of Japan Home Theater Connectivity Market Revenues & Volume By Electronics Stores for the Period 2022-2032F
- Historical Data and Forecast of Japan Home Theater Connectivity Market Revenues & Volume By AV Dealers for the Period 2022-2032F
- Historical Data and Forecast of Japan Home Theater Connectivity Market Revenues & Volume By Retail Chains for the Period 2022-2032F
- Historical Data and Forecast of Japan Home Theater Connectivity Market Revenues & Volume By End User for the Period 2022-2032F
- Historical Data and Forecast of Japan Home Theater Connectivity Market Revenues & Volume By Homeowners for the Period 2022-2032F
- Historical Data and Forecast of Japan Home Theater Connectivity Market Revenues & Volume By Smart TV Users for the Period 2022-2032F
- Historical Data and Forecast of Japan Home Theater Connectivity Market Revenues & Volume By Audiophiles for the Period 2022-2032F
- Historical Data and Forecast of Japan Home Theater Connectivity Market Revenues & Volume By Movie Buffs for the Period 2022-2032F
- Japan Home Theater Connectivity Import Export Trade Statistics
- Market Opportunity Assessment By Product Type
- Market Opportunity Assessment By Connectivity Type
- Market Opportunity Assessment By Distribution Channel
- Market Opportunity Assessment By End User
- Japan Home Theater Connectivity Top Companies Market Share
- Japan Home Theater Connectivity Competitive Benchmarking By Technical and Operational Parameters
- Japan Home Theater Connectivity Company Profiles
- Japan Home Theater Connectivity Key Strategic Recommendations
Market Covered
Coverage by segment is as follows.
By Product Type
- HDMI Splitters
- Bluetooth Transmitters
- Audio Receivers
- Media Streaming Hubs
By Connectivity Type
- Wired
- Wireless
- Wi-Fi Enabled
- App Integrated
By Distribution Channel
- Online Retailers
- Electronics Stores
- AV Dealers
- Retail Chains
By End User
- Homeowners
- Smart TV Users
- Audiophiles
- Movie Buffs































