Japan Real Estate Rendering Market Size & Growth Rate
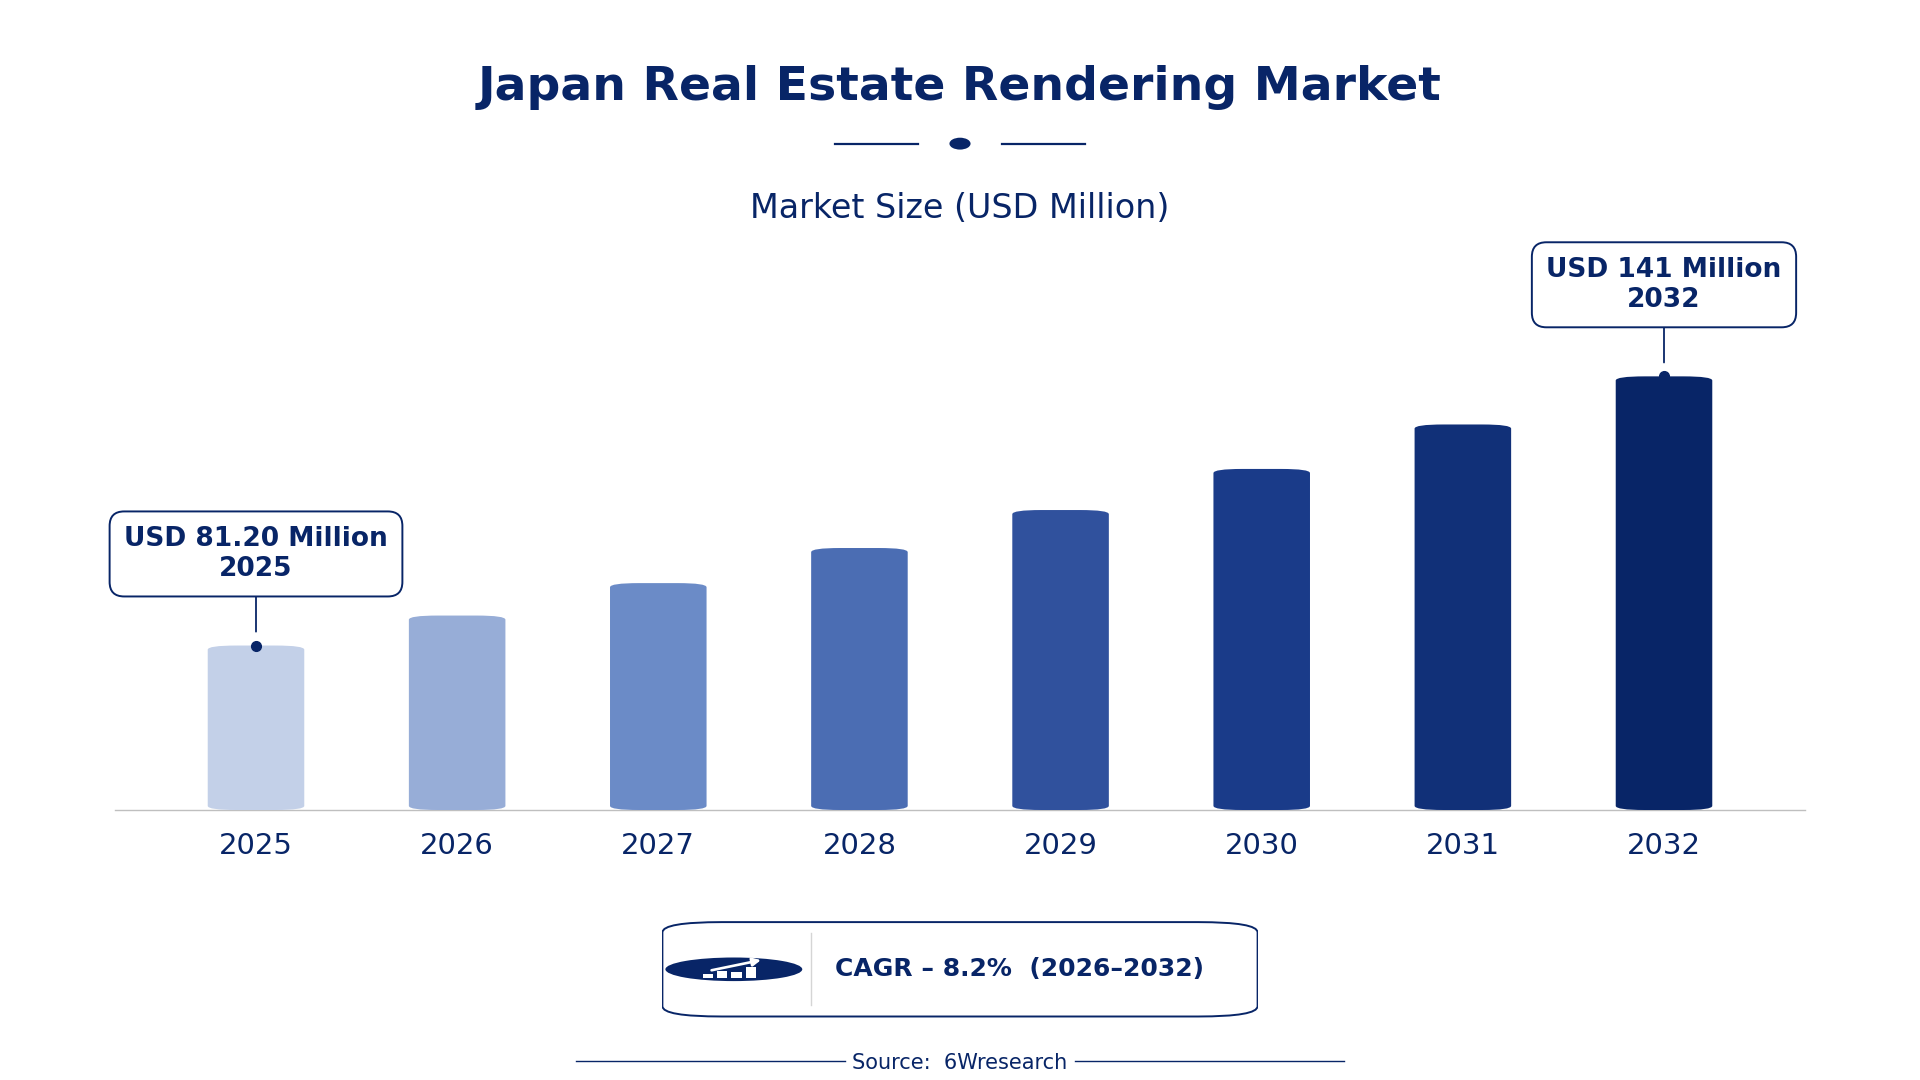
According to 6Wresearch internal database and industry insights, the Japan Real Estate Rendering Market was valued at USD 81.20 Million in 2025 and is projected to reach USD 141 Million by 2032, growing at a CAGR of approximately 8.2% during 2026–2032.
Japan Real Estate Rendering Market Highlights
| Report Metric | Details |
| Report Name | Japan Real Estate Rendering Market (2026-2032) |
| Market Size 2025 | USD 81.20 Million |
| Market Size 2032 | USD 141 Million |
| Absolute Growth 2025–2032 | USD 59.80 Million |
| CAGR 2026–2032 | 8.2% |
| Peak Annual Growth | 9.3% in 2032 |
| Forecast Period | 2026–2032 |
| Historical Data | 2022–2025 |
| Base Year | 2025 |
| Leading Render Type, 2025 | 3D Architectural Renders (46% share) |
| Leading Technology Used, 2025 | CGI/3DS Max (45% share) |
| Leading Delivery Mode, 2025 | On-Premise/Cloud (37% share) |
| Leading End User, 2025 | Architects & Developers (36% share) |
| Fastest-Growing Render Type | VR/AR Walkthroughs (11.8% CAGR) |
| Fastest-Growing Technology Used | Unreal Engine/Unity (12.0% CAGR) |
| Fastest-Growing Delivery Mode | Web/App-Based (11.5% CAGR) |
| Fastest-Growing End User | Real Estate Agents (10.9% CAGR) |
| Growing Sector | Real Estate |
| Key End Users | Architects, Developers, Real Estate Agents, Marketing Agencies |
Japan Real Estate Rendering Market Year-wise Growth Rate and Key Drivers (2022–2032)
This graph illustrates the annual growth rates of the market from 2022 to 2032, highlighting a steady upward trajectory and projected market expansion over the forecast period.
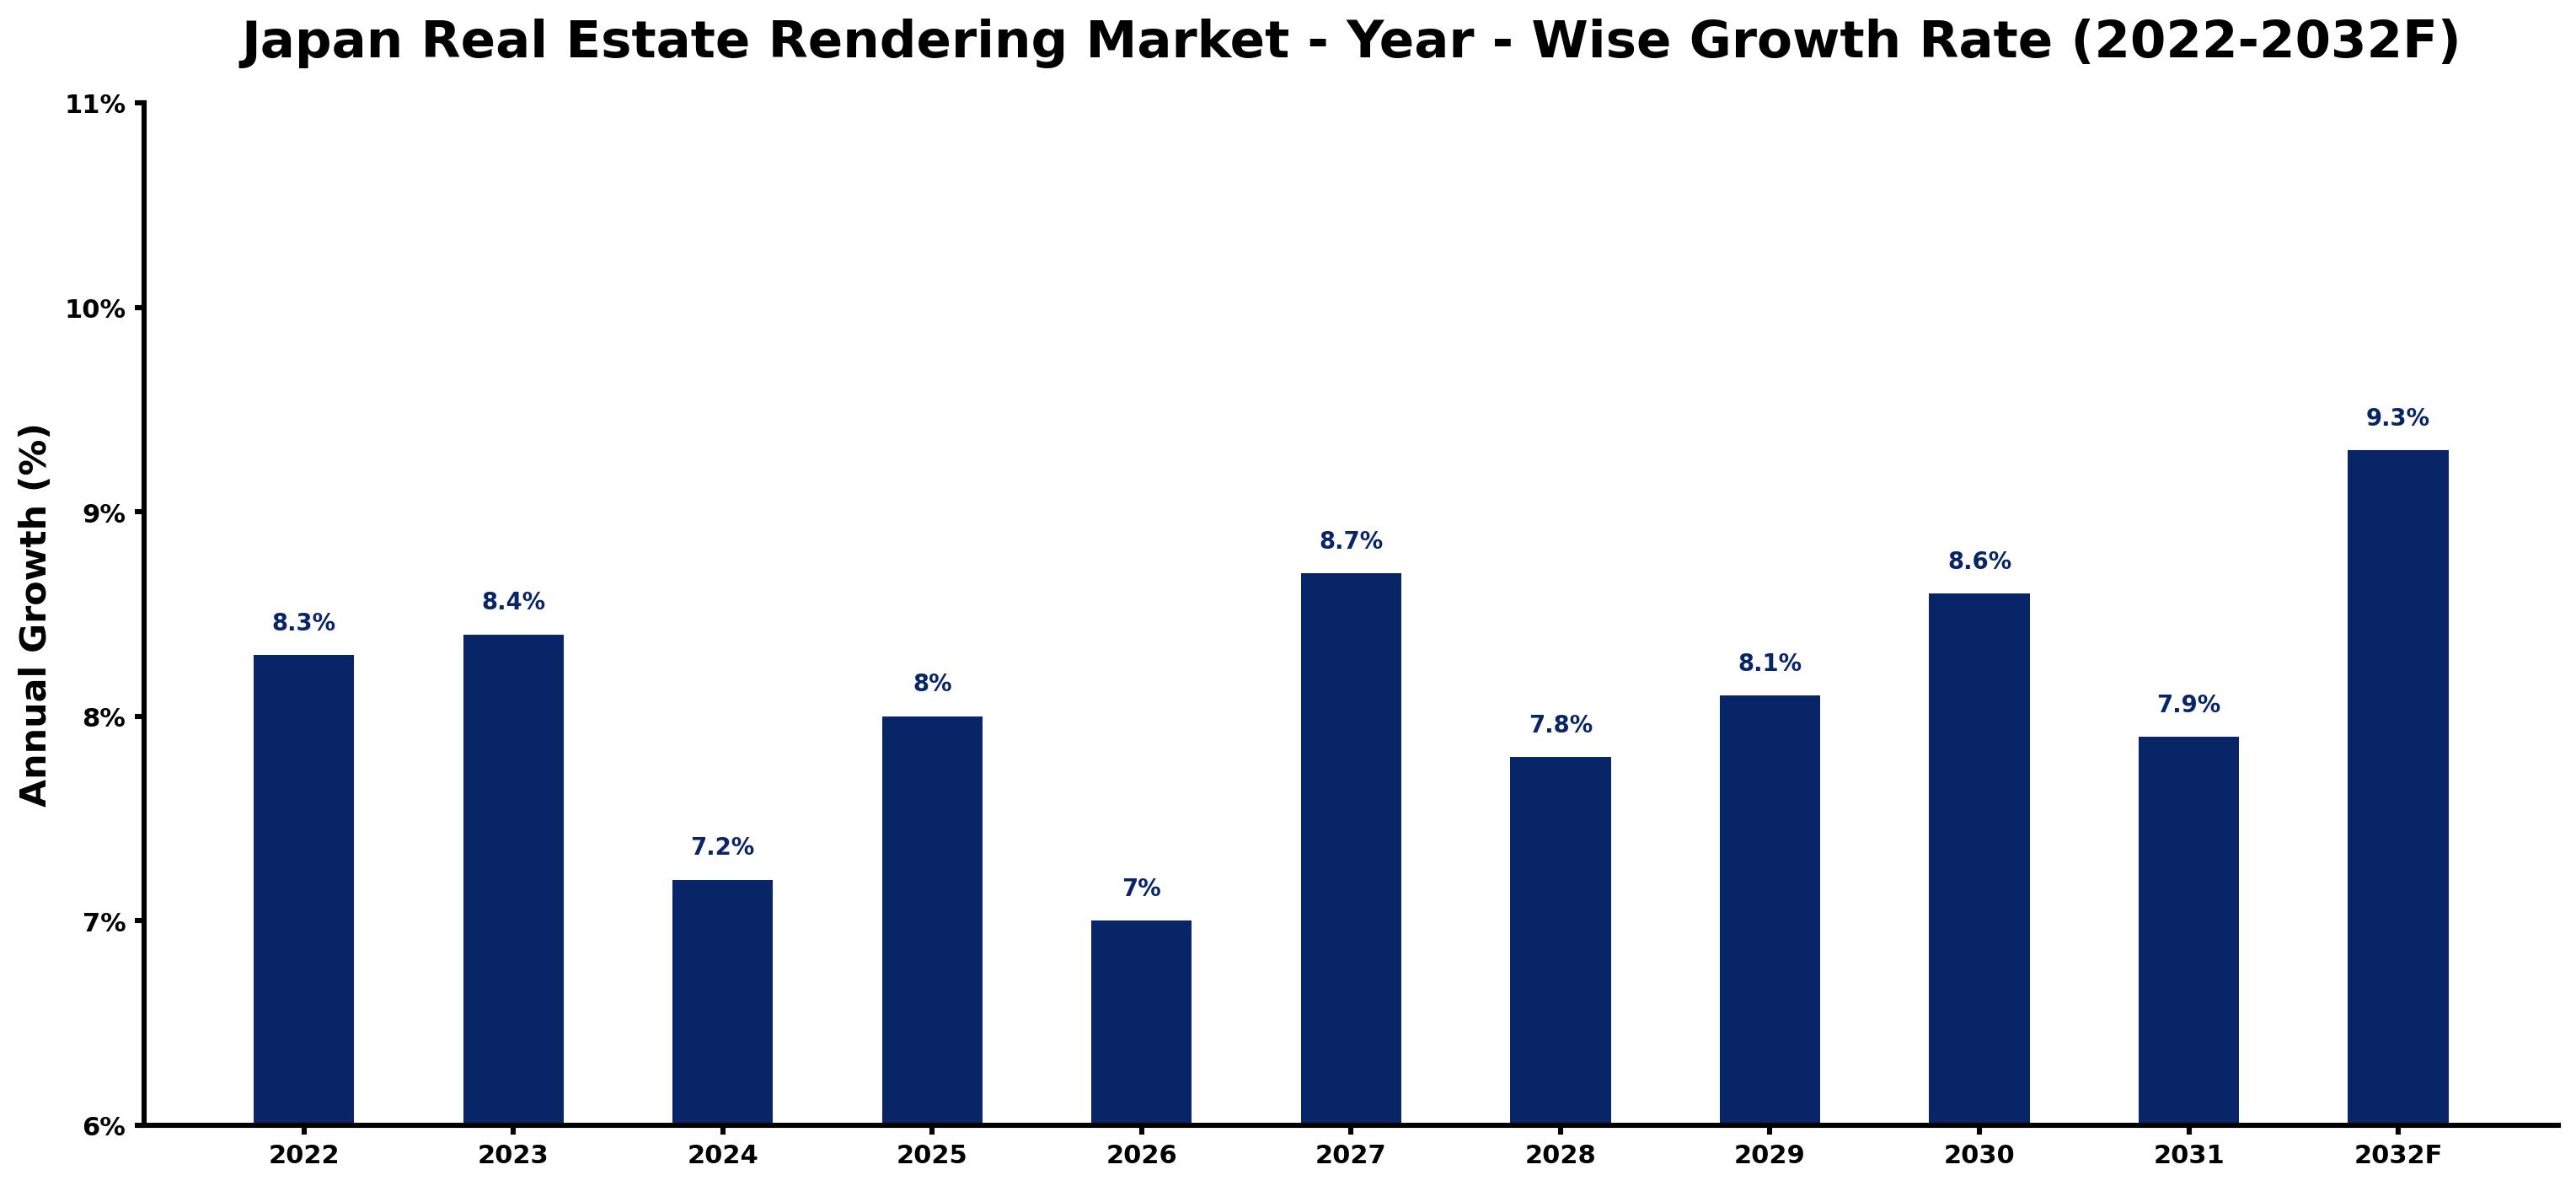
Below, each year's estimated growth is shown next to the factor that most influenced it.
| Year | Estimated Annual Growth (%) | Market Rationale |
| 2022 | 8.3 | The market was characterised by steady demand from architects and developers. |
| 2023 | 8.4 | Growth accelerated due to increased project activity in Tokyo's real estate sector. |
| 2024 | 7.2 | A slowdown occurred as some projects faced delays in approvals and financing. |
| 2025 | 8.0 | Demand rebounded as more developers sought high-quality rendering services. |
| 2026 | 7.0 | Growth is expected to slow again as competition intensifies among rendering service providers. |
| 2027 | 8.7 | An increase in investment in real estate technology is projected to spur demand for rendering. |
| 2028 | 7.8 | A slight slowdown is anticipated as market saturation begins to impact growth rates. |
| 2029 | 8.1 | Demand is expected to rise as more agents adopt advanced rendering technologies for marketing. |
| 2030 | 8.6 | Growth will continue as the adoption of VR/AR technologies becomes more widespread. |
| 2031 | 7.9 | A slowdown is projected as the market adjusts to new technological standards. |
| 2032 | 9.3 | The market is expected to peak as advanced rendering solutions gain traction among buyers. |
Note: Market size estimations and growth projections presented in this report are based on 6Wresearch's proprietary forecasting methodology, utilizing the latest available industry data, government publications, and primary research inputs.
Japan Real Estate Rendering Market Synopsis
Real Estate Rendering involves creating visual representations of properties using advanced software like CGI and 3D modeling tools. This market is expanding due to rising demand from architects, developers, and real estate agents, driven by the need for effective marketing and design visualisation. The Japan Real Estate Rendering Market is particularly vibrant in the Tokyo region, which accounts for 50% of transactions, while the adoption of VR/AR technologies is increasing client engagement and broadening market opportunities.
Market Dynamics Impact Analysis (2026–2032)
| Factor | Type | Impact | Primary Segment Affected |
| Growing adoption of VR/AR technology | Driver | High | VR/AR Walkthroughs |
| Increasing number of real estate transactions | Driver | High | 3D Architectural Renders |
| Rising demand for high-quality marketing materials | Opportunity | High | Video/Still |
| Investment in real estate technology reaching ¥10 billion | Opportunity | High | Web/App-Based |
| High competition among rendering service providers | Restraint | Medium | On-Premise/Cloud |
| Slow adoption of new technologies by older agents | Restraint | Medium | CGI/3DS Max |
| High production times for complex renders | Challenge | Medium | Aerial Drone Renders |
| Need for continuous training on new software | Challenge | Medium | Interactive Floor Plans |
Evaluation of Drivers in Japan Real Estate Rendering Market (2026–2032)
Key forces behind demand, with the segment each one moves most, are listed below.
| Drivers | Primary Segment Affected | Why It Matters (Evidence) |
| Increased project activity in Tokyo | 3D Architectural Renders | Tokyo's real estate market, valued at approximately ¥60 trillion, drives demand for high-quality renders. |
| Growing adoption of VR/AR technology | VR/AR Walkthroughs | 30% of real estate agencies are using VR/AR, enhancing client engagement and driving purchases. |
| Rising number of real estate agents | Video/Still | With around 100,000 agents in Japan, the demand for effective marketing materials is increasing. |
| Investment in real estate technology | Web/App-Based | Investment reached ¥10 billion in 2023, leading to more advanced rendering solutions. |
| Demand for innovative marketing solutions | On-Premise/Cloud | 70% of marketing agencies prefer web-based delivery for its efficiency and accessibility. |
Purchasing is picking up as Tokyo's real estate market thrives, valued at approximately ¥60 trillion. Investment in real estate technology reached ¥10 billion in 2023, encouraging the development of advanced rendering solutions. With around 100,000 agents in Japan, the demand for effective marketing materials is increasing.
Evaluation of Restraints in Japan Real Estate Rendering Market
These restraints slow adoption and weigh on supplier margins.
| Market Restraint | Primary Segment Affected | Why It Matters (Evidence) |
| Intense competition among rendering service providers | On-Premise/Cloud | High competition can lead to price wars, affecting profitability for providers. |
| Slow adoption of new technologies by older agents | CGI/3DS Max | The average age of real estate agents is 45, impacting their willingness to adopt new tools. |
| High production times for complex renders | Aerial Drone Renders | The average time to produce a high-quality render is 2-4 weeks, which can delay projects. |
| Limited awareness of advanced rendering technologies | VR/AR Walkthroughs | Many smaller agencies lack knowledge about the benefits of VR/AR, hindering market growth. |
| Dependence on software updates and training | Interactive Floor Plans | Regular training on new software is required, posing a barrier for smaller firms. |
Japan Real Estate Rendering Market Challenges
Producers encounter high production costs for rendering services, with average prices for 3D architectural renders ranging from ¥50,000 to ¥300,000, which compresses their profit margins. Regulatory compliance with standards like JIS Z 8301 leads to delays for distributors, increasing costs for buyers. Technology adoption is hindered by the average age of real estate agents being 45 years, limiting their access to advanced rendering tools, which affects buyers' ability to utilise modern techniques. Intense competition in Tokyo, which accounts for 50% of real estate transactions, pressures producers to reduce prices, threatening their sustainability.
Trends in the Japan Real Estate Rendering Market
The trends below show where the Japan Real Estate Rendering Market is heading.
- Shift from Traditional to Digital Marketing: Real estate agents are increasingly adopting digital marketing strategies, with 70% preferring web-based delivery modes. This shift improves efficiency and reaches a broader audience, reflecting the industry's move towards technology.
- Transition from Static to Interactive Presentations: Since 2023, the use of VR/AR walkthroughs has surged, improving client engagement. This trend is clear as 30% of agencies now incorporate these technologies into their presentations.
- Emergence of Aerial Drone Renders: Aerial drone renders have gained popularity among developers, with a 15% increase in usage in 2023. This method provides unique perspectives, attracting more buyers to large properties.
- Prioritisation of High-Quality Visuals: The demand for high-quality video and still renders is rising, driven by the need for effective marketing. This trend is supported by the increasing number of real estate transactions in Tokyo.
Investment Opportunities in the Japan Real Estate Rendering Market
The following areas offer the clearest openings for investors and suppliers in the Japan Real Estate Rendering Market.
- Investment in Advanced Rendering Technologies: With investment in real estate technology reaching ¥10 billion in 2023, there is an opportunity for suppliers to provide advanced rendering solutions to developers and agents.
- Expansion of VR/AR Services: As 30% of agencies adopt VR/AR technology, there is a growing need for providers to offer these services, particularly in urban areas like Tokyo.
- Development of Interactive Marketing Tools: The demand for interactive floor plans is increasing, presenting an opportunity for technology firms to collaborate with marketing agencies to create engaging tools.
- Partnerships with Real Estate Agencies: Now is the time for rendering service providers to establish partnerships with real estate agencies, as the market increasingly focuses on high-quality visual marketing.
Government Initiatives in the Japan Real Estate Rendering Market
The Industrial Standardization Act, amended in 2019, governs JIS product and test standards, ensuring that rendering technologies meet national quality benchmarks. This law impacts producers by requiring compliance with established standards, influencing the quality of services offered in the market. The Act against Unjustifiable Premiums and Misleading Representations prohibits misleading advertising, affecting how rendering services are marketed to clients.
In 2023, the Tokyo Metropolitan Government launched a programme supporting digital transformation in real estate, with funding of ¥5 billion allocated for technology adoption. The Digital Agency oversees this initiative, aiming to improve the use of advanced rendering technologies among real estate professionals.
Future Insight of the Japan Real Estate Rendering Market
The launch of smart city initiatives will transform rendering practices by 2032, enhancing visual representation capabilities. Investment in real estate technology reached ¥10 billion in 2023, showcasing a strong commitment to digital advancement. The growing adoption of VR/AR technology, with 30% of agencies currently utilising it, will revolutionise client presentations. Increased emphasis on web-based delivery modes will streamline processes, making it easier for buyers to access high-quality renders and for suppliers to meet demand efficiently.
Market Segmentation Analysis
Japan Real Estate Rendering Market report covers a detailed analysis of the following market segments:
By Render Type – 3D Architectural Renders Lead, VR/AR Walkthroughs Expected to Grow Fastest
According to Saurav Kr Singh, Senior Research Analyst at 6Wresearch, 3D Architectural Renders accounted for 46% of the market by render type in 2025. 3D architectural renders are essential for property marketing and design visualisation, widely utilised by architects and developers in Japan. Their significance is underscored by the Tokyo region accounting for 50% of all real estate transactions, which necessitates high-quality visuals. Over 2026–2032, VR/AR Walkthroughs are expected to post the fastest growth, at a CAGR of 11.8%. The rise of VR/AR walkthroughs is fuelled by their ability to enhance client engagement through immersive experiences, with a 15% increase in usage among developers in 2023. As technology progresses, the demand for these immersive tools is likely to expand further. Suppliers should prioritise the development of VR/AR solutions to meet the growing demand from real estate professionals.
By Technology Used – CGI/3DS Max Leads, Unreal Engine/Unity Expected to Grow Fastest
CGI/3DS Max took 45% of technology used revenue in 2025, more than any other category. CGI/3DS Max is the leading software for creating high-quality renders, essential for meeting the rigorous standards of the real estate market. Its dominance is underscored by its over 40% market share among professionals, reflecting its widespread acceptance. Unreal Engine/Unity is set to record the highest CAGR in this split, 12.0% over 2026–2032. The rapid adoption of Unreal Engine and Unity is fuelled by their effectiveness in creating interactive and immersive applications, which are increasingly preferred in the real estate sector. This shift indicates a growing trend towards more dynamic visualisation tools. Buyers will gain from suppliers providing advanced interactive technologies to improve their property presentations.
By Delivery Mode – On-Premise/Cloud Leads, Web/App-Based Expected to Grow Fastest
In 2025, On-Premise/Cloud led the delivery mode split with a 37% share. On-premise and cloud delivery modes are prevalent due to their flexibility and accessibility, allowing users to manage and access rendering projects efficiently. This approach aligns with the needs of the 100,000 real estate agents in Japan. The quickest growth will come from Web/App-Based, forecast to expand at a CAGR of 11.5% between 2026 and 2032. Web and app-based delivery modes are gaining traction, as they provide accessibility on various devices, catering to the preferences of 70% of marketing agencies. This shift reflects a broader trend towards digital solutions in real estate. Suppliers must prioritise web and app-based solutions to align with the evolving preferences of real estate professionals.
By End User – Architects & Developers Lead, Real Estate Agents Expected to Grow Fastest
Architects & Developers held 36% of the Japan Real Estate Rendering Market by end user in 2025. Architects and developers are the primary users of rendering services, relying on them for crucial design and visualisation tasks. Their pivotal role is highlighted by the approximately 100,000 real estate agents in Japan, which drives the need for high-quality architectural renders. Real Estate Agents are projected to grow fastest, at a CAGR of 10.9% during 2026–2032. Real estate agents are experiencing the fastest growth in the use of rendering services, utilising these tools for effective marketing and sales presentations. This trend is expected to continue as competition within the market intensifies. Suppliers should focus on tailoring their offerings to meet the specific needs of real estate agents, who are increasingly becoming key drivers of demand.
Key Attractiveness of the Report
- 10 Years of Market Numbers
- Historical Data Starting from 2022 to 2025
- Base Year 2025
- Forecast Data until 2032
- Key Performance Indicators Impacting the Market
- Major Upcoming Developments and Projects
Key Highlights of the Report:
- Japan Real Estate Rendering Market Outlook
- Market Size of Japan Real Estate Rendering Market, 2025
- Forecast of Japan Real Estate Rendering Market, 2032
- Historical Data and Forecast of Japan Real Estate Rendering Revenues & Volume for the Period 2022-2032F
- Japan Real Estate Rendering Market Trend Evolution
- Japan Real Estate Rendering Market Drivers and Challenges
- Japan Real Estate Rendering Price Trends
- Japan Real Estate Rendering Porter's Five Forces
- Japan Real Estate Rendering Industry Life Cycle
- Historical Data and Forecast of Japan Real Estate Rendering Market Revenues & Volume By Render Type for the Period 2022-2032F
- Historical Data and Forecast of Japan Real Estate Rendering Market Revenues & Volume By 3D Architectural Renders for the Period 2022-2032F
- Historical Data and Forecast of Japan Real Estate Rendering Market Revenues & Volume By VR/AR Walkthroughs for the Period 2022-2032F
- Historical Data and Forecast of Japan Real Estate Rendering Market Revenues & Volume By Aerial Drone Renders for the Period 2022-2032F
- Historical Data and Forecast of Japan Real Estate Rendering Market Revenues & Volume By Interactive Floor Plans for the Period 2022-2032F
- Historical Data and Forecast of Japan Real Estate Rendering Market Revenues & Volume By Technology Used for the Period 2022-2032F
- Historical Data and Forecast of Japan Real Estate Rendering Market Revenues & Volume By CGI/3DS Max for the Period 2022-2032F
- Historical Data and Forecast of Japan Real Estate Rendering Market Revenues & Volume By Unreal Engine/Unity for the Period 2022-2032F
- Historical Data and Forecast of Japan Real Estate Rendering Market Revenues & Volume By UAV Imaging for the Period 2022-2032F
- Historical Data and Forecast of Japan Real Estate Rendering Market Revenues & Volume By Web Embeddable for the Period 2022-2032F
- Historical Data and Forecast of Japan Real Estate Rendering Market Revenues & Volume By Delivery Mode for the Period 2022-2032F
- Historical Data and Forecast of Japan Real Estate Rendering Market Revenues & Volume By On-Premise/Cloud for the Period 2022-2032F
- Historical Data and Forecast of Japan Real Estate Rendering Market Revenues & Volume By Web/App-Based for the Period 2022-2032F
- Historical Data and Forecast of Japan Real Estate Rendering Market Revenues & Volume By Video/Still for the Period 2022-2032F
- Historical Data and Forecast of Japan Real Estate Rendering Market Revenues & Volume By HTML5/Flash for the Period 2022-2032F
- Historical Data and Forecast of Japan Real Estate Rendering Market Revenues & Volume By End User for the Period 2022-2032F
- Historical Data and Forecast of Japan Real Estate Rendering Market Revenues & Volume By Architects & Developers for the Period 2022-2032F
- Historical Data and Forecast of Japan Real Estate Rendering Market Revenues & Volume By Real Estate Agents for the Period 2022-2032F
- Historical Data and Forecast of Japan Real Estate Rendering Market Revenues & Volume By Marketing Agencies for the Period 2022-2032F
- Historical Data and Forecast of Japan Real Estate Rendering Market Revenues & Volume By Property Portals for the Period 2022-2032F
- Japan Real Estate Rendering Import Export Trade Statistics
- Market Opportunity Assessment By Render Type
- Market Opportunity Assessment By Technology Used
- Market Opportunity Assessment By Delivery Mode
- Market Opportunity Assessment By End User
- Japan Real Estate Rendering Top Companies Market Share
- Japan Real Estate Rendering Competitive Benchmarking By Technical and Operational Parameters
- Japan Real Estate Rendering Company Profiles
- Japan Real Estate Rendering Key Strategic Recommendations
Market Covered
Coverage by segment is as follows.
By Render Type
- 3D Architectural Renders
- VR/AR Walkthroughs
- Aerial Drone Renders
- Interactive Floor Plans
By Technology Used
- CGI/3DS Max
- Unreal Engine/Unity
- UAV Imaging
- Web Embeddable
By Delivery Mode
- On-Premise/Cloud
- Web/App-Based
- Video/Still
- HTML5/Flash
By End User
- Architects & Developers
- Real Estate Agents
- Marketing Agencies
- Property Portals































