Japan Recreational Facilities Market Size & Growth Rate
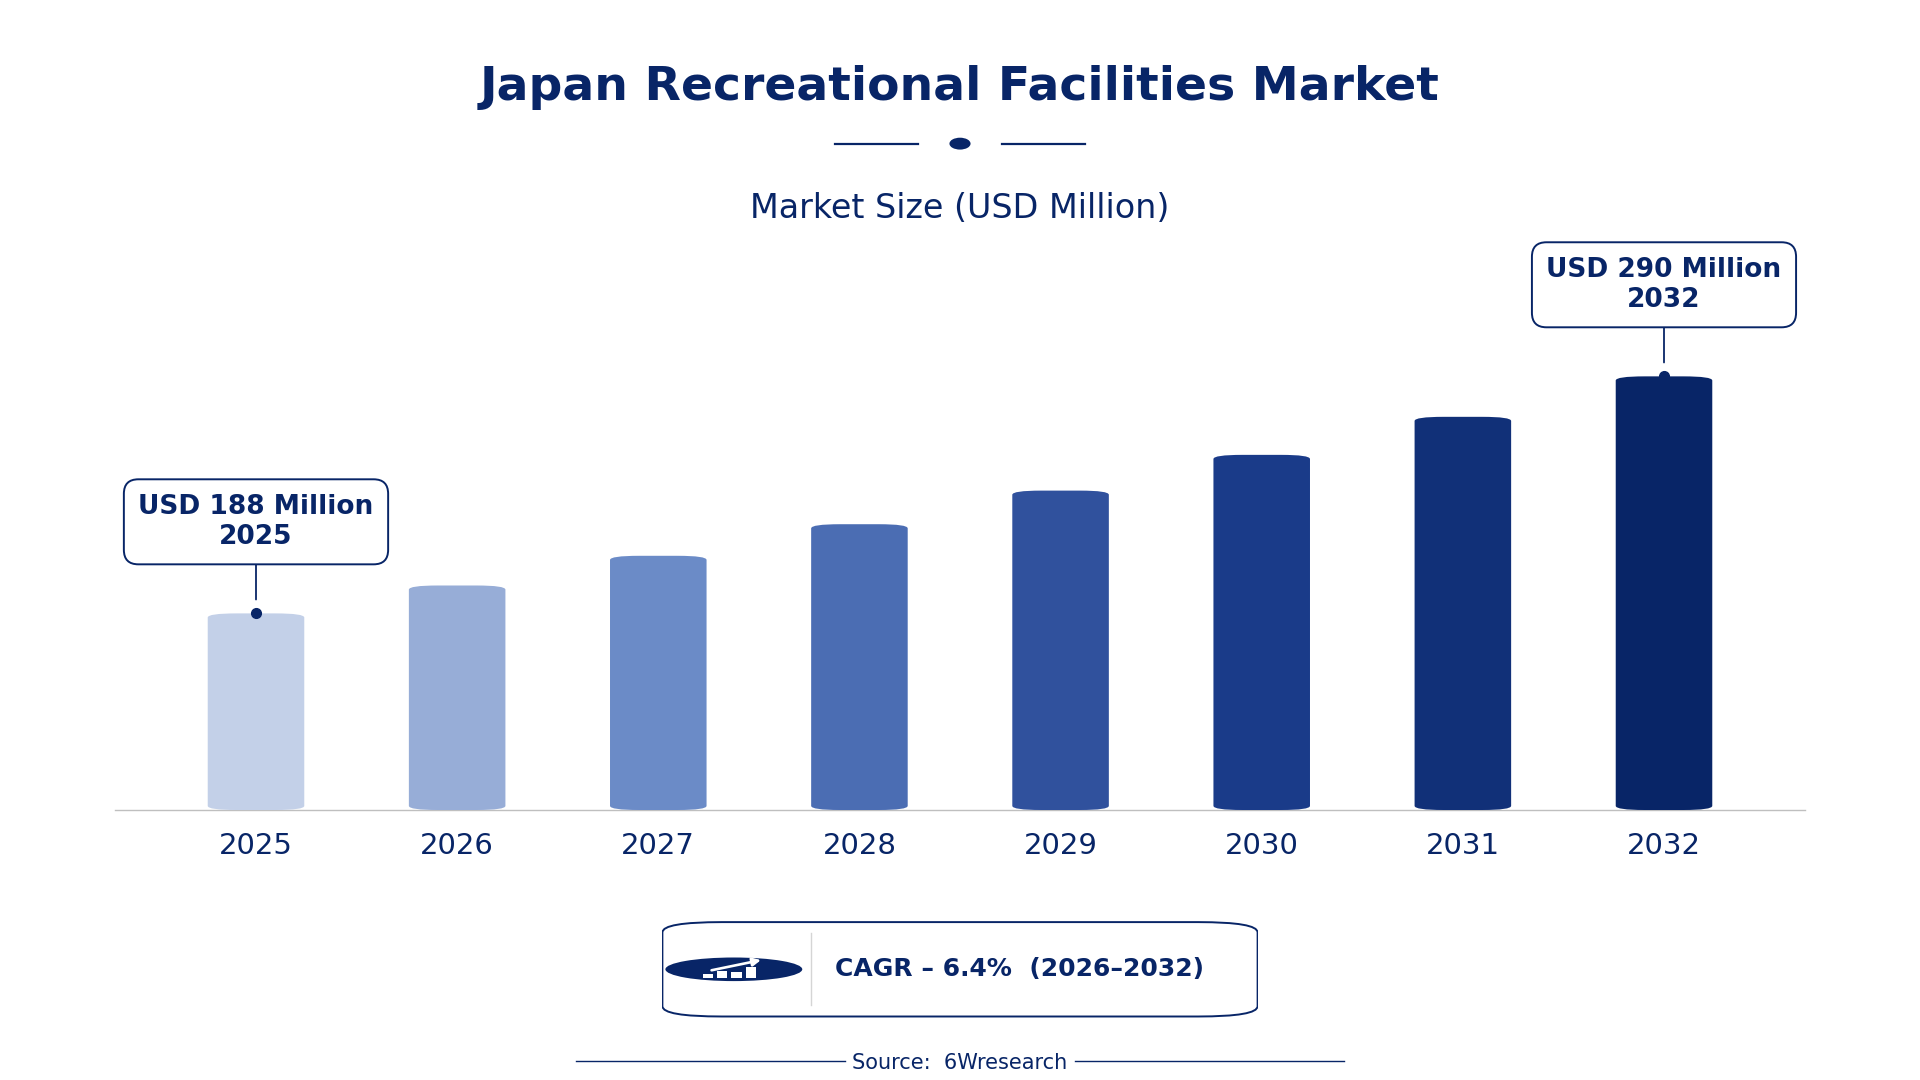
According to 6Wresearch internal database and industry insights, the Japan Recreational Facilities Market was valued at USD 188 Million in 2025 and is projected to reach USD 290 Million by 2032, growing at a CAGR of approximately 6.4% during 2026–2032.
Japan Recreational Facilities Market Highlights
| Report Metric | Details |
| Report Name | Japan Recreational Facilities Market (2026-2032) |
| Market Size 2025 | USD 188 Million |
| Market Size 2032 | USD 290 Million |
| Absolute Growth 2025–2032 | USD 102 Million |
| CAGR 2026–2032 | 6.4% |
| Peak Annual Growth | 7.2% in 2028 |
| Forecast Period | 2026–2032 |
| Historical Data | 2022–2025 |
| Base Year | 2025 |
| Leading Facility Type, 2025 | Fitness Centers (47% share) |
| Leading Facility Size, 2025 | Tiered Memberships (40% share) |
| Leading Booking Model, 2025 | Monthly/Annual (43% share) |
| Leading End User, 2025 | Gym-Goers (42% share) |
| Fastest-Growing Facility Type | Adventure Parks (8.4% CAGR) |
| Fastest-Growing Facility Size | Theme-Sized (8.3% CAGR) |
| Fastest-Growing Booking Model | Ticket-Based (8.6% CAGR) |
| Fastest-Growing End User | Leisure Tourists (8.5% CAGR) |
| Growing Sector | Leisure Tourists |
| Key End Users | Gym-Goers, Leisure Tourists, Schools & Clubs, Boating Enthusiasts |
Japan Recreational Facilities Market Year-wise Growth Rate and Key Drivers (2022–2032)
This graph illustrates the annual growth rates of the market from 2022 to 2032, highlighting a steady upward trajectory and projected market expansion over the forecast period.
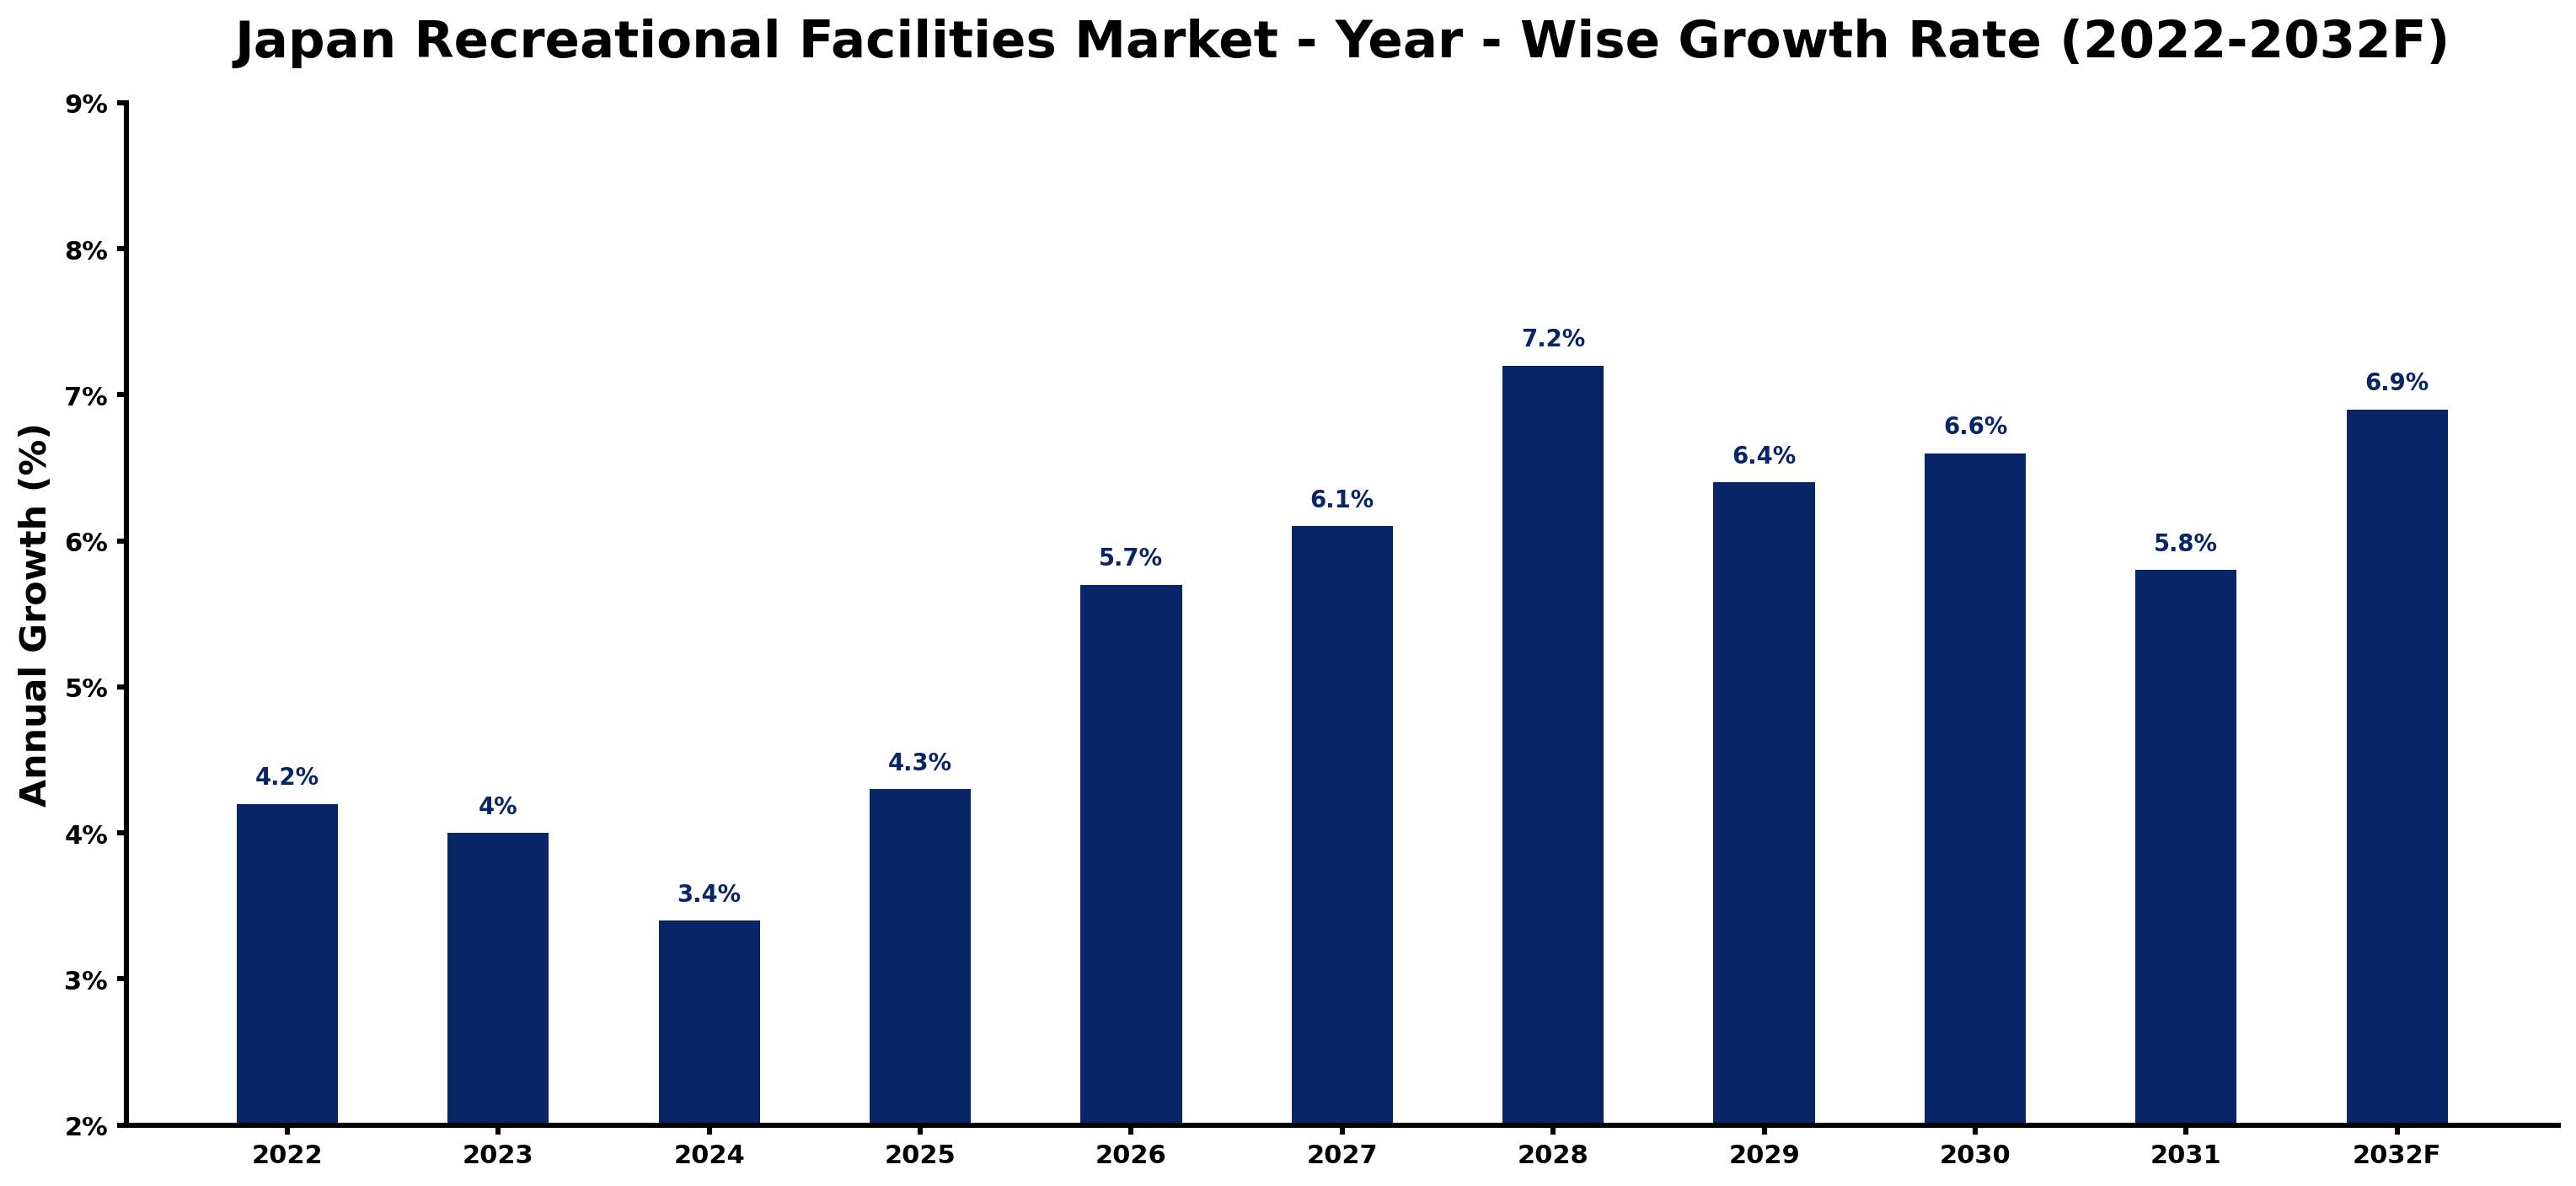
The following figures match every annual growth estimate with the main market development of that year, giving the reasoning behind each rise or slowdown.
| Year | Estimated Annual Growth (%) | Market Rationale |
| 2022 | 4.2 | The market showed stable activity with a growth rate reflecting ongoing local interest. |
| 2023 | 4.0 | Growth slowed due to market saturation in urban areas and increased competition. |
| 2024 | 3.4 | Demand continued to slow as consumer preferences shifted towards alternative leisure activities. |
| 2025 | 4.3 | Growth accelerated as community sports initiatives gained traction in urban populations. |
| 2026 | 5.7 | Investment in recreational infrastructure is expected to support a faster growth rate. |
| 2027 | 6.1 | Demand is projected to rise as urban populations seek more fitness options and leisure activities. |
| 2028 | 7.2 | The market is expected to peak due to heightened interest in outdoor activities and fitness trends. |
| 2029 | 6.4 | Growth is projected to slow slightly as the market adjusts to the peak in demand. |
| 2030 | 6.6 | Increased participation in fitness activities will drive a resurgence in growth rates. |
| 2031 | 5.8 | The market is expected to experience a slowdown as competition intensifies among facilities. |
| 2032 | 6.9 | Growth will resume as new recreational initiatives attract more local users. |
Note: Market size estimations and growth projections presented in this report are based on 6Wresearch's proprietary forecasting methodology, utilizing the latest available industry data, government publications, and primary research inputs.
Japan Recreational Facilities Market Synopsis
Recreational facilities in Japan encompass a variety of venues, including fitness centres, adventure parks, and community sports complexes, designed with durable materials and modern aesthetics to cater to diverse leisure needs. The Japan Recreational Facilities Market is growing, propelled by local interest in fitness and leisure activities, with over 30,000 fitness centres serving a wide range of demographics. Annual investment in recreational infrastructure is projected at ¥100 billion, while adventure parks draw millions of visitors each year, highlighting the sector's growth potential.
Market Dynamics Impact Analysis (2026–2032)
| Factor | Type | Impact | Primary Segment Affected |
| Growing interest in community sports initiatives | Driver | High | Community Sports Complex |
| Increased investment in recreational infrastructure | Driver | High | Fitness Centers |
| Expansion of adventure tourism | Opportunity | High | Adventure Parks |
| Rising number of fitness-conscious individuals | Opportunity | Medium | Fitness Centers |
| Market saturation in urban areas | Restraint | High | Fitness Centers |
| Intense competition among recreational facilities | Restraint | Medium | Adventure Parks |
| High operational costs for maintaining facilities | Challenge | High | Community Sports Complex |
| Regulatory compliance costs for new facilities | Challenge | Medium | Marina & Boat Docks |
Evaluation of Drivers in Japan Recreational Facilities Market (2026–2032)
The factors lifting demand, and the evidence behind each, are summarised below.
| Drivers | Primary Segment Affected | Why It Matters (Evidence) |
| High participation in fitness activities | Fitness Centers | With over 30,000 fitness centers, local users are increasingly prioritising health and wellness, driving demand. |
| Government support for community sports | Community Sports Complex | The Sports Agency of Japan promotes community sports, encouraging local governments to invest in sports facilities. |
| Increased leisure tourism | Adventure Parks | Leisure tourists reached 31.9 million in 2019, boosting demand for entertainment options like adventure parks. |
| Growing urban populations | Fitness Centers | Urban areas, particularly Tokyo and Osaka, are seeing rising demand for fitness facilities due to population density. |
| Investment in recreational infrastructure | Marina & Boat Docks | Annual investment in recreational infrastructure is estimated at ¥100 billion, enhancing facilities for boating enthusiasts. |
Spending increases as urban populations place greater emphasis on health and wellness, driving the demand for fitness centres. Japan boasts more than 30,000 fitness centres that cater to various demographics. In 2019, leisure tourists reached 31.9 million, further boosting interest in adventure parks. Community sports complexes are common in urban settings, promoting local sports and encouraging participation. The estimated annual investment in recreational infrastructure stands at ¥100 billion, improving facilities for local users and attracting additional visitors.
Evaluation of Restraints in Japan Recreational Facilities Market
These restraints slow adoption and weigh on supplier margins.
| Market Restraint | Primary Segment Affected | Why It Matters (Evidence) |
| High competition among recreational facilities | Fitness Centers | Intense competition drives down prices, forcing operators to cut corners on maintenance and safety, compromising user experience for millions of visitors. |
| Rising operational costs | Community Sports Complex | Increasing energy and staffing costs strain budgets, leading to delays in facility upgrades that affect service quality for local users. |
| Limited investment in innovation | Adventure Parks | Facilities struggle to innovate due to budget constraints, reducing customer satisfaction and loyalty among visitors. |
| Supply chain disruptions | Marina & Boat Docks | Delays in obtaining construction materials can impact planned annual investments in infrastructure development. |
| Changing consumer preferences | Fitness Centers | Shifts towards alternative leisure activities can divert potential users away from traditional fitness facilities. |
Japan Recreational Facilities Market Challenges
Intense competition among recreational facilities in Japan leads to price reductions, compelling operators to reduce maintenance budgets, which can diminish the experience for over 10 million users each year. Rising energy and staffing costs are putting pressure on budgets, causing delays in necessary upgrades that affect service quality for local patrons. Buyers increasingly demand diverse offerings, yet many facilities struggle to secure sufficient investment to meet these expectations, jeopardising customer loyalty. Supply chain disruptions for construction materials may delay new projects, impacting the planned annual investment of ¥100 billion in recreational infrastructure.
Trends in the Japan Recreational Facilities Market
The trends below show where the Japan Recreational Facilities Market is heading.
- Shift in Fitness Trends: Gym-goers are increasingly pursuing varied fitness experiences, resulting in the growth of specialised fitness classes. In 2022, over 30,000 fitness centres adapted to these evolving preferences.
- Transition to Outdoor Activities: Since 2019, outdoor recreational activities have seen a marked increase, spurred by the Japan Tourism Agency's promotion of adventure tourism. This trend has attracted millions of leisure tourists.
- Emergence of Technology in Fitness: In 2023, fitness centres began incorporating advanced technology, such as virtual reality training programs, to engage users. This trend is set to reshape the fitness market.
- Prioritisation of Community Sports: Community sports complexes are increasingly emphasised in public health initiatives, supported by local government funding. This trend aims to encourage active lifestyles among urban populations.
Investment Opportunities in the Japan Recreational Facilities Market
The openings below show where demand in the Japan Recreational Facilities Market is visible and how suppliers can enter.
- Growing Demand for Fitness Programs: Gym-goers are increasingly searching for new fitness solutions, creating a gap for fresh offerings. The annual investment in recreational infrastructure is estimated at ¥100 billion, presenting opportunities for suppliers.
- Expansion of Adventure Parks: Leisure tourists are driving the demand for additional adventure parks, particularly in urban areas. With millions of visitors each year, investment in new attractions can yield substantial returns.
- Development of Community Sports Facilities: Schools and clubs require improved sports facilities to support local initiatives. Local governments are funding projects to enhance infrastructure, creating opportunities for construction partners.
- Investment in Marina Facilities: Boating enthusiasts are seeking better marina facilities, with an estimated 1.5 million users in Japan. Collaborating with local authorities can facilitate new developments in this sector.
Government Initiatives in the Japan Recreational Facilities Market
The GX Basic Policy, adopted in 2023, aims for substantial public-private investment in recreational infrastructure over the next decade, improving sustainability in facilities. This initiative builds on the Industrial Standardization Act, which governs JIS product and test standards, ensuring quality in construction and safety for recreational facilities.
Local governments utilise funding from the Sports Agency of Japan to enhance community sports facilities. This support enables schools and clubs to upgrade their sports infrastructure, directly benefiting local users.
Future Insight of the Japan Recreational Facilities Market
Community sports complexes will play a crucial role in public health as local governments launch programs that promote active lifestyles. By 2032, recreational facilities will increasingly incorporate advanced technology, including virtual reality training programs, to engage users and attract a wider demographic. Adventure tourism will flourish, driven by the Japan Tourism Agency's campaigns that encourage outdoor activities, creating new revenue opportunities. The implementation of JIS standards will enhance safety and construction quality, benefiting both buyers and suppliers in the recreational market.
Market Segmentation Analysis
Japan Recreational Facilities Market report covers a detailed analysis of the following market segments:
By Facility Type – Fitness Centers Lead, Adventure Parks Expected to Grow Fastest
According to Saurav Kr Singh, Senior Research Analyst at 6Wresearch, the largest facility type category in 2025 was Fitness Centers, at 47% of revenue. Fitness centers dominate the market due to their extensive reach, with over 30,000 facilities serving a wide range of users across Japan. Their role in promoting physical fitness is especially significant in urban areas like Tokyo and Osaka, where health awareness is prevalent. The quickest growth will come from Adventure Parks, forecast to expand at a CAGR of 8.4% between 2026 and 2032. Adventure parks are witnessing rapid growth, drawing millions of visitors each year, particularly during holidays, reflecting a heightened demand for family-oriented recreational activities. This surge is further encouraged by the Japan Tourism Agency's focus on promoting adventure tourism as a vital sector. Suppliers should prioritise enhancing offerings in adventure parks to effectively engage the expanding leisure tourist demographic.
By Facility Size – Tiered Memberships Lead, Theme-Sized Expected to Grow Fastest
Tiered Memberships held 40% of the Japan Recreational Facilities Market by facility size in 2025. Tiered memberships lead the market as they provide pricing flexibility, appealing to a broad range of fitness center users. This model accommodates varying commitment levels, making it attractive for both casual and dedicated gym-goers. Over 2026–2032, Theme-Sized is expected to post the fastest growth, at a CAGR of 8.3%. Theme-sized facilities are experiencing the fastest growth due to their alignment with larger entertainment venues that cater to diverse audiences. This growth is indicative of a trend towards more immersive recreational experiences. Providers should consider developing larger, theme-sized facilities to meet the increasing demand for unique entertainment options.
By Booking Model – Monthly/Annual Leads, Ticket-Based Expected to Grow Fastest
Monthly/Annual accounted for 43% of the market by booking model in 2025. The monthly and annual booking model is widely adopted as it provides a clear payment structure for fitness services, making it accessible for regular users. This model is particularly advantageous for gym-goers who appreciate predictable budgeting for their fitness routines. Ticket-Based is projected to grow fastest, at a CAGR of 8.6% during 2026–2032. Ticket-based bookings are quickly gaining traction, especially in adventure parks, as they offer flexibility for visitors seeking spontaneous leisure options. This trend corresponds with the rising demand for on-demand entertainment experiences. Operators should improve ticket-based offerings to attract more spontaneous visitors to adventure parks.
By End User – Gym-Goers Lead, Leisure Tourists Expected to Grow Fastest
With 42% of end user revenue in 2025, Gym-Goers was the largest category. Gym-goers constitute the largest user group, being the primary consumers of fitness centres that cater to their health and wellness needs. This segment is vital for sustaining the fitness industry in Japan, especially given the country's emphasis on physical health. Leisure Tourists are set to record the highest CAGR in this split, 8.5% over 2026–2032. Leisure tourists are emerging as the fastest-growing segment, particularly in adventure parks, as they seek distinctive experiences during their travels. This growth is supported by the increase in leisure tourists visiting Japan, which reached 31.9 million in 2019. Businesses should customise their services to appeal to leisure tourists, leveraging their increasing presence in recreational facilities.
Key Attractiveness of the Report
- 10 Years of Market Numbers
- Historical Data Starting from 2022 to 2025
- Base Year 2025
- Forecast Data until 2032
- Key Performance Indicators Impacting the Market
- Major Upcoming Developments and Projects
Key Highlights of the Report:
- Japan Recreational Facilities Market Outlook
- Market Size of Japan Recreational Facilities Market, 2025
- Forecast of Japan Recreational Facilities Market, 2032
- Historical Data and Forecast of Japan Recreational Facilities Revenues & Volume for the Period 2022-2032F
- Japan Recreational Facilities Market Trend Evolution
- Japan Recreational Facilities Market Drivers and Challenges
- Japan Recreational Facilities Price Trends
- Japan Recreational Facilities Porter's Five Forces
- Japan Recreational Facilities Industry Life Cycle
- Historical Data and Forecast of Japan Recreational Facilities Market Revenues & Volume By Facility Type for the Period 2022-2032F
- Historical Data and Forecast of Japan Recreational Facilities Market Revenues & Volume By Fitness Centers for the Period 2022-2032F
- Historical Data and Forecast of Japan Recreational Facilities Market Revenues & Volume By Adventure Parks for the Period 2022-2032F
- Historical Data and Forecast of Japan Recreational Facilities Market Revenues & Volume By Community Sports Complex for the Period 2022-2032F
- Historical Data and Forecast of Japan Recreational Facilities Market Revenues & Volume By Marina & Boat Docks for the Period 2022-2032F
- Historical Data and Forecast of Japan Recreational Facilities Market Revenues & Volume By Facility Size for the Period 2022-2032F
- Historical Data and Forecast of Japan Recreational Facilities Market Revenues & Volume By Tiered Memberships for the Period 2022-2032F
- Historical Data and Forecast of Japan Recreational Facilities Market Revenues & Volume By Theme-Sized for the Period 2022-2032F
- Historical Data and Forecast of Japan Recreational Facilities Market Revenues & Volume By Local to Regional for the Period 2022-2032F
- Historical Data and Forecast of Japan Recreational Facilities Market Revenues & Volume By Waterfront for the Period 2022-2032F
- Historical Data and Forecast of Japan Recreational Facilities Market Revenues & Volume By Booking Model for the Period 2022-2032F
- Historical Data and Forecast of Japan Recreational Facilities Market Revenues & Volume By Monthly/Annual for the Period 2022-2032F
- Historical Data and Forecast of Japan Recreational Facilities Market Revenues & Volume By Ticket-Based for the Period 2022-2032F
- Historical Data and Forecast of Japan Recreational Facilities Market Revenues & Volume By Block Booking for the Period 2022-2032F
- Historical Data and Forecast of Japan Recreational Facilities Market Revenues & Volume By Lease/Transient for the Period 2022-2032F
- Historical Data and Forecast of Japan Recreational Facilities Market Revenues & Volume By End User for the Period 2022-2032F
- Historical Data and Forecast of Japan Recreational Facilities Market Revenues & Volume By Gym-Goers for the Period 2022-2032F
- Historical Data and Forecast of Japan Recreational Facilities Market Revenues & Volume By Leisure Tourists for the Period 2022-2032F
- Historical Data and Forecast of Japan Recreational Facilities Market Revenues & Volume By Schools & Clubs for the Period 2022-2032F
- Historical Data and Forecast of Japan Recreational Facilities Market Revenues & Volume By Boating Enthusiasts for the Period 2022-2032F
- Japan Recreational Facilities Import Export Trade Statistics
- Market Opportunity Assessment By Facility Type
- Market Opportunity Assessment By Facility Size
- Market Opportunity Assessment By Booking Model
- Market Opportunity Assessment By End User
- Japan Recreational Facilities Top Companies Market Share
- Japan Recreational Facilities Competitive Benchmarking By Technical and Operational Parameters
- Japan Recreational Facilities Company Profiles
- Japan Recreational Facilities Key Strategic Recommendations
Market Covered
The study includes the following segmentation.
By Facility Type
- Fitness Centers
- Adventure Parks
- Community Sports Complex
- Marina & Boat Docks
By Facility Size
- Tiered Memberships
- Theme-Sized
- Local to Regional
- Waterfront
By Booking Model
- Monthly/Annual
- Ticket-Based
- Block Booking
- Lease/Transient
By End User
- Gym-Goers
- Leisure Tourists
- Schools & Clubs
- Boating Enthusiasts































