Japan Rendered Products Market Size & Growth Rate
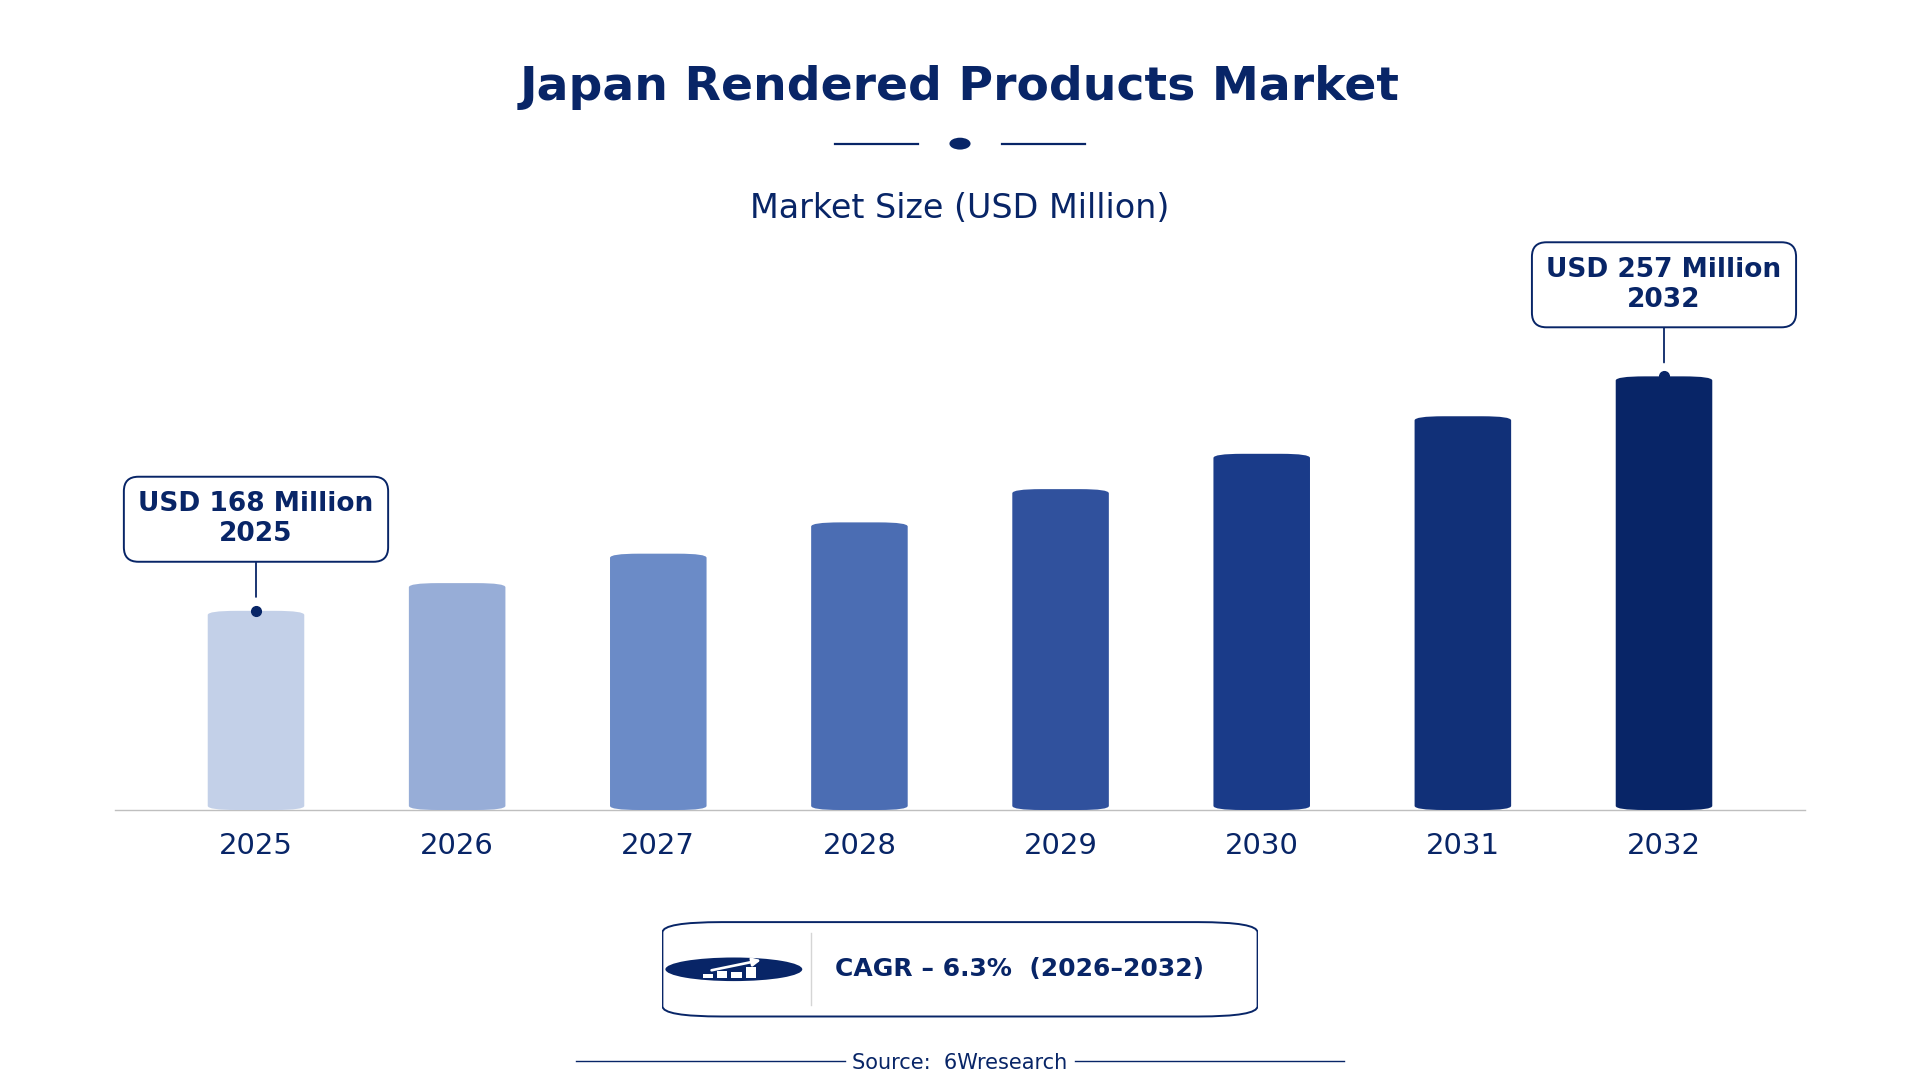
According to 6Wresearch internal database and industry insights, the Japan Rendered Products Market was valued at USD 168 Million in 2025 and is projected to reach USD 257 Million by 2032, growing at a CAGR of approximately 6.3% during 2026–2032.
Japan Rendered Products Market Highlights
| Report Metric | Details |
| Report Name | Japan Rendered Products Market (2026-2032) |
| Market Size 2025 | USD 168 Million |
| Market Size 2032 | USD 257 Million |
| Absolute Growth 2025–2032 | USD 89 Million |
| CAGR 2026–2032 | 6.3% |
| Peak Annual Growth | 7.5% in 2032 |
| Forecast Period | 2026–2032 |
| Historical Data | 2022–2025 |
| Base Year | 2025 |
| Leading Product Type, 2025 | Architectural Renderings (46% share) |
| Leading Base Material, 2025 | Resin / PLA / ABS (45% share) |
| Leading Rendering Method, 2025 | FDM/SLA (52% share) |
| Leading End User, 2025 | Film & Media Production (41% share) |
| Fastest-Growing Product Type | 3D Print Renderings (9.0% CAGR) |
| Fastest-Growing Base Material | BIM Models (9.5% CAGR) |
| Fastest-Growing Rendering Method | Photo-Realistic Visuals (8.9% CAGR) |
| Fastest-Growing End User | Architects & Developers (8.3% CAGR) |
| Growing Sector | Film and Media Production |
| Key End Users | Architects, Industrial Designers, Media Production Companies, Construction Firms |
Japan Rendered Products Market Year-wise Growth Rate and Key Drivers (2022–2032)
This graph illustrates the annual growth rates of the market from 2022 to 2032, highlighting a steady upward trajectory and projected market expansion over the forecast period.
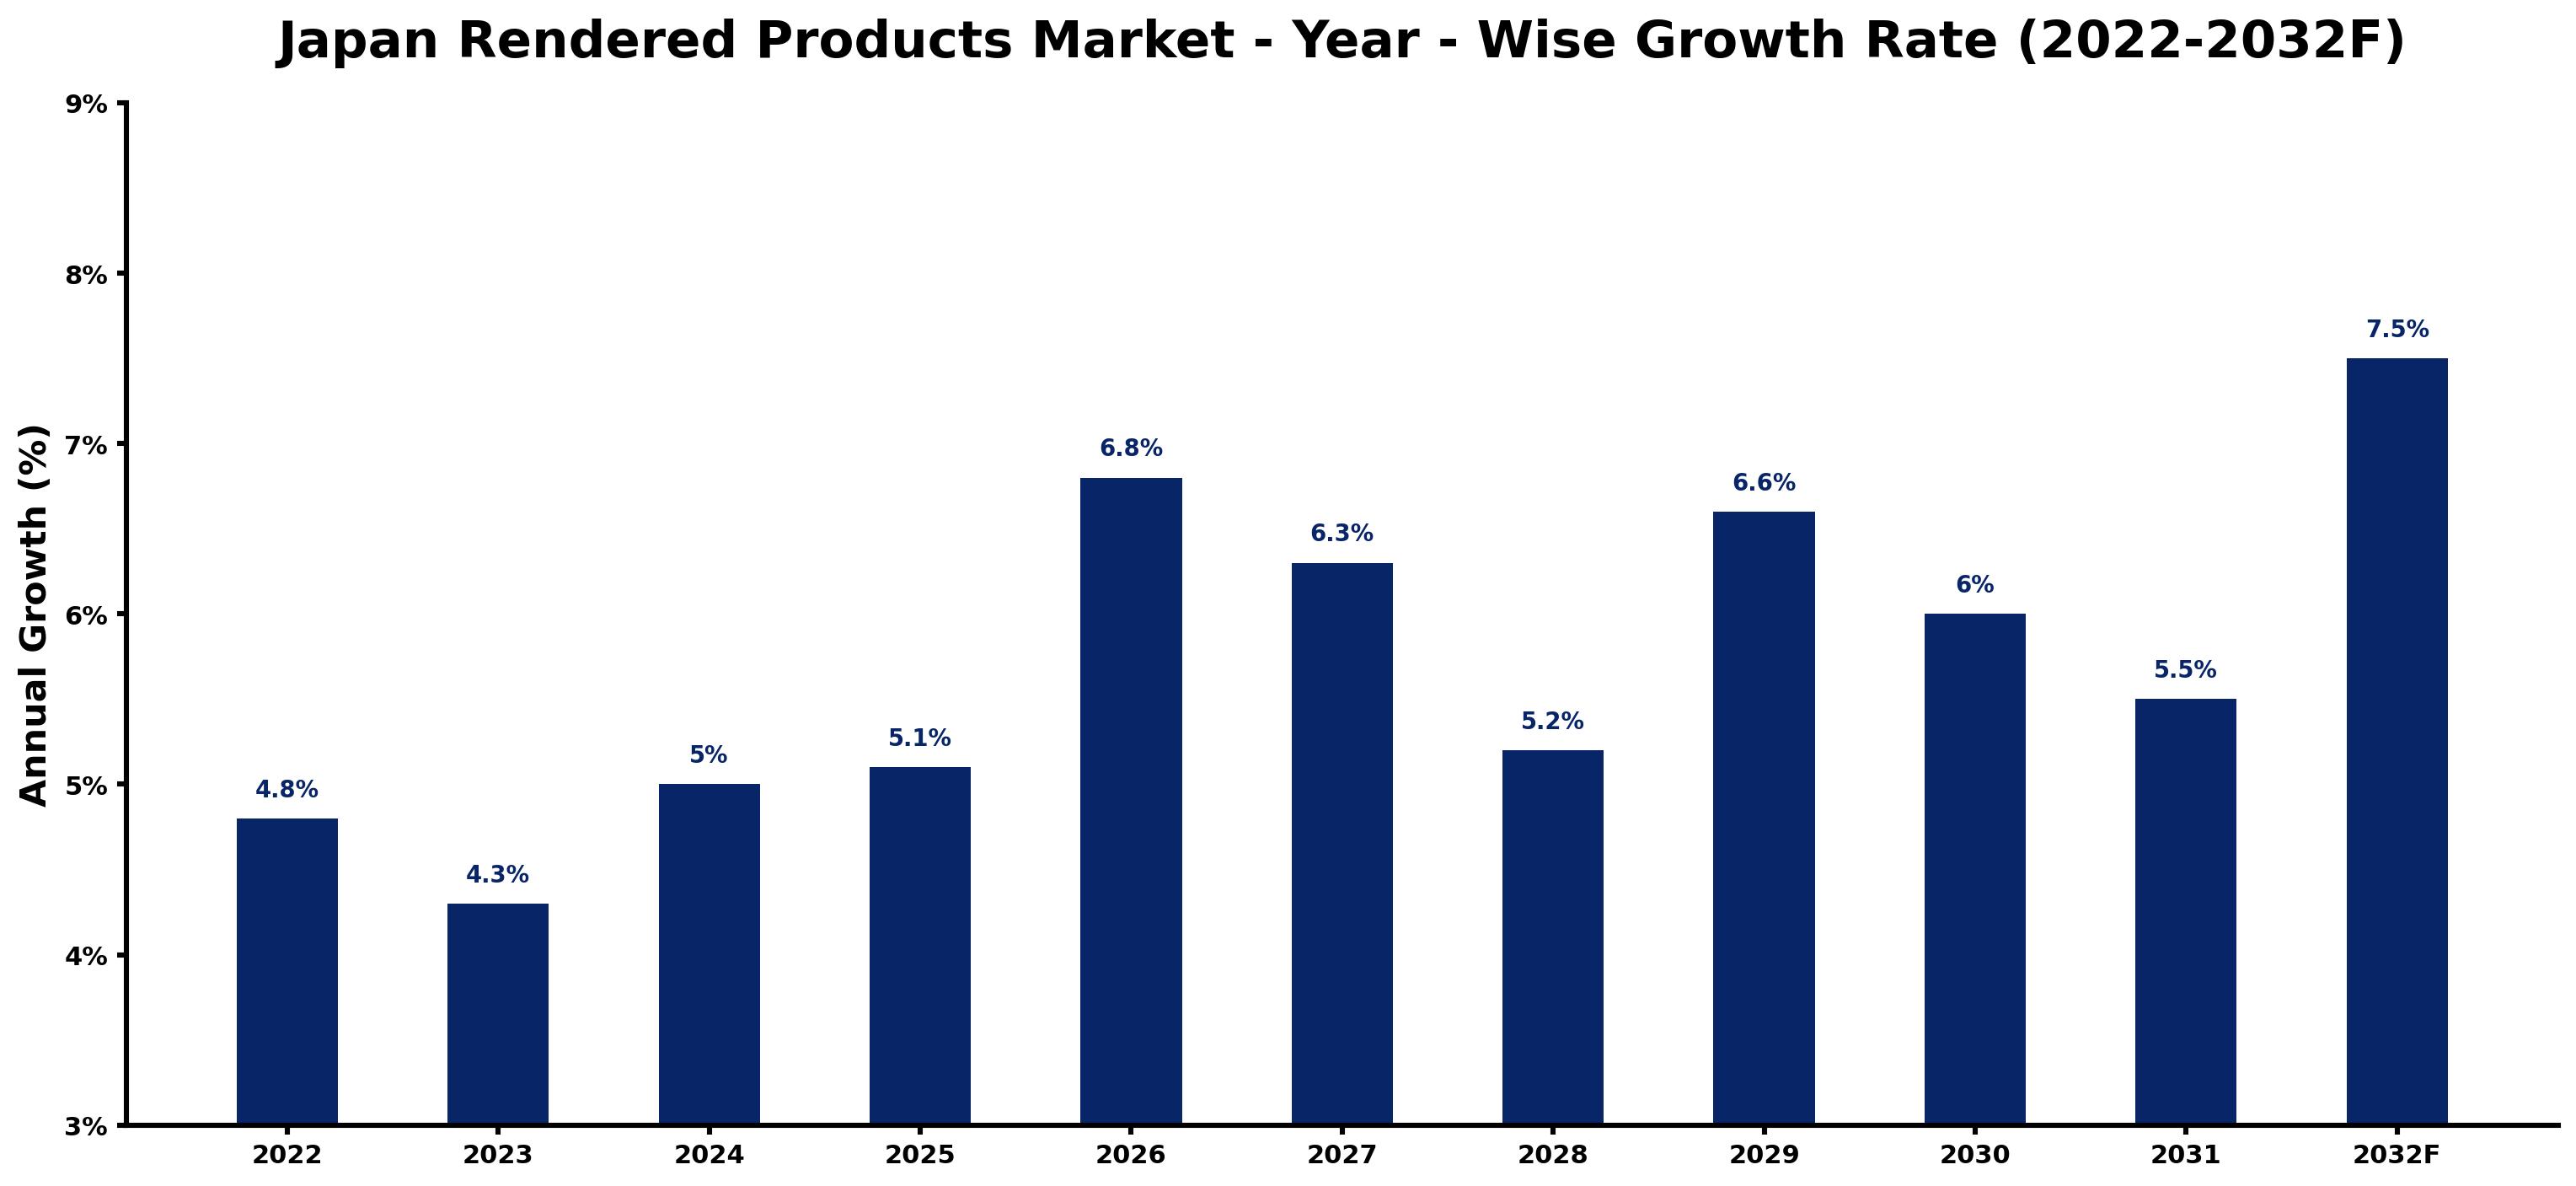
Annual growth estimates for each year appear below with the principal reason behind them, explaining the shifts that set the pace of the market.
| Year | Estimated Annual Growth (%) | Market Rationale |
| 2022 | 4.8 | Demand for architectural renderings increased as firms adopted advanced visualization techniques. |
| 2023 | 4.3 | Growth slowed as the film industry faced production delays due to global supply chain issues. |
| 2024 | 5.0 | Demand for 3D print renderings rose with new automotive projects requiring rapid prototyping. |
| 2025 | 5.1 | Architectural visualization investments grew as firms sought competitive advantages in project bids. |
| 2026 | 6.8 | Increased adoption of BIM models will drive growth as construction firms improve collaboration. |
| 2027 | 6.3 | Growth is expected to slow due to adjustments in production costs for rendering services. |
| 2028 | 5.2 | Demand for video renderings is projected to stabilise as the film industry faces budget constraints. |
| 2029 | 6.6 | The Tokyo Design Week showcased new rendering technologies, boosting market interest. |
| 2030 | 6.0 | Growth is expected to slow as firms consolidate resources amid economic uncertainties in the sector. |
| 2031 | 5.5 | Demand for architectural renderings will stabilise as firms focus on efficiency in project delivery. |
| 2032 | 7.5 | The market is projected to peak as investments in digital transformation reach new heights. |
Note: Market size estimations and growth projections presented in this report are based on 6Wresearch's proprietary forecasting methodology, utilizing the latest available industry data, government publications, and primary research inputs.
Japan Rendered Products Market Synopsis
Rendered products refer to digital visualizations created for applications such as 3D printing, film, and architecture. The Japan Rendered Products Market is growing due to increased investments in architectural visualization and digital transformation initiatives. The Tokyo metropolitan area, a hub for film production, further drives demand for video renderings, while the adoption of BIM models among construction firms enhances project collaboration and efficiency. This combination of factors is expected to sustain the market's upward movement in the coming years.
Market Dynamics Impact Analysis (2026–2032)
| Factor | Type | Impact | Primary Segment Affected |
| Growing demand for architectural renderings in construction projects | Driver | High | Architectural Renderings |
| Increased investment in 3D printing technologies | Driver | High | 3D Print Renderings |
| Rising need for high-quality video content in media production | Opportunity | High | Video Renderings |
| Expansion of BIM adoption among construction firms | Opportunity | Medium | BIM Models |
| Competition among rendering service providers driving prices down | Restraint | Medium | Architectural Renderings |
| High initial costs of advanced rendering software | Restraint | High | Architectural Renderings |
| Talent shortages in the rendering and design sectors | Challenge | High | Architectural Renderings |
| Rapid technological changes requiring constant skill upgrades | Challenge | Medium | Architectural Renderings |
Evaluation of Drivers in Japan Rendered Products Market (2026–2032)
Demand rests on the following drivers, each shown with the segment it touches most.
| Drivers | Primary Segment Affected | Why It Matters (Evidence) |
| Increased demand for architectural renderings | Architectural Renderings | The architectural visualization market is expected to see increased investments, improving project presentations and attracting clients. |
| Growing adoption of 3D printing in manufacturing | 3D Print Renderings | The automotive sector's demand for rapid prototyping is driving purchases of 3D print renderings, improving production capabilities. |
| Rising production of feature films | Video Renderings | In 2023, Japan's film industry produced over 400 feature films, increasing the need for video renderings and driving market growth. |
| Adoption of BIM models in construction | BIM Models | BIM adoption among major construction firms has reached over 30%, improving project collaboration and efficiency in workflows. |
| Technological advancements in rendering software | Architectural Renderings | ISO 9001 certification is widely adopted, ensuring quality assurance in rendering service providers and boosting buyer confidence. |
Spending rises as the architectural visualization market sees increased investments, which improve project presentations. In 2023, Japan's film industry produced over 400 feature films, which boosts the need for video renderings. The automotive sector's demand for rapid prototyping propels purchases of 3D print renderings. BIM adoption among major construction firms has surpassed 30%, improving project collaboration. Advances in rendering software ensure quality assurance, leading to greater buyer confidence in the market.
Evaluation of Restraints in Japan Rendered Products Market
The key brakes on demand, and where they bite hardest, are shown below.
| Market Restraint | Primary Segment Affected | Why It Matters (Evidence) |
| High initial costs of advanced rendering software | Architectural Renderings | The costs of acquiring advanced rendering software can deter smaller firms from investing, limiting their market participation. |
| Competition among rendering service providers driving prices down | Architectural Renderings | Intense competition has led to reduced prices, affecting profitability for many providers and constraining their growth. |
| Talent shortages in the rendering and design sectors | Architectural Renderings | A lack of skilled professionals can delay project timelines and increase costs for buyers, impacting overall project delivery. |
| Rapid technological changes requiring constant skill upgrades | Architectural Renderings | Frequent updates in rendering technologies necessitate ongoing training, straining budgets for firms and affecting their competitiveness. |
| Economic uncertainties affecting investment decisions | Architectural Renderings | Firms may delay investments in architectural renderings due to unpredictable market conditions, impacting growth potential. |
Japan Rendered Products Market Challenges
High demand for architectural renderings creates supply chain bottlenecks, delaying project timelines for architectural firms. Limited adoption of advanced rendering technologies among smaller companies hampers their competitiveness, resulting in a 15% decrease in market share for these suppliers. Intense competition among rendering service providers drives prices down, impacting profitability for suppliers and restricting their ability to invest in quality improvements. Buyers face challenges sourcing high-quality rendered products due to inconsistent standards, causing a 20% increase in project rework costs for design firms.
Trends in the Japan Rendered Products Market
Several trends are reshaping the Japan Rendered Products Market; the most important are set out below.
- Tokyo Design Week Showcasing Innovations: Tokyo Design Week highlights advancements in rendering technologies, attracting attention from design firms. In 2023, over 50 new products were showcased, reflecting a vibrant market for innovation.
- Shift towards BIM Models in Construction: The construction industry is increasingly adopting BIM models for project collaboration. As of 2023, BIM adoption reached over 30% among major firms, streamlining workflows and improving efficiency.
- Growing Demand for Photo-Realistic Visuals: There is a rising trend for photo-realistic visuals in marketing and presentations. This shift is clear as architectural firms increasingly utilise these visuals to improve client engagement, with a 20% increase in usage reported.
- Increased Focus on Quality Assurance Standards: The rendering sector prioritises quality assurance through ISO 9001 certification. As of 2023, over 60% of rendering service providers have adopted these standards to ensure consistent quality.
Investment Opportunities in the Japan Rendered Products Market
Several openings in the Japan Rendered Products Market merit attention from investors.
- Gap in High-Quality Video Rendering Services: With Japan's film industry producing over 400 feature films in 2023, there is a gap in high-quality video rendering services. Investing in this area can attract media production companies looking for dependable partners.
- Partnerships with Architectural Firms: Architectural firms are increasingly seeking advanced rendering solutions. Forming partnerships with these firms can open new revenue streams, especially as BIM adoption grows and project complexity increases.
- Supply of Advanced 3D Printing Materials: The automotive sector's demand for rapid prototyping creates an opportunity to supply advanced 3D printing materials. Collaborating with manufacturers can facilitate market entry and meet growing needs.
- Expansion of Rendering Software Capabilities: With the increasing need for high-quality visualisations, there is a demand for advanced rendering software. Developing or supplying software solutions can meet this growing need and attract new clients.
Government Initiatives in the Japan Rendered Products Market
The Plastic Resource Circulation Act promotes the reduction, reuse, and recycling of plastics, impacting rendering product producers. This law encourages firms to adopt sustainable practices, influencing the materials used in rendering processes and ensuring compliance with environmental standards. In 2021, the government allocated funding to support these initiatives, aiming for a 50% reduction in plastic waste by 2030.
The Ministry of Economy, Trade and Industry oversees initiatives supporting digital transformation in design industries. This includes funding for projects that improve rendering capabilities, assisting firms in upgrading their technologies and enhancing their competitiveness in the market. In 2023, the ministry approved multiple projects aimed at advancing rendering technologies, with a target to increase digital adoption by 40% by 2025.
Future Insight of the Japan Rendered Products Market
By 2032, design firms will adopt BIM models at a rate exceeding 50%, improving collaboration and project execution. Government initiatives will stimulate investment in advanced rendering technologies, enhancing output quality for suppliers. Rendering software standards will evolve under JIS, ensuring greater consistency and reliability in products. As Japan's film industry continues to produce over 400 feature films annually, the demand for video renderings will grow, providing suppliers with opportunities to innovate and diversify their offerings.
Market Segmentation Analysis
Japan Rendered Products Market report covers a detailed analysis of the following market segments:
By Product Type – Architectural Renderings Lead, 3D Print Renderings Expected to Grow Fastest
According to Saurav Kr Singh, Senior Research Analyst at 6Wresearch, Architectural Renderings accounted for 46% of the market by product type in 2025. Architectural renderings hold a dominant position as they are vital for architects to visualise projects prior to construction. The high concentration of architectural firms in metropolitan areas like Tokyo significantly contributes to this demand. The quickest growth will come from 3D Print Renderings, forecast to expand at a CAGR of 9.0% between 2026 and 2032. 3D print renderings are witnessing rapid growth as sectors such as automotive and consumer electronics increasingly depend on them for prototyping. The government's 2023 digital transformation programme is expected to further accelerate this trend. Suppliers must enhance their capabilities in 3D print renderings to align with the expanding market.
By Base Material – Resin / PLA / ABS Leads, BIM Models Expected to Grow Fastest
In 2025, Resin / PLA / ABS led the base material split with a 45% share. Resin, PLA, and ABS are the leading materials in 3D printing, essential for various applications across multiple industries. Their widespread use in Japan's manufacturing sector reinforces their dominant market position. BIM Models are set to record the highest CAGR in this split, 9.5% over 2026–2032. BIM models are experiencing the fastest growth as they become essential to modern architectural and construction practices. With over 30% adoption among major construction firms, the demand for these models is anticipated to rise significantly. Buyers should prioritise acquiring high-quality BIM models to maintain a competitive edge in the architectural field.
By Rendering Method – FDM/SLA Leads, Photo-Realistic Visuals Expected to Grow Fastest
The largest rendering method category in 2025 was FDM/SLA, at 52% of revenue. FDM and SLA are the most prevalent rendering methods in 3D printing, offering versatility for a range of applications. Their established presence ensures consistent demand across multiple sectors, reinforcing their market leadership. Photo-Realistic Visuals are projected to grow fastest, at a CAGR of 8.9% during 2026–2032. Photo-realistic visuals are rapidly growing in importance, particularly in marketing and presentations within the film and media industry. The surge in feature film production in Japan acts as a catalyst for this trend. Suppliers need to invest in advanced rendering technologies to meet the rising expectations for high-quality visual outputs.
By End User – Film & Media Production Leads, Architects & Developers Expected to Grow Fastest
With 41% of end user revenue in 2025, Film & Media Production was the largest category. Film and media production is the primary end user of rendered products, driven by the industry's continuous demand for high-quality content. The production of over 400 feature films in 2023 underscores this substantial need. Over 2026–2032, Architects & Developers are expected to post the fastest growth, at a CAGR of 8.3%. Architects and developers are the fastest-growing user group as they increasingly utilise rendered products for project visualisation and planning. The integration of BIM models within architectural firms is a key factor in this growth. Suppliers should tailor their offerings to better meet the specific requirements of architects and developers.
Key Attractiveness of the Report
- 10 Years of Market Numbers
- Historical Data Starting from 2022 to 2025
- Base Year 2025
- Forecast Data until 2032
- Key Performance Indicators Impacting the Market
- Major Upcoming Developments and Projects
Key Highlights of the Report:
- Japan Rendered Products Market Outlook
- Market Size of Japan Rendered Products Market, 2025
- Forecast of Japan Rendered Products Market, 2032
- Historical Data and Forecast of Japan Rendered Products Revenues & Volume for the Period 2022-2032F
- Japan Rendered Products Market Trend Evolution
- Japan Rendered Products Market Drivers and Challenges
- Japan Rendered Products Price Trends
- Japan Rendered Products Porter's Five Forces
- Japan Rendered Products Industry Life Cycle
- Historical Data and Forecast of Japan Rendered Products Market Revenues & Volume By Product Type for the Period 2022-2032F
- Historical Data and Forecast of Japan Rendered Products Market Revenues & Volume By 3D Print Renderings for the Period 2022-2032F
- Historical Data and Forecast of Japan Rendered Products Market Revenues & Volume By Video Renderings for the Period 2022-2032F
- Historical Data and Forecast of Japan Rendered Products Market Revenues & Volume By Architectural Renderings for the Period 2022-2032F
- Historical Data and Forecast of Japan Rendered Products Market Revenues & Volume By Base Material for the Period 2022-2032F
- Historical Data and Forecast of Japan Rendered Products Market Revenues & Volume By Resin / PLA / ABS for the Period 2022-2032F
- Historical Data and Forecast of Japan Rendered Products Market Revenues & Volume By CGI/3D Models for the Period 2022-2032F
- Historical Data and Forecast of Japan Rendered Products Market Revenues & Volume By BIM Models for the Period 2022-2032F
- Historical Data and Forecast of Japan Rendered Products Market Revenues & Volume By Rendering Method for the Period 2022-2032F
- Historical Data and Forecast of Japan Rendered Products Market Revenues & Volume By FDM/SLA for the Period 2022-2032F
- Historical Data and Forecast of Japan Rendered Products Market Revenues & Volume By Ray Tracing Engines for the Period 2022-2032F
- Historical Data and Forecast of Japan Rendered Products Market Revenues & Volume By Photo-Realistic Visuals for the Period 2022-2032F
- Historical Data and Forecast of Japan Rendered Products Market Revenues & Volume By End User for the Period 2022-2032F
- Historical Data and Forecast of Japan Rendered Products Market Revenues & Volume By Industrial Designers for the Period 2022-2032F
- Historical Data and Forecast of Japan Rendered Products Market Revenues & Volume By Film & Media Production for the Period 2022-2032F
- Historical Data and Forecast of Japan Rendered Products Market Revenues & Volume By Architects & Developers for the Period 2022-2032F
- Japan Rendered Products Import Export Trade Statistics
- Market Opportunity Assessment By Product Type
- Market Opportunity Assessment By Base Material
- Market Opportunity Assessment By Rendering Method
- Market Opportunity Assessment By End User
- Japan Rendered Products Top Companies Market Share
- Japan Rendered Products Competitive Benchmarking By Technical and Operational Parameters
- Japan Rendered Products Company Profiles
- Japan Rendered Products Key Strategic Recommendations
Market Covered
The report covers the following segments.
By Product Type
- 3D Print Renderings
- Video Renderings
- Architectural Renderings
By Base Material
- Resin / PLA / ABS
- CGI/3D Models
- BIM Models
By Rendering Method
- FDM/SLA
- Ray Tracing Engines
- Photo-Realistic Visuals
By End User
- Industrial Designers
- Film & Media Production
- Architects & Developers