Japan Reverse Engineering Market Size & Growth Rate
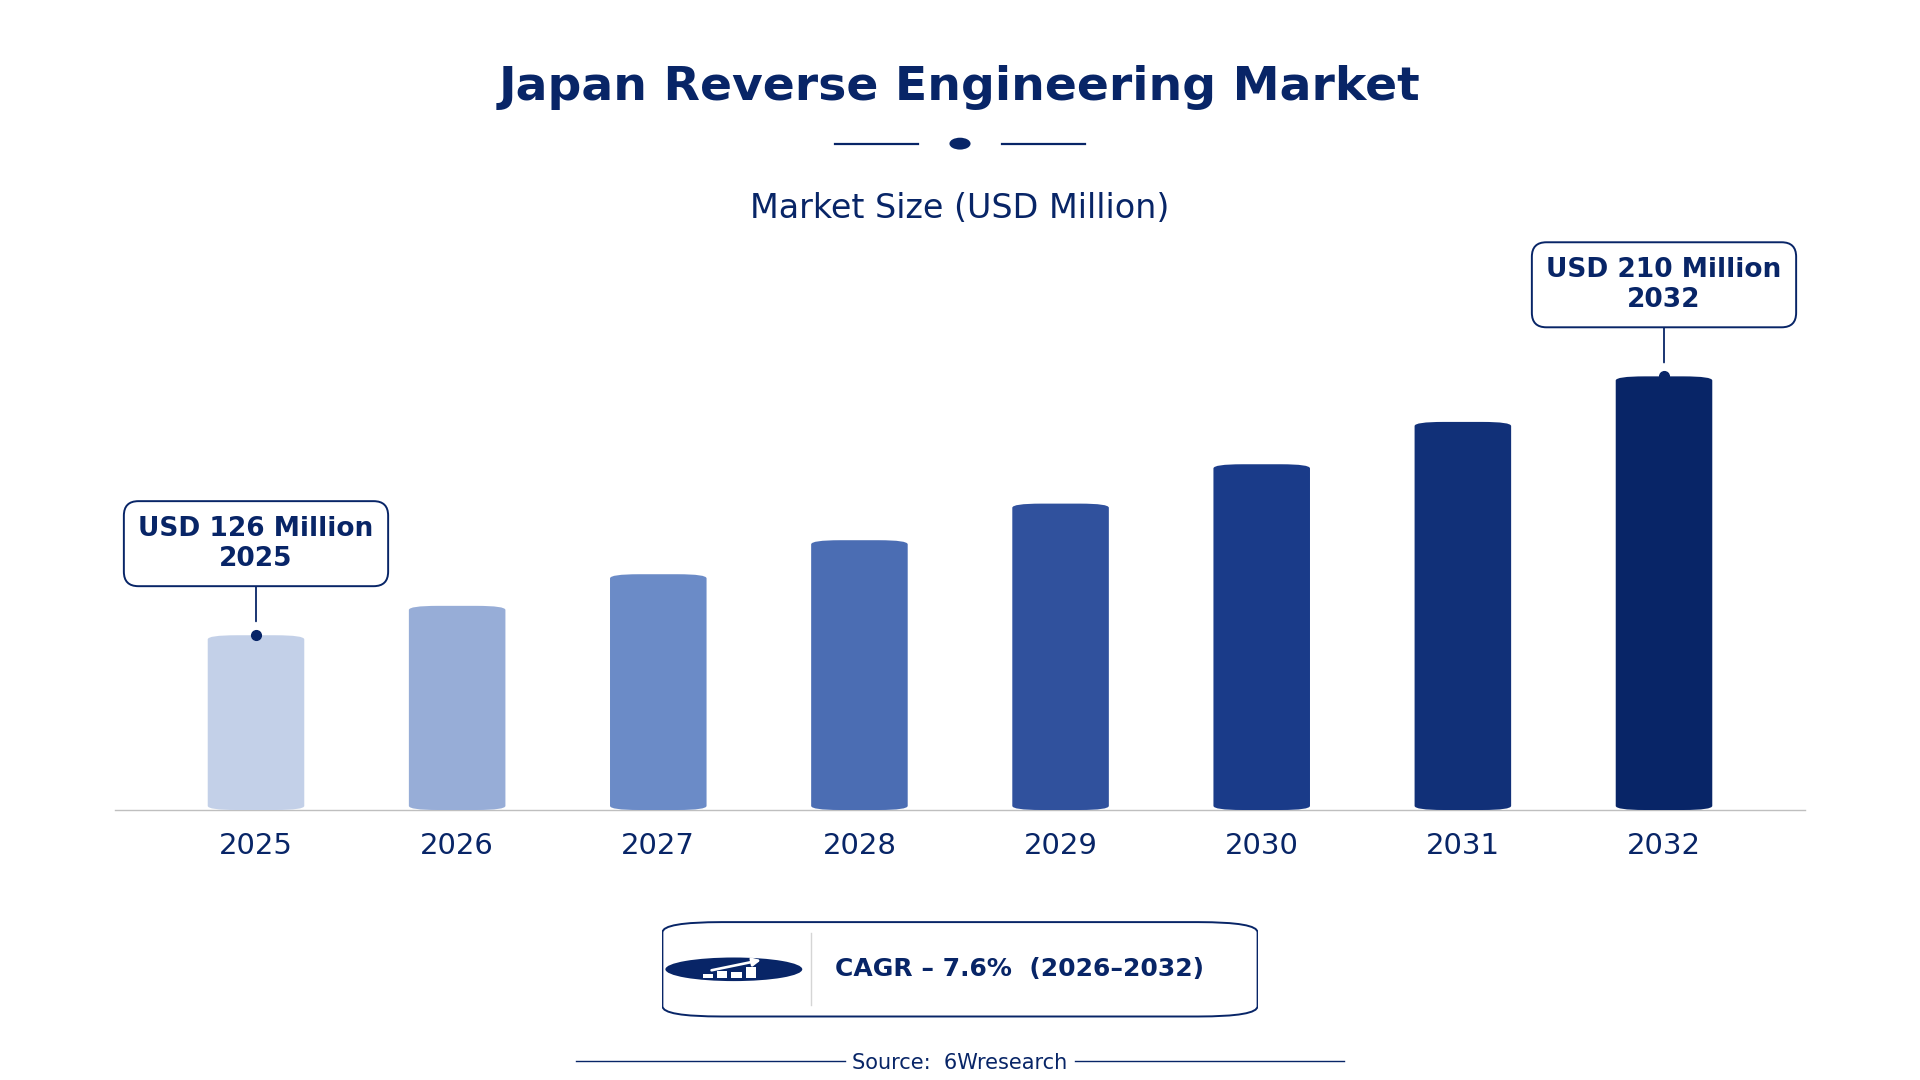
According to 6Wresearch internal database and industry insights, the Japan Reverse Engineering Market was valued at USD 126 Million in 2025 and is projected to reach USD 210 Million by 2032, growing at a CAGR of approximately 7.6% during 2026–2032.
Japan Reverse Engineering Market Highlights
| Report Metric | Details |
| Report Name | Japan Reverse Engineering Market (2026-2032) |
| Market Size 2025 | USD 126 Million |
| Market Size 2032 | USD 210 Million |
| Absolute Growth 2025–2032 | USD 84 Million |
| CAGR 2026–2032 | 7.6% |
| Peak Annual Growth | 9.2% in 2032 |
| Forecast Period | 2026–2032 |
| Historical Data | 2022–2025 |
| Base Year | 2025 |
| Leading Application, 2025 | CAD Model Creation (48% share) |
| Leading Tool Type, 2025 | 3D Scanners (39% share) |
| Leading Output Format, 2025 | Solid/Surface Models (47% share) |
| Leading End User, 2025 | Product Design Firms (39% share) |
| Fastest-Growing Application | Hardware Analysis (10.7% CAGR) |
| Fastest-Growing Tool Type | Microscopy + Imaging (10.9% CAGR) |
| Fastest-Growing Output Format | Schematic Reproduction (11.4% CAGR) |
| Fastest-Growing End User | Electronics Manufacturers (9.9% CAGR) |
| Growing Sector | Electronics Manufacturing |
| Key End Users | Electronics Manufacturers, Product Design Firms, Cybersecurity Teams, IT Departments |
Japan Reverse Engineering Market Year-wise Growth Rate and Key Drivers (2022–2032)
This graph illustrates the annual growth rates of the market from 2022 to 2032, highlighting a steady upward trajectory and projected market expansion over the forecast period.
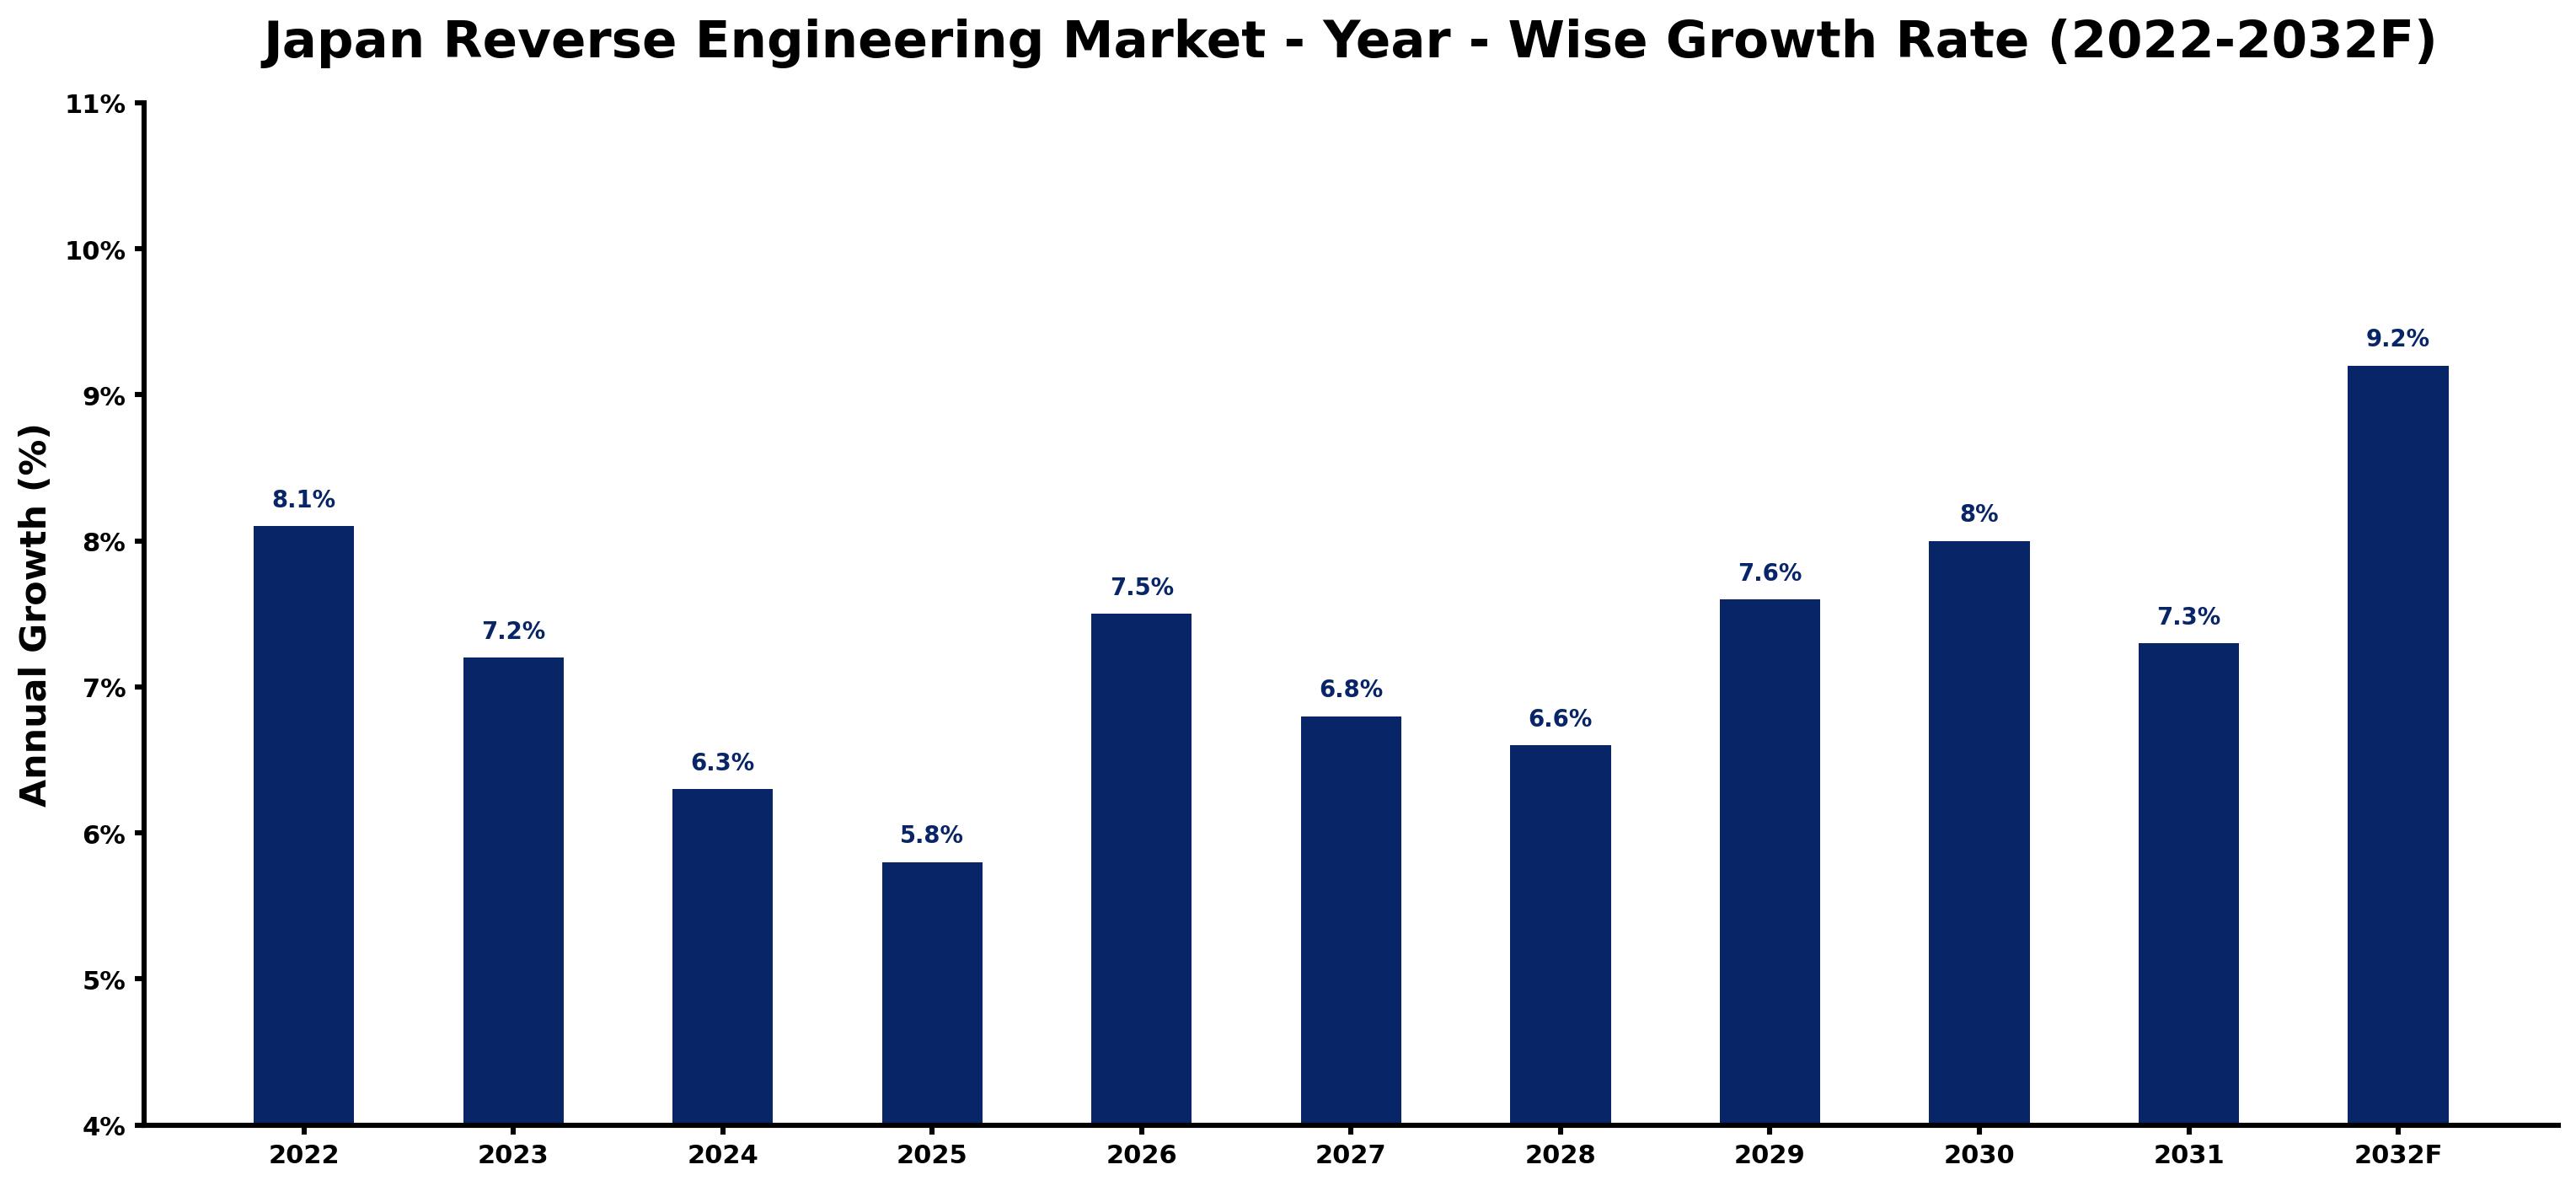
For each year, the table pairs the estimated growth rate with the leading influence on demand, showing how the drivers changed across the period.
| Year | Estimated Annual Growth (%) | Market Rationale |
| 2022 | 8.1 | The market experienced strong growth due to increased demand from electronics manufacturers. |
| 2023 | 7.2 | Growth slowed as companies adjusted to supply chain challenges and market conditions. |
| 2024 | 6.3 | Continued adjustments led to further slowing, yet demand remained steady from key sectors. |
| 2025 | 5.8 | A further slowdown occurred as the market stabilised after previous rapid growth phases. |
| 2026 | 7.5 | Growth accelerated again as investments in technology and innovation resumed. |
| 2027 | 6.8 | The market saw a slight slowdown as companies focused on optimising existing resources. |
| 2028 | 6.6 | Continued focus on innovation led to another slowdown in growth rates. |
| 2029 | 7.6 | Demand surged again as electronics manufacturers ramped up reverse engineering efforts. |
| 2030 | 8.0 | Growth continued as product design firms increased their reliance on reverse engineering. |
| 2031 | 7.3 | Another slowdown occurred as the market matured and competition intensified. |
| 2032 | 9.2 | The market peaked with strong demand from diverse sectors, particularly in cybersecurity. |
Note: Market size estimations and growth projections presented in this report are based on 6Wresearch's proprietary forecasting methodology, utilizing the latest available industry data, government publications, and primary research inputs.
Japan Reverse Engineering Market Synopsis
Reverse engineering involves analysing products to understand their design and functionality, utilising technologies like 3D scanning. This process is vital for industries such as electronics and IT, where local innovation drives competitive advantage. The Japan Reverse Engineering Market is growing due to increased demand from product design firms and electronics manufacturers, with over 50% of these companies employing reverse engineering techniques to improve product development and modernise legacy systems.
Market Dynamics Impact Analysis (2026–2032)
| Factor | Type | Impact | Primary Segment Affected |
| Increased investment in technology innovation | Driver | High | Hardware Analysis |
| Growing reliance on 3D scanning technologies | Driver | High | 3D Scanners |
| Rising demand for legacy system modernization | Opportunity | High | Legacy System Modernization |
| Expansion of reverse engineering training programs | Opportunity | Medium | Software Reverse Analysis |
| High costs associated with advanced reverse engineering tools | Restraint | High | CAD Model Creation |
| Limited availability of skilled professionals in reverse engineering | Restraint | Medium | Hardware Analysis |
| Competition from international markets | Challenge | High | Electronics Manufacturers |
| Rapid technological changes requiring constant adaptation | Challenge | Medium | Product Design Firms |
Evaluation of Drivers in Japan Reverse Engineering Market (2026–2032)
Demand rests on the following drivers, each shown with the segment it touches most.
| Drivers | Primary Segment Affected | Why It Matters (Evidence) |
| Increased investment in technology innovation | Hardware Analysis | Over 200 million USD is allocated annually for technology innovation, driving demand for advanced reverse engineering techniques. |
| Growing reliance on 3D scanning technologies | 3D Scanners | With over 30% of firms adopting 3D scanning, demand for accurate digital models is surging. |
| Focus on legacy system modernization | Legacy System Modernization | The average age of legacy systems exceeds 15 years, prompting IT departments to seek modernization solutions. |
| Cybersecurity concerns driving reverse engineering | Software Reverse Analysis | Cybersecurity incidents rose by 30% in 2022, increasing the need for reverse engineering to identify vulnerabilities. |
| Support from educational institutions | CAD Model Creation | Reverse engineering is integrated into engineering curricula at over 20 universities, ensuring a skilled workforce. |
The strongest pull on demand comes from increased investment in technology innovation, with an annual budget of around 200 million USD dedicated to developing reverse engineering capabilities. As over 50% of electronics manufacturers employ reverse engineering techniques, the need for advanced hardware analysis grows. The average age of legacy systems in Japan exceeds 15 years, prompting IT departments to modernise. Cybersecurity incidents surged by 30% in 2022, driving demand for software reverse analysis to identify vulnerabilities. Educational institutions contribute as reverse engineering is taught in over 20 universities, ensuring a steady supply of skilled professionals.
Evaluation of Restraints in Japan Reverse Engineering Market
The main factors holding the market back are set out below.
| Market Restraint | Primary Segment Affected | Why It Matters (Evidence) |
| High costs associated with advanced reverse engineering tools | CAD Model Creation | The average investment in advanced tools can exceed 100,000 USD, limiting accessibility for smaller firms. |
| Limited availability of skilled professionals in reverse engineering | Hardware Analysis | With only a few universities offering specialised training, the workforce remains insufficient to meet demand. |
| Competition from international markets | Electronics Manufacturers | Local firms struggle to compete against international competitors that offer lower-cost solutions. |
| Rapid technological changes requiring constant adaptation | Product Design Firms | The fast pace of technological advancements necessitates continuous training and investment, straining resources. |
| Regulatory compliance costs for reverse engineering projects | Software Reverse Analysis | Compliance with standards like ISO/IEC 27001 adds costs to reverse engineering initiatives. |
Japan Reverse Engineering Market Challenges
Reverse engineering faces a lack of standardisation, complicating compatibility for buyers and potentially delaying product development by up to six months. Regulatory hurdles arise from compliance with ISO/IEC 27001, requiring suppliers to invest approximately 200,000 USD annually, which strains their budgets. Skills shortages in advanced reverse engineering techniques restrict the available workforce, causing IT departments to spend an average of 18 months modernising legacy systems. Supply chain disruptions for essential 3D scanning technology can increase costs for buyers, with over 50% of electronics manufacturers reporting project delays due to these issues.
Trends in the Japan Reverse Engineering Market
Several trends are reshaping the Japan Reverse Engineering Market; the most important are set out below.
- Shift Towards Cybersecurity Training: Cybersecurity teams are increasingly focusing on reverse engineering training, with a new program launched in 2023 to address the 30% rise in cybersecurity incidents, leading to greater demand for reverse engineering expertise.
- Growing Adoption of 3D Scanning Technologies: Over 30% of firms in Japan are now utilising 3D scanning technologies, reflecting a shift towards more accurate digital modelling. This trend is particularly strong in the Tokyo region, where product design firms are increasingly adopting these tools.
- Focus on Legacy System Modernization: As the average age of legacy systems surpasses 15 years, IT departments are prioritising modernization efforts. This trend is particularly strong among major corporations, driving demand for reverse engineering services.
- Expansion of Educational Programs in Reverse Engineering: With reverse engineering being taught in over 20 universities, there is a growing emphasis on developing a skilled workforce. This educational shift supports the increasing demand for reverse engineering in various sectors.
Investment Opportunities in the Japan Reverse Engineering Market
The openings below show where demand in the Japan Reverse Engineering Market is visible and how suppliers can enter.
- Investment in 3D Scanning Facilities: The Tokyo region is seeing increased investment in 3D scanning facilities, with over 10,000 units installed. This presents an opportunity for suppliers to provide advanced scanning technologies to local firms.
- Support for Cybersecurity Initiatives: With cybersecurity incidents increasing by 30%, there is a strong need for reverse engineering services. Electronics manufacturers are looking for partners to improve their cybersecurity measures through reverse engineering.
- Focus on Legacy System Modernization Services: As IT departments prioritise the modernization of legacy systems, there is a growing market for reverse engineering services. Companies in the electronics sector are actively seeking solutions to update outdated systems.
- Collaboration with Educational Institutions: With reverse engineering taught in over 20 universities, there is an opportunity to collaborate on research and development projects. This can lead to innovative solutions and a skilled workforce for future demands.
Government Initiatives in the Japan Reverse Engineering Market
The Semiconductor and Digital Industry Strategy has been implemented to secure domestic semiconductor manufacturing and promote innovation in reverse engineering. This strategy allocates an annual budget of around 200 million USD for technology innovation, supporting projects that improve local firms' competitiveness in the global market.
The Japan Society for Precision Engineering promotes reverse engineering technologies and approves funding for various projects aimed at improving capabilities, particularly for small and medium-sized enterprises. In 2023, a new initiative was launched to support reverse engineering projects, providing essential resources for firms looking to innovate.
Future Insight of the Japan Reverse Engineering Market
Investment in reverse engineering will surge, driven by government initiatives funding projects for SMEs and boosting training programmes. By 2032, the demand for modernising legacy systems will rise, as the average age of these systems exceeds 20 years. Increased adoption of 3D scanning technologies will create new opportunities for buyers, with the installed base of 3D scanners estimated at over 10,000 units. The focus on cybersecurity will compel suppliers to develop advanced reverse engineering capabilities, addressing a 30% rise in cybersecurity incidents.
Market Segmentation Analysis
Japan Reverse Engineering Market report covers a detailed analysis of the following market segments:
By Application – CAD Model Creation Leads, Hardware Analysis Expected to Grow Fastest
According to Saurav Kr Singh, Senior Research Analyst at 6Wresearch, with 48% of application revenue in 2025, CAD Model Creation was the largest category. CAD model creation holds the largest share due to its essential role in producing accurate digital models from physical objects, particularly in the Tokyo region where numerous design firms operate. This method is crucial for over 50% of electronics manufacturers, highlighting its importance in product development. Hardware Analysis is projected to grow fastest, at a CAGR of 10.7% during 2026–2032. Hardware analysis is experiencing rapid growth driven by the increasing need to evaluate and refine existing hardware designs, especially as cybersecurity incidents rose by 30% in 2022. This trend demonstrates a heightened focus on improving product reliability and security across various sectors. Suppliers should focus on providing advanced tools and training for hardware analysis to meet the growing demands of manufacturers.
By Tool Type – 3D Scanners Lead, Microscopy + Imaging Expected to Grow Fastest
In 2025, 3D Scanners led the tool type split with a 39% share. 3D scanners dominate the market as they are fundamental tools for capturing physical object dimensions, with an installed base of over 10,000 units in Japan. Their widespread use among product design firms underscores their importance in reverse engineering processes. Over 2026–2032, Microscopy + Imaging is expected to post the fastest growth, at a CAGR of 10.9%. Microscopy and imaging are growing rapidly as they are increasingly used for detailed analysis of small components, driven by the need for precision in electronics manufacturing. This rise indicates a shift towards more intricate analysis techniques in the reverse engineering sector. Buyers may need to invest in advanced microscopy and imaging tools to stay competitive in precision engineering.
By Output Format – Solid/Surface Models Lead, Schematic Reproduction Expected to Grow Fastest
The largest output format category in 2025 was Solid/Surface Models, at 47% of revenue. Solid and surface models are the primary outputs from reverse engineering, serving as vital documentation for product development processes. Their prevalent use among product design firms underscores their significance in the overall design and manufacturing workflow. Schematic Reproduction is set to record the highest CAGR in this split, 11.4% over 2026–2032. Schematic reproduction is quickly gaining traction as it is frequently created to document and analyse electronic circuits, reflecting the industry's emphasis on refining electronic device design. This growth indicates an increasing focus on circuit analysis within product development efforts. Suppliers should expand their product lines in schematic reproduction tools to cater to the rising demand from electronics manufacturers.
By End User – Product Design Firms Lead, Electronics Manufacturers Expected to Grow Fastest
Product Design Firms accounted for 39% of the market by end user in 2025. Product design firms are the main end users of reverse engineering, primarily utilising it for new product development in a competitive landscape. Their considerable investment in technology innovation, with an annual budget of approximately 200 million USD, illustrates their commitment to effectively leveraging reverse engineering. The quickest growth will come from Electronics Manufacturers, forecast to expand at a CAGR of 9.9% between 2026 and 2032. Electronics manufacturers are increasingly adopting reverse engineering techniques to improve and replicate electronic devices, particularly in response to rising cybersecurity threats. This trend signifies a strategic shift towards enhancing product security and functionality in the electronics sector. Suppliers must tailor their solutions to meet the specific needs of electronics manufacturers, focusing on security and efficiency.
Key Attractiveness of the Report
- 10 Years of Market Numbers
- Historical Data Starting from 2022 to 2025
- Base Year 2025
- Forecast Data until 2032
- Key Performance Indicators Impacting the Market
- Major Upcoming Developments and Projects
Key Highlights of the Report:
- Japan Reverse Engineering Market Outlook
- Market Size of Japan Reverse Engineering Market, 2025
- Forecast of Japan Reverse Engineering Market, 2032
- Historical Data and Forecast of Japan Reverse Engineering Revenues & Volume for the Period 2022-2032F
- Japan Reverse Engineering Market Trend Evolution
- Japan Reverse Engineering Market Drivers and Challenges
- Japan Reverse Engineering Price Trends
- Japan Reverse Engineering Porter's Five Forces
- Japan Reverse Engineering Industry Life Cycle
- Historical Data and Forecast of Japan Reverse Engineering Market Revenues & Volume By Application for the Period 2022-2032F
- Historical Data and Forecast of Japan Reverse Engineering Market Revenues & Volume By CAD Model Creation for the Period 2022-2032F
- Historical Data and Forecast of Japan Reverse Engineering Market Revenues & Volume By Hardware Analysis for the Period 2022-2032F
- Historical Data and Forecast of Japan Reverse Engineering Market Revenues & Volume By Software Reverse Analysis for the Period 2022-2032F
- Historical Data and Forecast of Japan Reverse Engineering Market Revenues & Volume By Legacy System Modernization for the Period 2022-2032F
- Historical Data and Forecast of Japan Reverse Engineering Market Revenues & Volume By Tool Type for the Period 2022-2032F
- Historical Data and Forecast of Japan Reverse Engineering Market Revenues & Volume By 3D Scanners for the Period 2022-2032F
- Historical Data and Forecast of Japan Reverse Engineering Market Revenues & Volume By Microscopy + Imaging for the Period 2022-2032F
- Historical Data and Forecast of Japan Reverse Engineering Market Revenues & Volume By Decompilers for the Period 2022-2032F
- Historical Data and Forecast of Japan Reverse Engineering Market Revenues & Volume By Reverse ETL for the Period 2022-2032F
- Historical Data and Forecast of Japan Reverse Engineering Market Revenues & Volume By Output Format for the Period 2022-2032F
- Historical Data and Forecast of Japan Reverse Engineering Market Revenues & Volume By Solid/Surface Models for the Period 2022-2032F
- Historical Data and Forecast of Japan Reverse Engineering Market Revenues & Volume By Schematic Reproduction for the Period 2022-2032F
- Historical Data and Forecast of Japan Reverse Engineering Market Revenues & Volume By Decompiled Code for the Period 2022-2032F
- Historical Data and Forecast of Japan Reverse Engineering Market Revenues & Volume By Data Integration for the Period 2022-2032F
- Historical Data and Forecast of Japan Reverse Engineering Market Revenues & Volume By End User for the Period 2022-2032F
- Historical Data and Forecast of Japan Reverse Engineering Market Revenues & Volume By Product Design Firms for the Period 2022-2032F
- Historical Data and Forecast of Japan Reverse Engineering Market Revenues & Volume By Electronics Manufacturers for the Period 2022-2032F
- Historical Data and Forecast of Japan Reverse Engineering Market Revenues & Volume By Cybersecurity Teams for the Period 2022-2032F
- Historical Data and Forecast of Japan Reverse Engineering Market Revenues & Volume By Enterprise IT for the Period 2022-2032F
- Japan Reverse Engineering Import Export Trade Statistics
- Market Opportunity Assessment By Application
- Market Opportunity Assessment By Tool Type
- Market Opportunity Assessment By Output Format
- Market Opportunity Assessment By End User
- Japan Reverse Engineering Top Companies Market Share
- Japan Reverse Engineering Competitive Benchmarking By Technical and Operational Parameters
- Japan Reverse Engineering Company Profiles
- Japan Reverse Engineering Key Strategic Recommendations
Market Covered
The following segment groups are covered in the report.
By Application
- CAD Model Creation
- Hardware Analysis
- Software Reverse Analysis
- Legacy System Modernization
By Tool Type
- 3D Scanners
- Microscopy + Imaging
- Decompilers
- Reverse ETL
By Output Format
- Solid/Surface Models
- Schematic Reproduction
- Decompiled Code
- Data Integration
By End User
- Product Design Firms
- Electronics Manufacturers
- Cybersecurity Teams
- Enterprise IT































