Japan Ride Systems Market Size & Growth Rate
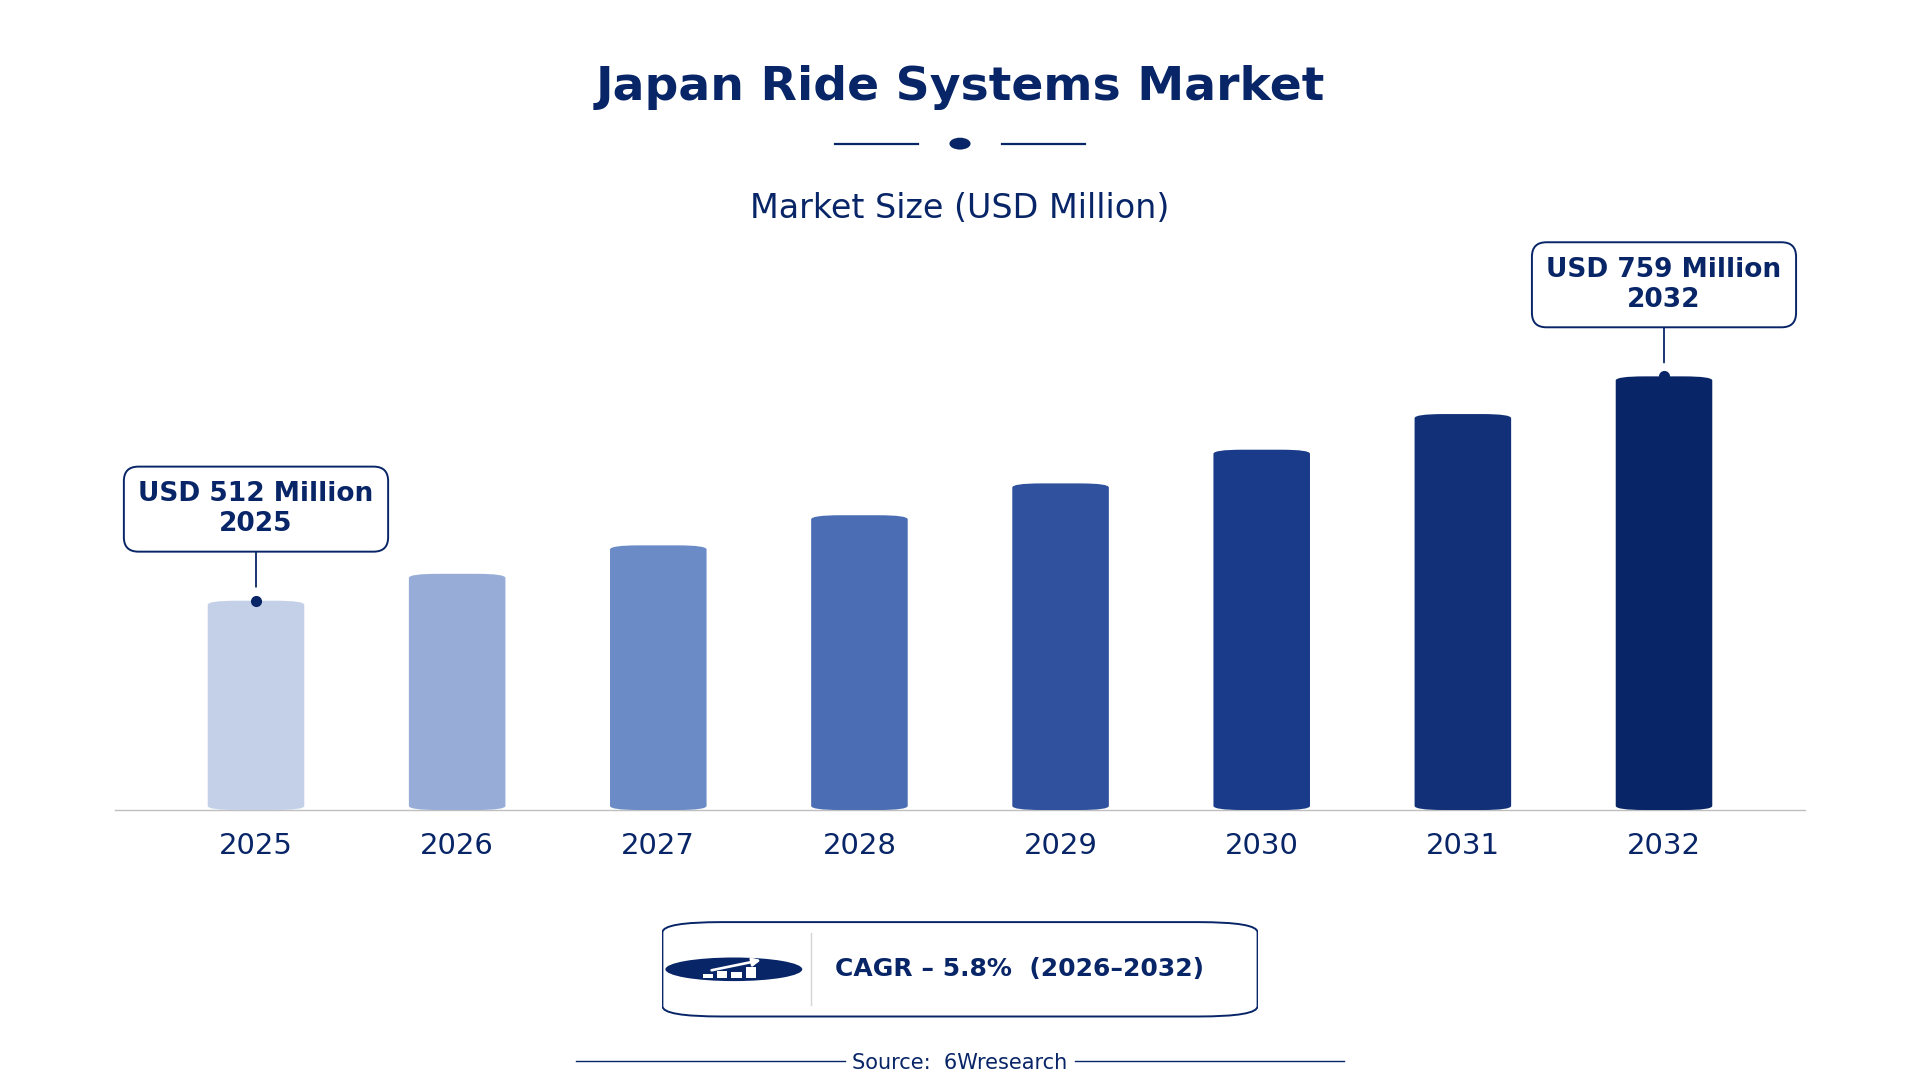
According to 6Wresearch internal database and industry insights, the Japan Ride Systems Market was valued at USD 512 Million in 2025 and is projected to reach USD 759 Million by 2032, growing at a CAGR of approximately 5.8% during 2026–2032.
Japan Ride Systems Market Highlights
| Report Metric | Details |
| Report Name | Japan Ride Systems Market (2026-2032) |
| Market Size 2025 | USD 512 Million |
| Market Size 2032 | USD 759 Million |
| Absolute Growth 2025–2032 | USD 247 Million |
| CAGR 2026–2032 | 5.8% |
| Peak Annual Growth | 7.7% in 2032 |
| Forecast Period | 2026–2032 |
| Historical Data | 2022–2025 |
| Base Year | 2025 |
| Leading Application Type, 2025 | Amusement Rides (38% share) |
| Leading Drive Mechanism, 2025 | Hydraulic (34% share) |
| Leading Control System, 2025 | Programmable Controls (45% share) |
| Leading End User, 2025 | Theme Parks (38% share) |
| Fastest-Growing Application Type | Monorail Systems (7.8% CAGR) |
| Fastest-Growing Drive Mechanism | Electric Motors (8.3% CAGR) |
| Fastest-Growing Control System | Centralized Automation (8.6% CAGR) |
| Fastest-Growing End User | Urban Transit Bodies (7.6% CAGR) |
| Growing Sector | Amusement Rides |
| Key End Users | Theme Parks, Urban Transit Bodies, Tourism Authorities, Airports |
Japan Ride Systems Market Year-wise Growth Rate and Key Drivers (2022–2032)
This graph illustrates the annual growth rates of the market from 2022 to 2032, highlighting a steady upward trajectory and projected market expansion over the forecast period.
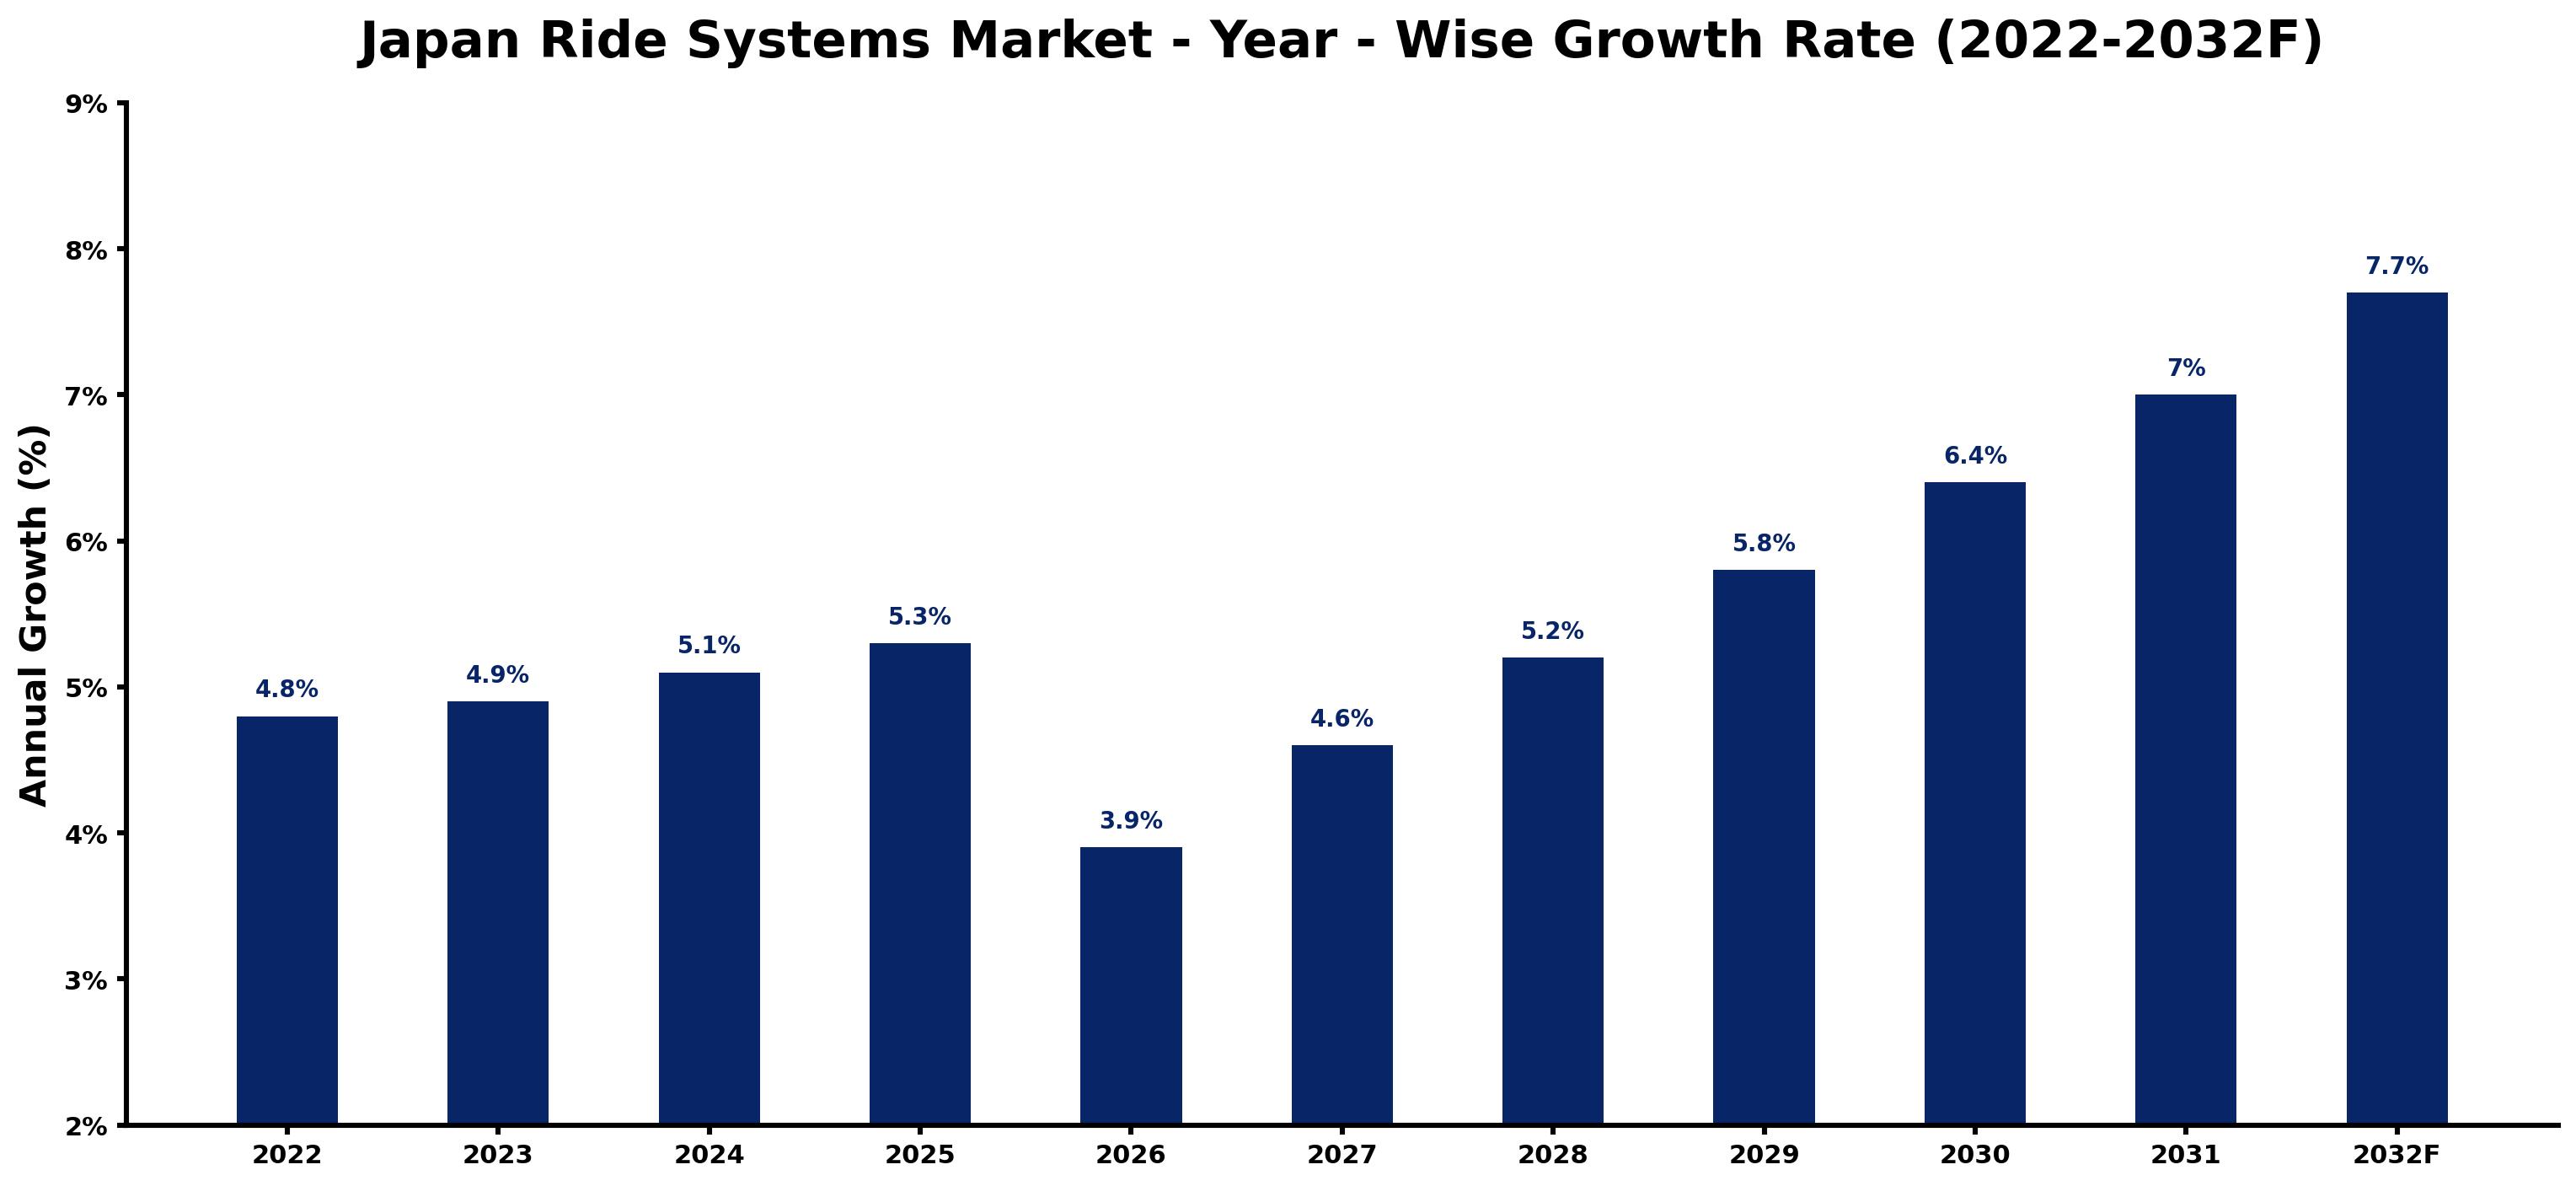
For each year, the table pairs the estimated growth rate with the leading influence on demand, showing how the drivers changed across the period.
| Year | Estimated Annual Growth (%) | Market Rationale |
| 2022 | 4.8 | The market experienced steady growth due to strong attendance at theme parks. |
| 2023 | 4.9 | Demand increased as urban transit projects gained momentum across major cities. |
| 2024 | 5.1 | Continued investment in amusement parks drove higher visitor numbers and spending. |
| 2025 | 5.3 | The peak growth year was marked by increased tourism and local engagement. |
| 2026 | 3.9 | Growth is expected to slow as some urban transit projects face delays in implementation. |
| 2027 | 4.6 | Demand is projected to rise again as urban transit bodies expand their services and reach. |
| 2028 | 5.2 | Increased focus on sustainable transport options will boost interest in monorail systems. |
| 2029 | 5.8 | The market is expected to see heightened investment in advanced ride technologies and automation. |
| 2030 | 6.4 | Growth will accelerate as urban areas prioritise efficient transit solutions. |
| 2031 | 7.0 | Demand is projected to surge with the introduction of new amusement rides and attractions. |
| 2032 | 7.7 | The market is expected to peak as tourism and local entertainment options flourish. |
Note: Market size estimations and growth projections presented in this report are based on 6Wresearch's proprietary forecasting methodology, utilizing the latest available industry data, government publications, and primary research inputs.
Japan Ride Systems Market Synopsis
Ride systems are essential technologies for transportation and entertainment, primarily found in amusement parks and urban transit systems. The Japan Ride Systems Market is valued at approximately ¥200 billion, driven by over 20 major theme parks and a growing number of urban transit projects. Factors such as increasing tourism, urbanisation, and advancements in ride technology are propelling market growth, with amusement rides leading the way in demand. The average annual attendance at theme parks exceeds 50 million visitors, further supporting this trend.
Market Dynamics Impact Analysis (2026–2032)
| Factor | Type | Impact | Primary Segment Affected |
| Growing tourism and local engagement in theme parks | Driver | High | Amusement Rides |
| Expansion of urban transit projects in major cities | Driver | High | Monorail Systems |
| Investment in advanced ride technologies | Opportunity | High | Electric Motors |
| Development of cable car systems for tourism | Opportunity | Medium | Cable Cars |
| High operational costs for maintaining ride systems | Restraint | Medium | Amusement Rides |
| Regulatory compliance costs for urban transit systems | Restraint | High | Monorail Systems |
| Limited availability of skilled technicians for maintenance | Challenge | High | Guided People Movers |
| Competition from alternative entertainment options | Challenge | Medium | Cable Cars |
Evaluation of Drivers in Japan Ride Systems Market (2026–2032)
The table below links each growth driver to the segment it affects and the evidence for it.
| Drivers | Primary Segment Affected | Why It Matters (Evidence) |
| Increased attendance at theme parks | Amusement Rides | The average annual attendance at theme parks exceeds 50 million visitors, boosting demand for rides. |
| Investment in urban transit infrastructure | Monorail Systems | The Tokyo Monorail connects Haneda Airport with central Tokyo, increasing transit options for passengers. |
| Technological advancements in ride systems | Electric Motors | Electric motors are the primary drive mechanism in over 70% of amusement rides, improving efficiency. |
| Government support for tourism initiatives | Cable Cars | The Japan National Tourism Organization promotes cable car tourism, increasing demand for these systems. |
| Growing urbanisation leading to transit needs | Guided People Movers | With over 100 operational monorail systems, urban transit bodies are expanding their services to meet demand. |
Orders keep climbing as the amusement ride market benefits from increased attendance at theme parks, which attract over 50 million visitors annually. Urban transit projects are gaining traction, with the Tokyo Monorail enhancing accessibility. Technological advancements in electric motors, powering over 70% of rides, drive efficiency and reliability. Support from tourism authorities promotes cable car tourism, creating new demand. Urbanisation is pushing the need for guided people movers, with over 100 operational systems across Japan, further boosting market growth.
Evaluation of Restraints in Japan Ride Systems Market
Below are the constraints most often cited by buyers and suppliers, with the segment each affects.
| Market Restraint | Primary Segment Affected | Why It Matters (Evidence) |
| High maintenance costs for amusement rides | Amusement Rides | The average lifespan of a well-maintained amusement ride is 20-30 years, requiring ongoing investment. |
| Compliance costs for urban transit regulations | Monorail Systems | The Ministry of Land, Infrastructure, Transport and Tourism regulates urban transit systems, raising operational costs by approximately 8%. |
| Limited skilled workforce for maintenance | Guided People Movers | The industry faces a shortage of technicians, which affects service quality and reliability. |
| Competition from alternative entertainment options | Cable Cars | Tourism authorities promote various attractions, creating competition for visitor attention. |
| Economic fluctuations affecting discretionary spending | Amusement Rides | Economic downturns can reduce consumer spending on entertainment and leisure activities. |
Japan Ride Systems Market Challenges
Producers face supply constraints due to limited local steel production, raising material costs by approximately 15% and delaying project timelines for buyers. Intense competition among amusement parks leads to price wars, which can erode margins by up to 10%, forcing producers to compromise on quality and negatively impacting buyer satisfaction. Many ride systems still rely on outdated technology, with over 60% not upgraded, causing inefficiencies that can extend project completion times for buyers. Regulatory compliance with stringent safety standards from the Ministry of Land, Infrastructure, Transport and Tourism increases operational costs for producers by around 8%.
Trends in the Japan Ride Systems Market
The shifts below are changing how Japan Ride Systems Market products are bought and supplied.
- Shift from Traditional to Automated Ride Systems: Since 2023, the trend towards automation in ride systems has gained momentum, with programmable controls becoming standard. This shift allows for more efficient operations and improved safety, catering to the increasing visitor numbers in theme parks.
- Emergence of Sustainable Urban Transit Solutions: In 2023, urban transit bodies are prioritising sustainable transport options, with monorail systems gaining popularity. This trend is driven by the need for efficient, eco-friendly transit solutions in densely populated areas.
- Growth in Cable Car Tourism: Since 2022, cable cars have become a focal point for tourism in mountainous regions like Hakone, attracting visitors seeking scenic experiences. The Japan Tourism Agency reports a notable rise in cable car usage, benefiting local economies.
- Expansion of Guided People Movers in Airports: In 2023, airports are increasingly adopting guided people movers to streamline passenger movement. With over 100 operational systems, this trend improves efficiency and enhances the travel experience.
Investment Opportunities in the Japan Ride Systems Market
Several openings in the Japan Ride Systems Market merit attention from investors.
- Investment in Advanced Ride Technologies: With the amusement ride market valued at ¥200 billion, there is a gap for advanced ride technologies. Theme parks are seeking solutions to improve visitor experiences and safety.
- Development of Urban Transit Solutions: Urban transit bodies are expanding their services, targeting enhancements in connectivity across major cities. Investing in monorail systems presents a valuable opportunity for suppliers.
- Modernisation of Cable Car Systems: With the rise in cable car tourism, there is a demand for upgrading and expanding existing systems. Tourism authorities are looking for partners to develop new attractions.
- Automation in Ride Operations: The shift towards automated ride operations presents a valuable opportunity. Theme parks are investing in programmable controls to improve efficiency and safety, attracting more visitors.
Government Initiatives in the Japan Ride Systems Market
The New Robot Strategy launched in 2015 aims to expand the use of robotics in various sectors, including ride systems. This strategy complements existing laws like the Electrical Appliance and Material Safety Act, which regulates safety standards for equipment used in amusement rides, ensuring compliance and operational safety.
In 2023, the government initiated a subsidy program targeting urban transit improvements, administered by the Ministry of Land, Infrastructure, Transport and Tourism. This program aims to improve the efficiency of urban transit systems, with a funding target of ¥50 billion for infrastructure upgrades.
Future Insight of the Japan Ride Systems Market
Urban transit bodies will experience advancements by 2032 as government subsidies for infrastructure improvements drive innovation in ride systems. Producers will adopt advanced engineering techniques, increasing efficiency and reducing maintenance costs. The integration of smart technology will streamline operations, providing buyers with faster and more reliable transit solutions. By 2032, the average annual attendance at theme parks in Japan is expected to exceed 50 million visitors, ensuring higher safety and reliability standards that will attract more tourists.
Market Segmentation Analysis
Japan Ride Systems Market report covers a detailed analysis of the following market segments:
By Application Type – Amusement Rides Lead, Monorail Systems Expected to Grow Fastest
According to Saurav Kr Singh, Senior Research Analyst at 6Wresearch, in 2025, Amusement Rides led the application type split with a 38% share. Amusement rides dominate the market as they are integral to Japan's over 20 major theme parks, which collectively attract more than 50 million visitors annually. Their entertainment appeal ensures a consistent demand from both local and international tourists. Monorail Systems are set to record the highest CAGR in this split, 7.8% over 2026–2032. Monorail systems are witnessing rapid growth, particularly with over 100 operational systems facilitating urban transit across Japan. The government's recent subsidy program for urban transit improvements significantly contributes to this momentum. Suppliers should focus on developing innovative solutions for monorail systems to meet the rising demand from urban transit authorities.
By Drive Mechanism – Hydraulic Leads, Electric Motors Expected to Grow Fastest
Hydraulic took 34% of drive mechanism revenue in 2025, more than any other category. Hydraulic systems are essential in various ride systems, providing reliable operation for many amusement rides in Japan. Their established use in the market ensures consistent demand from ride operators seeking effective solutions. The quickest growth will come from Electric Motors, forecast to expand at a CAGR of 8.3% between 2026 and 2032. Electric motors are experiencing the highest growth as they power over 70% of amusement rides, reflecting a shift towards more efficient technologies. This trend will likely continue as operators seek to improve performance and reliability in their systems. Buyers should prioritise investments in electric motor technologies to improve operational efficiency and comply with market expectations.
By Control System – Programmable Controls Lead, Centralized Automation Expected to Grow Fastest
Programmable Controls accounted for 45% of the market by control system in 2025. Programmable controls are the preferred choice for ride systems, enabling automated operations in numerous amusement rides while ensuring safety and efficiency. Their extensive use across the industry highlights the demand for reliable and advanced control solutions. Over 2026–2032, Centralized Automation is expected to post the fastest growth, at a CAGR of 8.6%. Centralized automation is gaining momentum as it allows for the management of multiple systems from a single interface, essential for large-scale operations. This growth is propelled by the increasing complexity of modern ride systems requiring sophisticated control. Suppliers must prioritise the development of centralized automation solutions to address the rising demand from amusement park operators.
By End User – Theme Parks Lead, Urban Transit Bodies Expected to Grow Fastest
The largest end user category in 2025 was Theme Parks, at 38% of revenue. Theme parks are the primary end users of ride systems, with the average annual attendance exceeding 50 million visitors, highlighting their importance in the entertainment sector. This substantial footfall drives continuous investment in new and improved ride systems. Urban Transit Bodies are projected to grow fastest, at a CAGR of 7.6% during 2026–2032. Urban transit bodies are experiencing the fastest growth as they increasingly adopt monorail systems for efficient transportation solutions, supported by government initiatives. This shift towards urban transit reflects changing consumer preferences and urban planning strategies. Suppliers should align their strategies to cater to the growing needs of urban transit bodies while maintaining strong relationships with theme parks.
Key Attractiveness of the Report
- 10 Years of Market Numbers
- Historical Data Starting from 2022 to 2025
- Base Year 2025
- Forecast Data until 2032
- Key Performance Indicators Impacting the Market
- Major Upcoming Developments and Projects
Key Highlights of the Report:
- Japan Ride Systems Market Outlook
- Market Size of Japan Ride Systems Market, 2025
- Forecast of Japan Ride Systems Market, 2032
- Historical Data and Forecast of Japan Ride Systems Revenues & Volume for the Period 2022-2032F
- Japan Ride Systems Market Trend Evolution
- Japan Ride Systems Market Drivers and Challenges
- Japan Ride Systems Price Trends
- Japan Ride Systems Porter's Five Forces
- Japan Ride Systems Industry Life Cycle
- Historical Data and Forecast of Japan Ride Systems Market Revenues & Volume By Application Type for the Period 2022-2032F
- Historical Data and Forecast of Japan Ride Systems Market Revenues & Volume By Amusement Rides for the Period 2022-2032F
- Historical Data and Forecast of Japan Ride Systems Market Revenues & Volume By Monorail Systems for the Period 2022-2032F
- Historical Data and Forecast of Japan Ride Systems Market Revenues & Volume By Cable Cars for the Period 2022-2032F
- Historical Data and Forecast of Japan Ride Systems Market Revenues & Volume By Guided People Movers for the Period 2022-2032F
- Historical Data and Forecast of Japan Ride Systems Market Revenues & Volume By Drive Mechanism for the Period 2022-2032F
- Historical Data and Forecast of Japan Ride Systems Market Revenues & Volume By Hydraulic for the Period 2022-2032F
- Historical Data and Forecast of Japan Ride Systems Market Revenues & Volume By Electric Motors for the Period 2022-2032F
- Historical Data and Forecast of Japan Ride Systems Market Revenues & Volume By Cable Drive for the Period 2022-2032F
- Historical Data and Forecast of Japan Ride Systems Market Revenues & Volume By Rail Guided for the Period 2022-2032F
- Historical Data and Forecast of Japan Ride Systems Market Revenues & Volume By Control System for the Period 2022-2032F
- Historical Data and Forecast of Japan Ride Systems Market Revenues & Volume By Programmable Controls for the Period 2022-2032F
- Historical Data and Forecast of Japan Ride Systems Market Revenues & Volume By Centralized Automation for the Period 2022-2032F
- Historical Data and Forecast of Japan Ride Systems Market Revenues & Volume By Manual + AI Override for the Period 2022-2032F
- Historical Data and Forecast of Japan Ride Systems Market Revenues & Volume By Fully Autonomous for the Period 2022-2032F
- Historical Data and Forecast of Japan Ride Systems Market Revenues & Volume By End User for the Period 2022-2032F
- Historical Data and Forecast of Japan Ride Systems Market Revenues & Volume By Theme Parks for the Period 2022-2032F
- Historical Data and Forecast of Japan Ride Systems Market Revenues & Volume By Urban Transit Bodies for the Period 2022-2032F
- Historical Data and Forecast of Japan Ride Systems Market Revenues & Volume By Tourism Authorities for the Period 2022-2032F
- Historical Data and Forecast of Japan Ride Systems Market Revenues & Volume By Airports for the Period 2022-2032F
- Japan Ride Systems Import Export Trade Statistics
- Market Opportunity Assessment By Application Type
- Market Opportunity Assessment By Drive Mechanism
- Market Opportunity Assessment By Control System
- Market Opportunity Assessment By End User
- Japan Ride Systems Top Companies Market Share
- Japan Ride Systems Competitive Benchmarking By Technical and Operational Parameters
- Japan Ride Systems Company Profiles
- Japan Ride Systems Key Strategic Recommendations
Market Covered
Coverage by segment is as follows.
By Application Type
- Amusement Rides
- Monorail Systems
- Cable Cars
- Guided People Movers
By Drive Mechanism
- Hydraulic
- Electric Motors
- Cable Drive
- Rail Guided
By Control System
- Programmable Controls
- Centralized Automation
- Manual + AI Override
- Fully Autonomous
By End User
- Theme Parks
- Urban Transit Bodies
- Tourism Authorities
- Airports































