Japan Satellite Imagery Market Size & Growth Rate
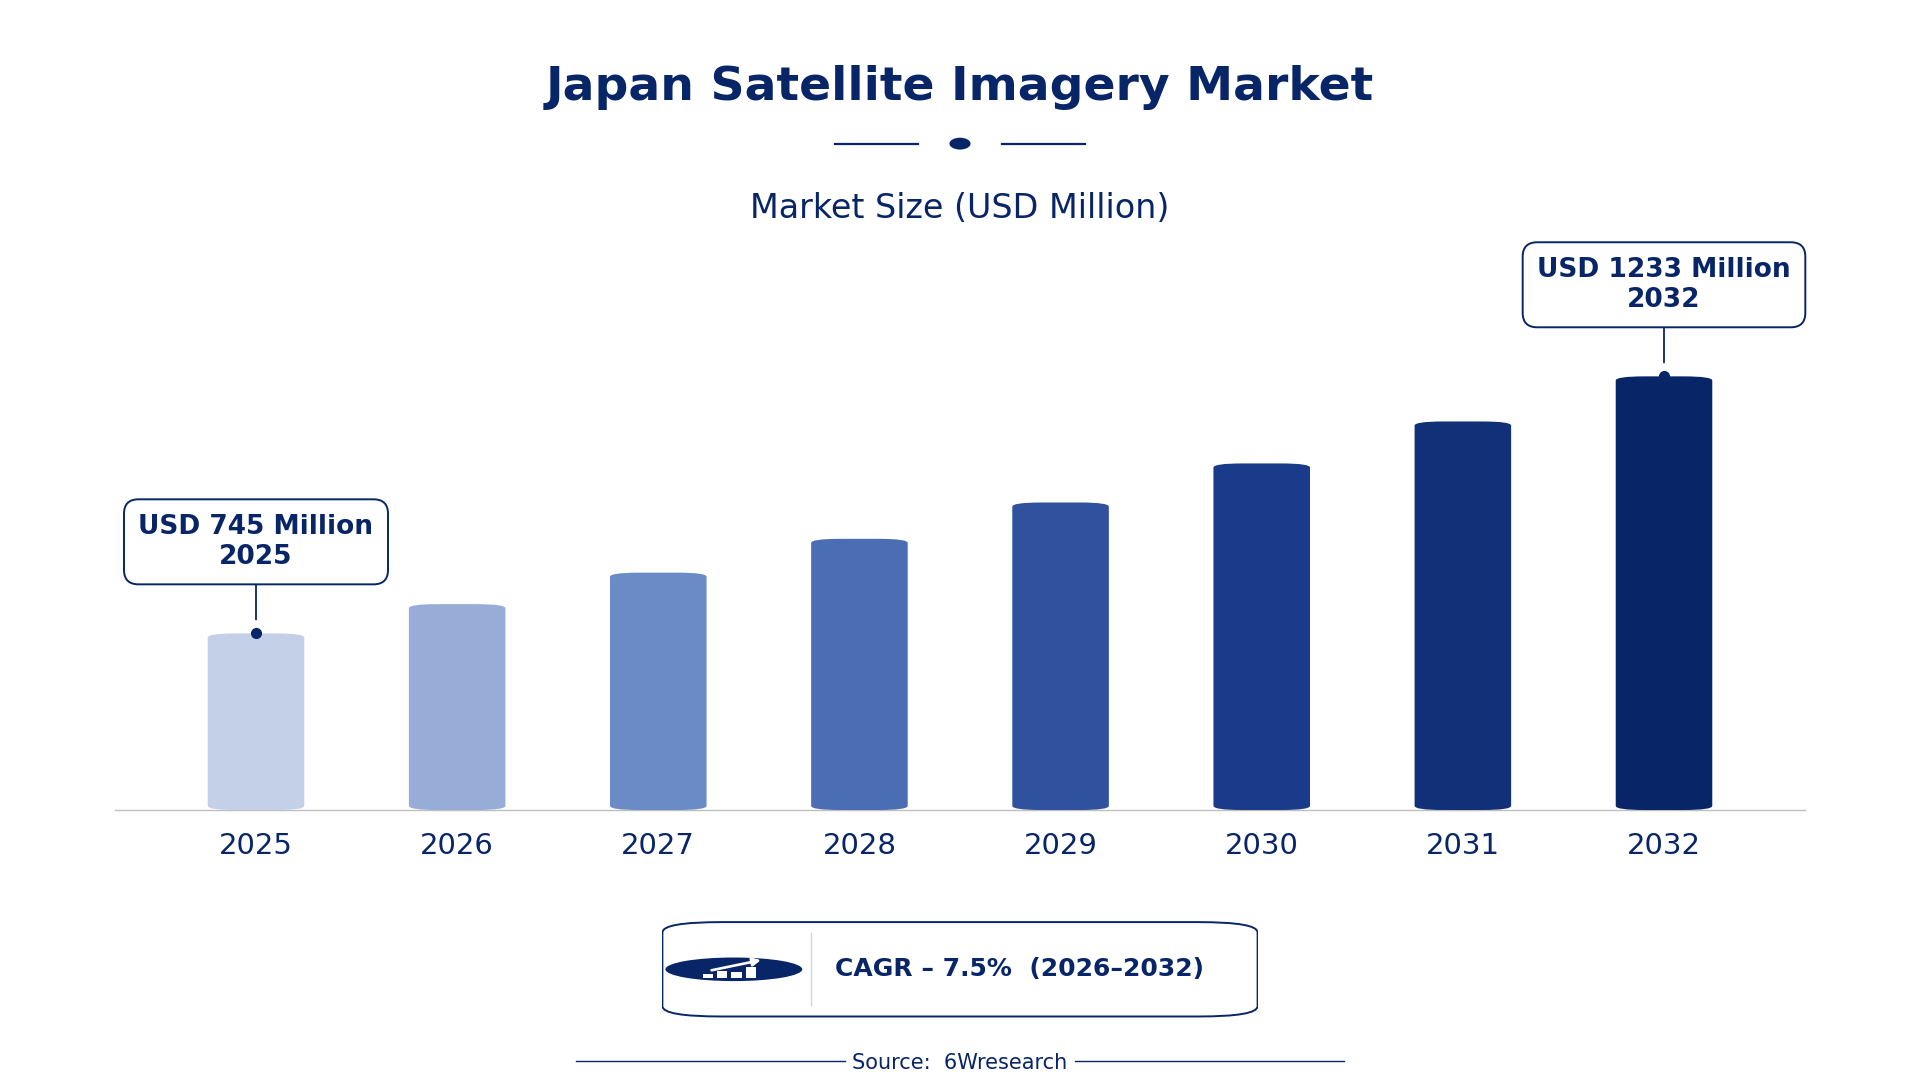
According to 6Wresearch internal database and industry insights, the Japan Satellite Imagery Market was valued at USD 745 Million in 2025 and is projected to reach USD 1,233 Million by 2032, growing at a CAGR of approximately 7.5% during 2026–2032.
Japan Satellite Imagery Market Highlights
| Report Metric | Details |
| Report Name | Japan Satellite Imagery Market (2026-2032) |
| Market Size 2025 | USD 745 Million |
| Market Size 2032 | USD 1,233 Million |
| Absolute Growth 2025–2032 | USD 488 Million |
| CAGR 2026–2032 | 7.5% |
| Peak Annual Growth | 8.3% in 2026 |
| Forecast Period | 2026–2032 |
| Historical Data | 2022–2025 |
| Base Year | 2025 |
| Leading Image Type, 2025 | Panchromatic (35% share) |
| Leading Spectral Band, 2025 | Visible Light (52% share) |
| Leading Resolution Type, 2025 | High-Resolution (53% share) |
| Leading End User, 2025 | Mapping Firms (39% share) |
| Fastest-Growing Image Type | Multispectral (10.3% CAGR) |
| Fastest-Growing Spectral Band | Infrared/Visible (9.8% CAGR) |
| Fastest-Growing Resolution Type | Medium Resolution (10.9% CAGR) |
| Fastest-Growing End User | Environmental Agencies (9.5% CAGR) |
| Growing Sector | Environmental Monitoring |
| Key End Users | Mapping Firms, Environmental Agencies, Research Institutes, Defense Intelligence |
Japan Satellite Imagery Market Year-wise Growth Rate and Key Drivers (2022–2032)
This graph illustrates the annual growth rates of the market from 2022 to 2032, highlighting a steady upward trajectory and projected market expansion over the forecast period.
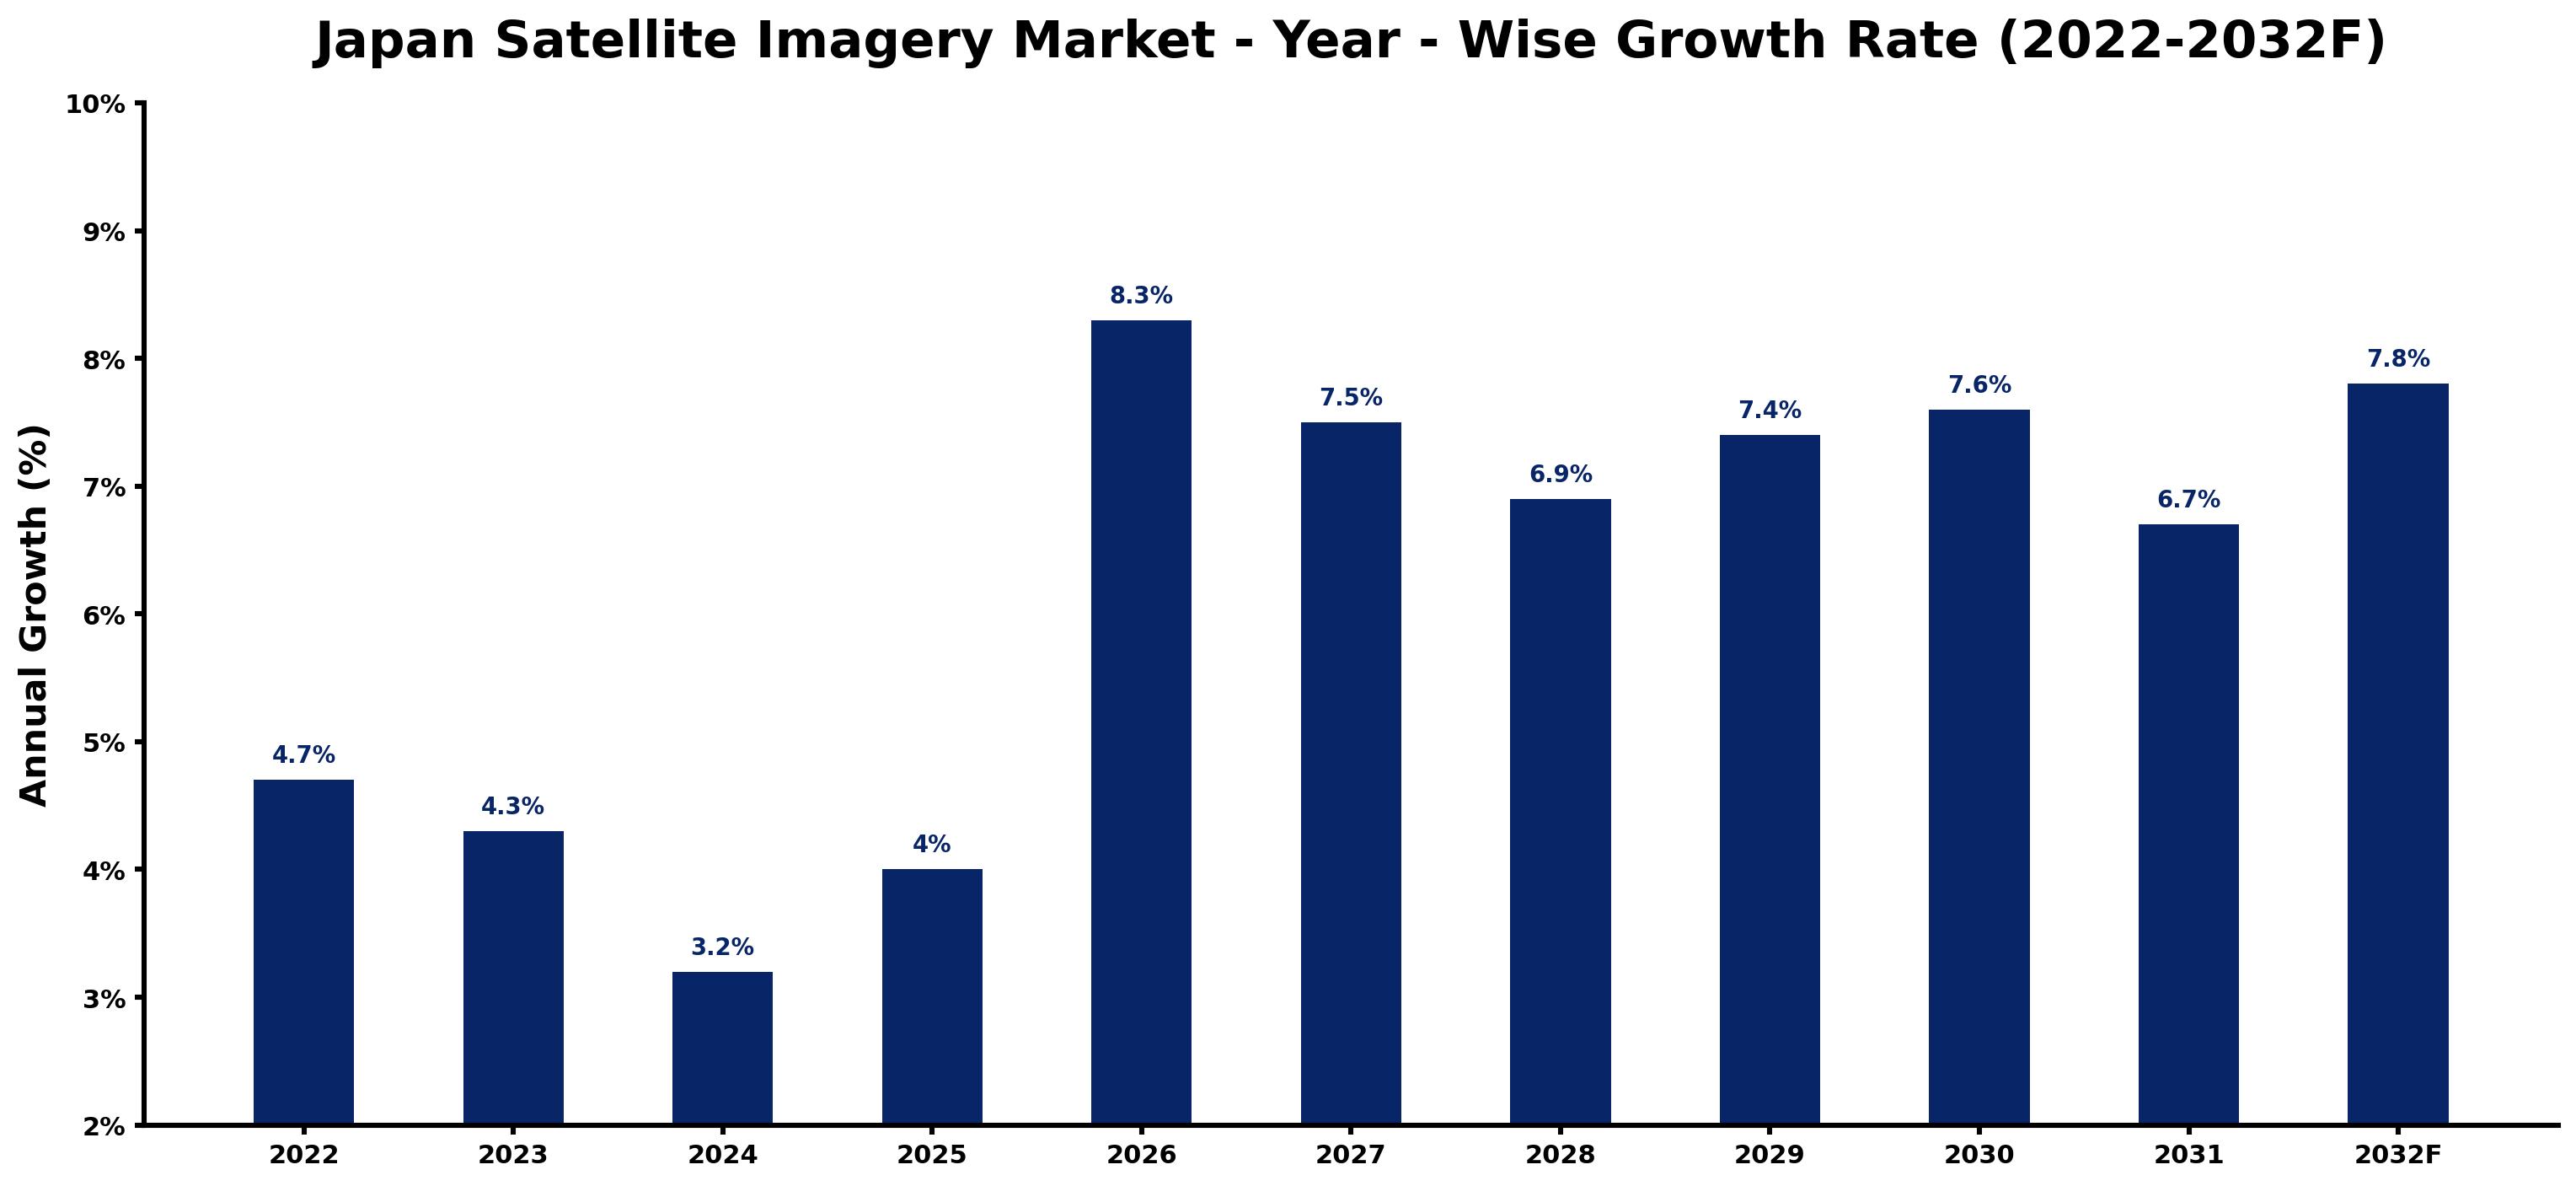
The table below sets out the estimated growth rate for each year and the main factor behind it.
| Year | Estimated Annual Growth (%) | Market Rationale |
| 2022 | 4.7 | The market showed strong demand from domestic users and research institutions. |
| 2023 | 4.3 | Demand growth slowed due to market saturation and increased competition among providers. |
| 2024 | 3.2 | The market experienced a further slowdown as buyers adjusted to new pricing models. |
| 2025 | 4.0 | Growth accelerated as new satellite missions were launched for environmental monitoring. |
| 2026 | 8.3 | Demand is expected to surge with the introduction of advanced imaging technologies and capabilities. |
| 2027 | 7.5 | Growth is projected to decelerate as the market begins to stabilise after rapid expansion. |
| 2028 | 6.9 | The market is expected to continue slowing as existing buyers maximise their satellite data usage. |
| 2029 | 7.4 | Demand will increase again as new applications for satellite imagery emerge. |
| 2030 | 7.6 | Growth is projected to remain strong as urban planning in metropolitan areas drives demand. |
| 2031 | 6.7 | The market is expected to slow as competition intensifies and pricing pressures emerge. |
| 2032 | 7.8 | Demand is expected to rise as environmental monitoring becomes increasingly critical. |
Note: Market size estimations and growth projections presented in this report are based on 6Wresearch's proprietary forecasting methodology, utilizing the latest available industry data, government publications, and primary research inputs.
Japan Satellite Imagery Market Synopsis
Satellite imagery captures images of the Earth's surface using sensors on satellites, serving key purposes such as mapping, environmental monitoring, and defence applications. The Japan Satellite Imagery Market is expanding due to strong demand from domestic users, including environmental agencies and mapping firms. New satellite missions and advancements in imaging technology are driving growth, reflecting an increasing reliance on satellite data for urban planning and environmental assessments.
Market Dynamics Impact Analysis (2026–2032)
| Factor | Type | Impact | Primary Segment Affected |
| Increased demand from environmental agencies for monitoring land use changes | Driver | High | Multispectral |
| Growing urbanisation in metropolitan areas requiring detailed mapping | Driver | High | High-Resolution |
| Rising interest in climate change research necessitating satellite data | Opportunity | High | Research Institutes |
| Investment in satellite technology development to enhance capabilities | Opportunity | High | Mapping Firms |
| High competition among satellite imagery providers leading to pricing pressures | Restraint | Medium | Panchromatic |
| Potential over-reliance on satellite data for critical decision-making | Restraint | Medium | Radar Imagery |
| Limited integration of satellite data with other technologies | Challenge | Medium | Hyperspectral |
| Challenges in data accessibility for smaller organisations | Challenge | Medium | Infrared/Visible |
Evaluation of Drivers in Japan Satellite Imagery Market (2026–2032)
The main growth drivers and the segments they affect most are set out below.
| Drivers | Primary Segment Affected | Why It Matters (Evidence) |
| Increased government investment in satellite technology | Multispectral | The Japanese government allocated JPY 150 trillion for decarbonisation initiatives, improving data availability for environmental monitoring. |
| Urban planning initiatives in metropolitan areas | High-Resolution | The Tokyo metropolitan area relies on high-resolution imagery for effective urban development, driving demand for detailed satellite data. |
| Growing climate change initiatives by research institutes | Research Institutes | The National Institute for Environmental Studies uses satellite data to support climate research, increasing demand for precise imagery. |
| Launch of new satellite missions by the Japan Aerospace Exploration Agency | Panchromatic | New missions provide advanced imaging capabilities, prompting mapping firms to acquire more data. |
| Adoption of ISO 19130 standards for data quality | Radar Imagery | The implementation of these standards ensures high-quality imagery, encouraging environmental agencies to invest in satellite data. |
Urban planning in the Tokyo metropolitan area drives demand for high-resolution imagery, as detailed data is essential for effective development. The launch of new satellite missions provides advanced imaging capabilities, prompting mapping firms to acquire more data.
Evaluation of Restraints in Japan Satellite Imagery Market
Below are the constraints most often cited by buyers and suppliers, with the segment each affects.
| Market Restraint | Primary Segment Affected | Why It Matters (Evidence) |
| High competition resulting in price wars among providers | Panchromatic | Intense competition has resulted in pricing pressures, affecting profit margins for satellite imagery providers. |
| Over-reliance on satellite data for critical decision-making | Radar Imagery | Dependence on satellite imagery may lead to inadequate assessments in critical situations, impacting decision-making for defense intelligence. |
| Limited integration of satellite data with other technologies | Hyperspectral | Challenges in integrating satellite data with other systems restrict its full potential, limiting usage by research institutes. |
| Data accessibility issues for smaller organisations | Infrared/Visible | Smaller organisations often face barriers in accessing satellite data, hindering their ability to utilise it effectively. |
| Regulatory constraints affecting data distribution | Multispectral | Strict regulations on data sharing can restrict the availability of satellite imagery to potential buyers. |
Japan Satellite Imagery Market Challenges
High-resolution satellite imagery is crucial for urban planning, yet buyers encounter delays due to limited availability of advanced data, which can extend project timelines by up to six months. Skills shortages in satellite data interpretation hinder effective usage, leaving urban planners unable to fully utilise available imagery. Training programmes are insufficient, leading to a 30% underutilisation rate among potential users. Rising costs associated with satellite technology development strain budgets, forcing some buyers to reduce their project scopes by 20%.
Trends in the Japan Satellite Imagery Market
Below are the shifts with the largest effect on the Japan Satellite Imagery Market.
- Shift towards Advanced Environmental Monitoring: The Earth Observation Research Center launched new satellite missions in 2023, improving capabilities for environmental monitoring. This shift is important as Japan faces increasing climate challenges, with demand for satellite data projected to grow.
- Growing Demand for High-Resolution Imagery: In 2023, the Tokyo metropolitan area significantly increased its reliance on high-resolution satellite imagery for urban planning. This trend reflects the need for detailed data to support urban development, with a market share of 53%.
- Emergence of Infrared/Visible Applications: The Infrared/Visible segment is gaining traction, with a CAGR of 9.8% projected for 2026-2032. This growth is driven by agricultural monitoring needs, highlighting the importance of satellite data in food security.
- Increased Collaboration in Satellite Technology Development: The Japan Space Forum has been promoting collaboration in satellite technology development since 2023, leading to innovative applications. This initiative is expected to improve capabilities and expand market opportunities.
Investment Opportunities in the Japan Satellite Imagery Market
The opportunities below stand out in the Japan Satellite Imagery Market for new entrants and existing suppliers.
- Environmental Agencies Seeking Enhanced Data: Environmental agencies are increasingly looking for high-quality satellite data for monitoring purposes. Collaborating with local partners can facilitate entry into this sector, with a projected market growth of 9.5%.
- Mapping Firms Needing Advanced Imagery Solutions: Mapping firms require advanced satellite imagery to improve their services. Establishing joint ventures can help meet this demand effectively, as the market continues to expand.
- Urban Planning Initiatives in Tokyo: The Tokyo metropolitan area presents a significant opportunity for high-resolution satellite imagery, with a growing need for urban planning solutions. Engaging with local authorities can enhance market access.
- Research Institutes Demanding Climate Data: Research institutes are increasingly investing in satellite data for climate studies. Providing tailored solutions can capture this growing market, with a projected growth for the Multispectral segment.
Government Initiatives in the Japan Satellite Imagery Market
The Industrial Standardization Act of 1949, amended in 2019, governs product and test standards for satellite imagery, ensuring quality and reliability. The Economic Security Promotion Act, adopted in 2022, supports supply-chain resilience for critical products, including satellite technology, enhancing domestic production capabilities.
The Geospatial Information Authority of Japan oversees mapping standards and satellite data usage. The Japan Meteorological Agency utilises satellite imagery for weather forecasting, relying on the standards set by this authority.
Future Insight of the Japan Satellite Imagery Market
The Advanced Land Observing Satellite-2 will transform disaster monitoring capabilities, driving demand for satellite imagery by 15% by 2032. Improved data accessibility through new initiatives will facilitate research and applications across various sectors. Enhanced satellite capabilities outlined in Japan's Space Industry Strategy will enable suppliers to meet evolving market needs. Collaborative efforts like the Japan Space Forum will drive innovation, ensuring that buyers receive cutting-edge solutions.
Market Segmentation Analysis
Japan Satellite Imagery Market report covers a detailed analysis of the following market segments:
By Image Type – Panchromatic Leads, Multispectral Expected to Grow Fastest
According to Saurav Kr Singh, Senior Research Analyst at 6Wresearch, Panchromatic held 35% of the Japan Satellite Imagery Market by image type in 2025. Panchromatic imagery holds the largest share as it provides high-detail images essential for mapping, particularly in urban planning within regions like Tokyo. The extensive use of this imagery by government agencies and research institutions further solidifies its dominance. Multispectral is projected to grow fastest, at a CAGR of 10.3% during 2026–2032. The multispectral segment is witnessing rapid growth due to its increasing relevance in environmental monitoring applications. The launch of new satellite missions in 2023 specifically targets land use changes, highlighting the segment's expanding importance. Suppliers must focus on enhancing multispectral capabilities to meet the growing demand for environmental monitoring solutions.
By Spectral Band – Visible Light Leads, Infrared/Visible Expected to Grow Fastest
The largest spectral band category in 2025 was Visible Light, at 52% of revenue. Visible light imagery dominates the market as it serves a wide range of applications, including standard imaging for urban planning and agricultural assessments. Its versatility makes it the preferred choice among various user groups across Japan. Infrared/Visible is set to record the highest CAGR in this split, 9.8% over 2026–2032. Infrared/visible imagery is growing quickly, driven by its critical role in agricultural monitoring. The rising focus on sustainable farming practices is significantly boosting the demand for this type of imagery. Buyers should consider integrating infrared/visible data into their operations to improve agricultural monitoring and decision-making.
By Resolution Type – High-Resolution Leads, Medium Resolution Expected to Grow Fastest
With 53% of resolution type revenue in 2025, High-Resolution was the largest category. High-resolution imagery is the dominant segment, vital for urban planning and precise mapping in Japan's metropolitan regions. The reliance of mapping firms on such data, especially in urban areas like Tokyo, highlights its significance. Over 2026–2032, Medium Resolution is expected to post the fastest growth, at a CAGR of 10.9%. Medium resolution imagery is seeing the fastest growth, largely due to its utility in broader environmental studies. As environmental agencies expand their research efforts, the demand for medium resolution data is anticipated to increase. Suppliers should consider diversifying their offerings to include medium resolution options to cater to the growing environmental research market.
By End User – Mapping Firms Lead, Environmental Agencies Expected to Grow Fastest
Mapping Firms accounted for 39% of the market by end user in 2025. Mapping firms represent the largest user group of satellite imagery, as they require accurate data for a variety of mapping projects across Japan. Their ongoing initiatives in urban areas ensure a steady demand for high-quality imagery. The quickest growth will come from Environmental Agencies, forecast to expand at a CAGR of 9.5% between 2026 and 2032. Environmental agencies are the fastest-growing user segment, driven by a surge in demand for satellite data to monitor natural resources. This trend aligns with government initiatives aimed at improving environmental oversight. Providers must adjust their strategies to meet the increasing requirements of environmental agencies for satellite data.
Key Attractiveness of the Report
- 10 Years of Market Numbers
- Historical Data Starting from 2022 to 2025
- Base Year 2025
- Forecast Data until 2032
- Key Performance Indicators Impacting the Market
- Major Upcoming Developments and Projects
Key Highlights of the Report:
- Japan Satellite Imagery Market Outlook
- Market Size of Japan Satellite Imagery Market, 2025
- Forecast of Japan Satellite Imagery Market, 2032
- Historical Data and Forecast of Japan Satellite Imagery Revenues & Volume for the Period 2022-2032F
- Japan Satellite Imagery Market Trend Evolution
- Japan Satellite Imagery Market Drivers and Challenges
- Japan Satellite Imagery Price Trends
- Japan Satellite Imagery Porter's Five Forces
- Japan Satellite Imagery Industry Life Cycle
- Historical Data and Forecast of Japan Satellite Imagery Market Revenues & Volume By Image Type for the Period 2022-2032F
- Historical Data and Forecast of Japan Satellite Imagery Market Revenues & Volume By Panchromatic for the Period 2022-2032F
- Historical Data and Forecast of Japan Satellite Imagery Market Revenues & Volume By Multispectral for the Period 2022-2032F
- Historical Data and Forecast of Japan Satellite Imagery Market Revenues & Volume By Hyperspectral for the Period 2022-2032F
- Historical Data and Forecast of Japan Satellite Imagery Market Revenues & Volume By Radar Imagery for the Period 2022-2032F
- Historical Data and Forecast of Japan Satellite Imagery Market Revenues & Volume By Spectral Band for the Period 2022-2032F
- Historical Data and Forecast of Japan Satellite Imagery Market Revenues & Volume By Visible Light for the Period 2022-2032F
- Historical Data and Forecast of Japan Satellite Imagery Market Revenues & Volume By Infrared/Visible for the Period 2022-2032F
- Historical Data and Forecast of Japan Satellite Imagery Market Revenues & Volume By Wide Band for the Period 2022-2032F
- Historical Data and Forecast of Japan Satellite Imagery Market Revenues & Volume By Microwave for the Period 2022-2032F
- Historical Data and Forecast of Japan Satellite Imagery Market Revenues & Volume By Resolution Type for the Period 2022-2032F
- Historical Data and Forecast of Japan Satellite Imagery Market Revenues & Volume By High-Resolution for the Period 2022-2032F
- Historical Data and Forecast of Japan Satellite Imagery Market Revenues & Volume By Medium Resolution for the Period 2022-2032F
- Historical Data and Forecast of Japan Satellite Imagery Market Revenues & Volume By Ultra-High Resolution for the Period 2022-2032F
- Historical Data and Forecast of Japan Satellite Imagery Market Revenues & Volume By Synthetic Aperture for the Period 2022-2032F
- Historical Data and Forecast of Japan Satellite Imagery Market Revenues & Volume By End User for the Period 2022-2032F
- Historical Data and Forecast of Japan Satellite Imagery Market Revenues & Volume By Mapping Firms for the Period 2022-2032F
- Historical Data and Forecast of Japan Satellite Imagery Market Revenues & Volume By Environmental Agencies for the Period 2022-2032F
- Historical Data and Forecast of Japan Satellite Imagery Market Revenues & Volume By Research Institutes for the Period 2022-2032F
- Historical Data and Forecast of Japan Satellite Imagery Market Revenues & Volume By Defense Intelligence for the Period 2022-2032F
- Japan Satellite Imagery Import Export Trade Statistics
- Market Opportunity Assessment By Image Type
- Market Opportunity Assessment By Spectral Band
- Market Opportunity Assessment By Resolution Type
- Market Opportunity Assessment By End User
- Japan Satellite Imagery Top Companies Market Share
- Japan Satellite Imagery Competitive Benchmarking By Technical and Operational Parameters
- Japan Satellite Imagery Company Profiles
- Japan Satellite Imagery Key Strategic Recommendations
Market Covered
The following segment groups are covered in the report.
By Image Type
- Panchromatic
- Multispectral
- Hyperspectral
- Radar Imagery
By Spectral Band
- Visible Light
- Infrared/Visible
- Wide Band
- Microwave
By Resolution Type
- High-Resolution
- Medium Resolution
- Ultra-High Resolution
- Synthetic Aperture
By End User
- Mapping Firms
- Environmental Agencies
- Research Institutes
- Defense Intelligence































