Japan Signage Market Size & Growth Rate
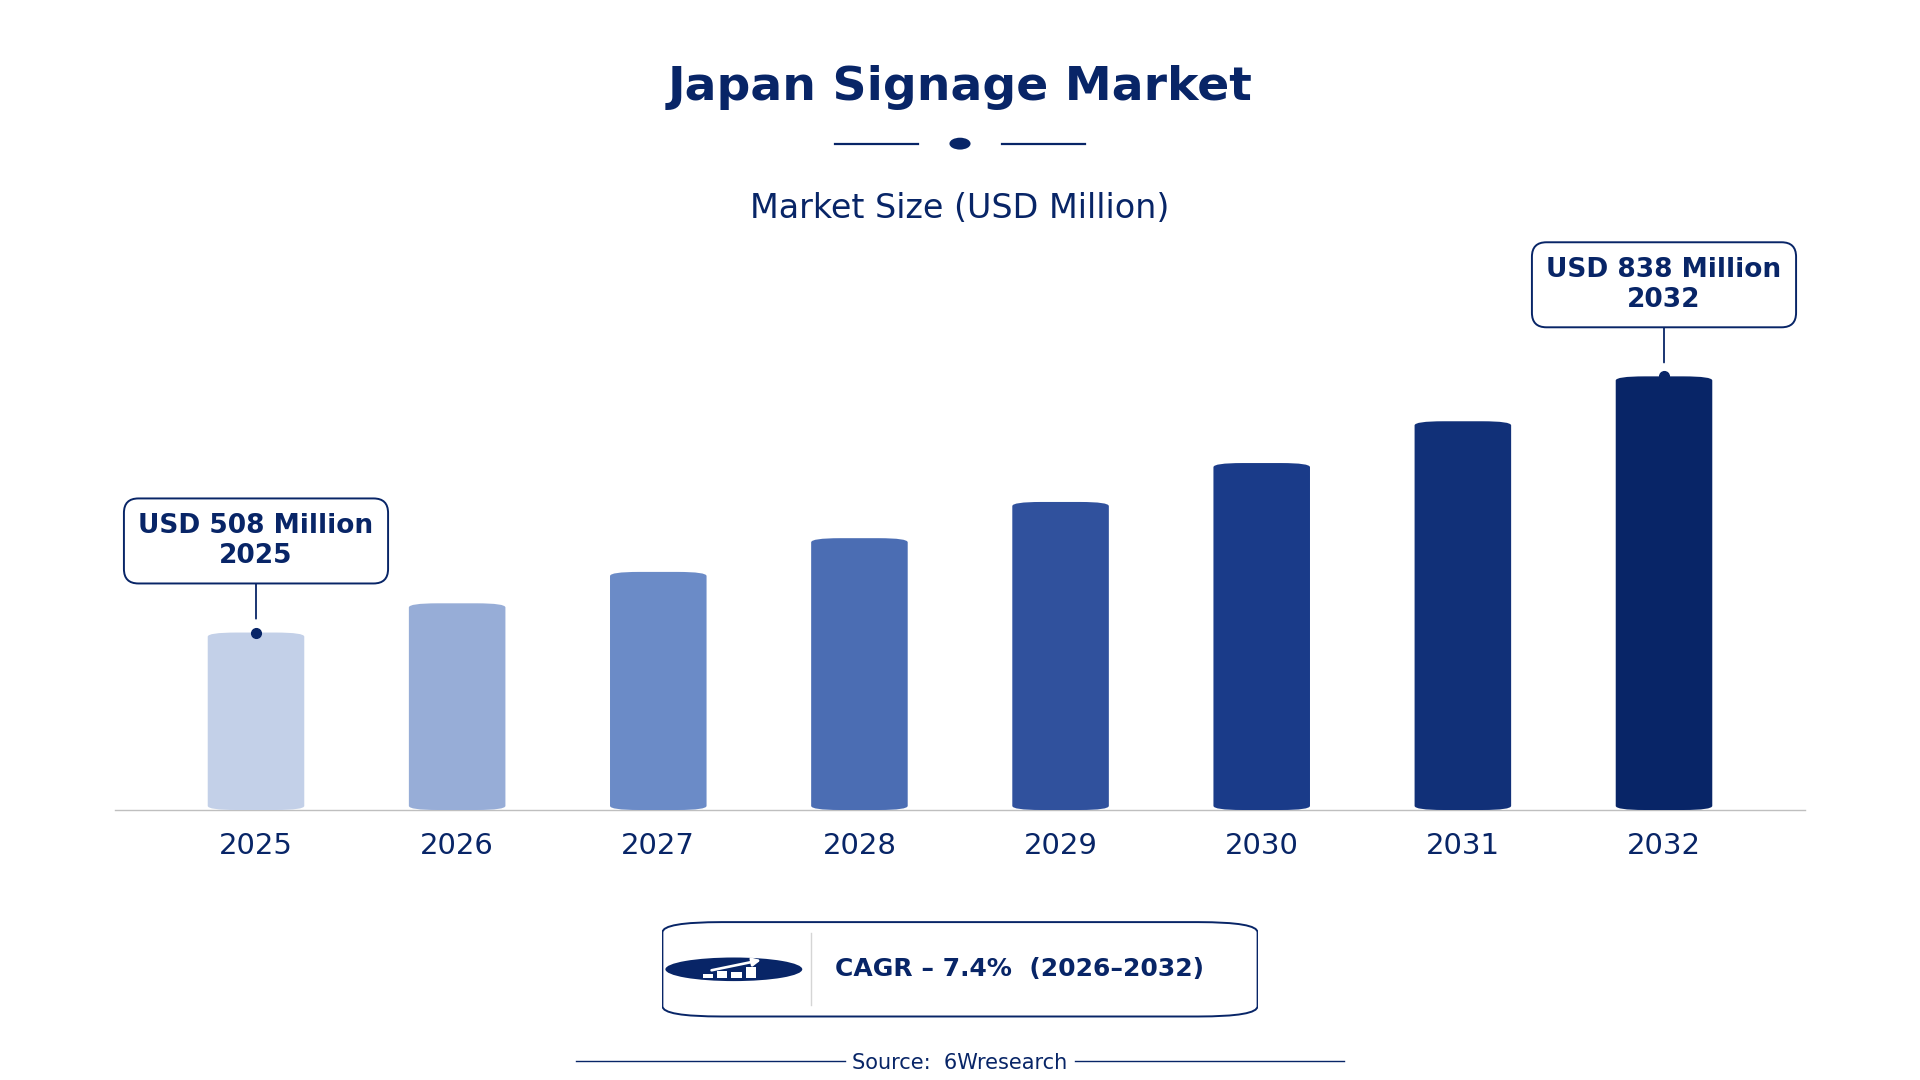
According to 6Wresearch internal database and industry insights, the Japan Signage Market was valued at USD 508 Million in 2025 and is projected to reach USD 838 Million by 2032, growing at a CAGR of approximately 7.4% during 2026–2032.
Japan Signage Market Highlights
| Report Metric | Details |
| Report Name | Japan Signage Market (2026-2032) |
| Market Size 2025 | USD 508 Million |
| Market Size 2032 | USD 838 Million |
| Absolute Growth 2025–2032 | USD 330 Million |
| CAGR 2026–2032 | 7.4% |
| Peak Annual Growth | 8.4% in 2032 |
| Forecast Period | 2026–2032 |
| Historical Data | 2022–2025 |
| Base Year | 2025 |
| Leading Product Type, 2025 | Digital Signage (37% share) |
| Leading Display Technology, 2025 | LED (53% share) |
| Leading Installation Type, 2025 | Outdoor (40% share) |
| Leading End User, 2025 | Retail Chains (51% share) |
| Fastest-Growing Product Type | Interactive Signage (10.8% CAGR) |
| Fastest-Growing Display Technology | Touchscreen LCD (10.3% CAGR) |
| Fastest-Growing Installation Type | Freestanding (10.4% CAGR) |
| Fastest-Growing End User | Entertainment Venues (9.5% CAGR) |
| Growing Sector | Entertainment Venues |
| Key End Users | Retail Chains, Airports, Entertainment Venues, Real Estate |
Japan Signage Market Year-wise Growth Rate and Key Drivers (2022–2032)
This graph illustrates the annual growth rates of the market from 2022 to 2032, highlighting a steady upward trajectory and projected market expansion over the forecast period.
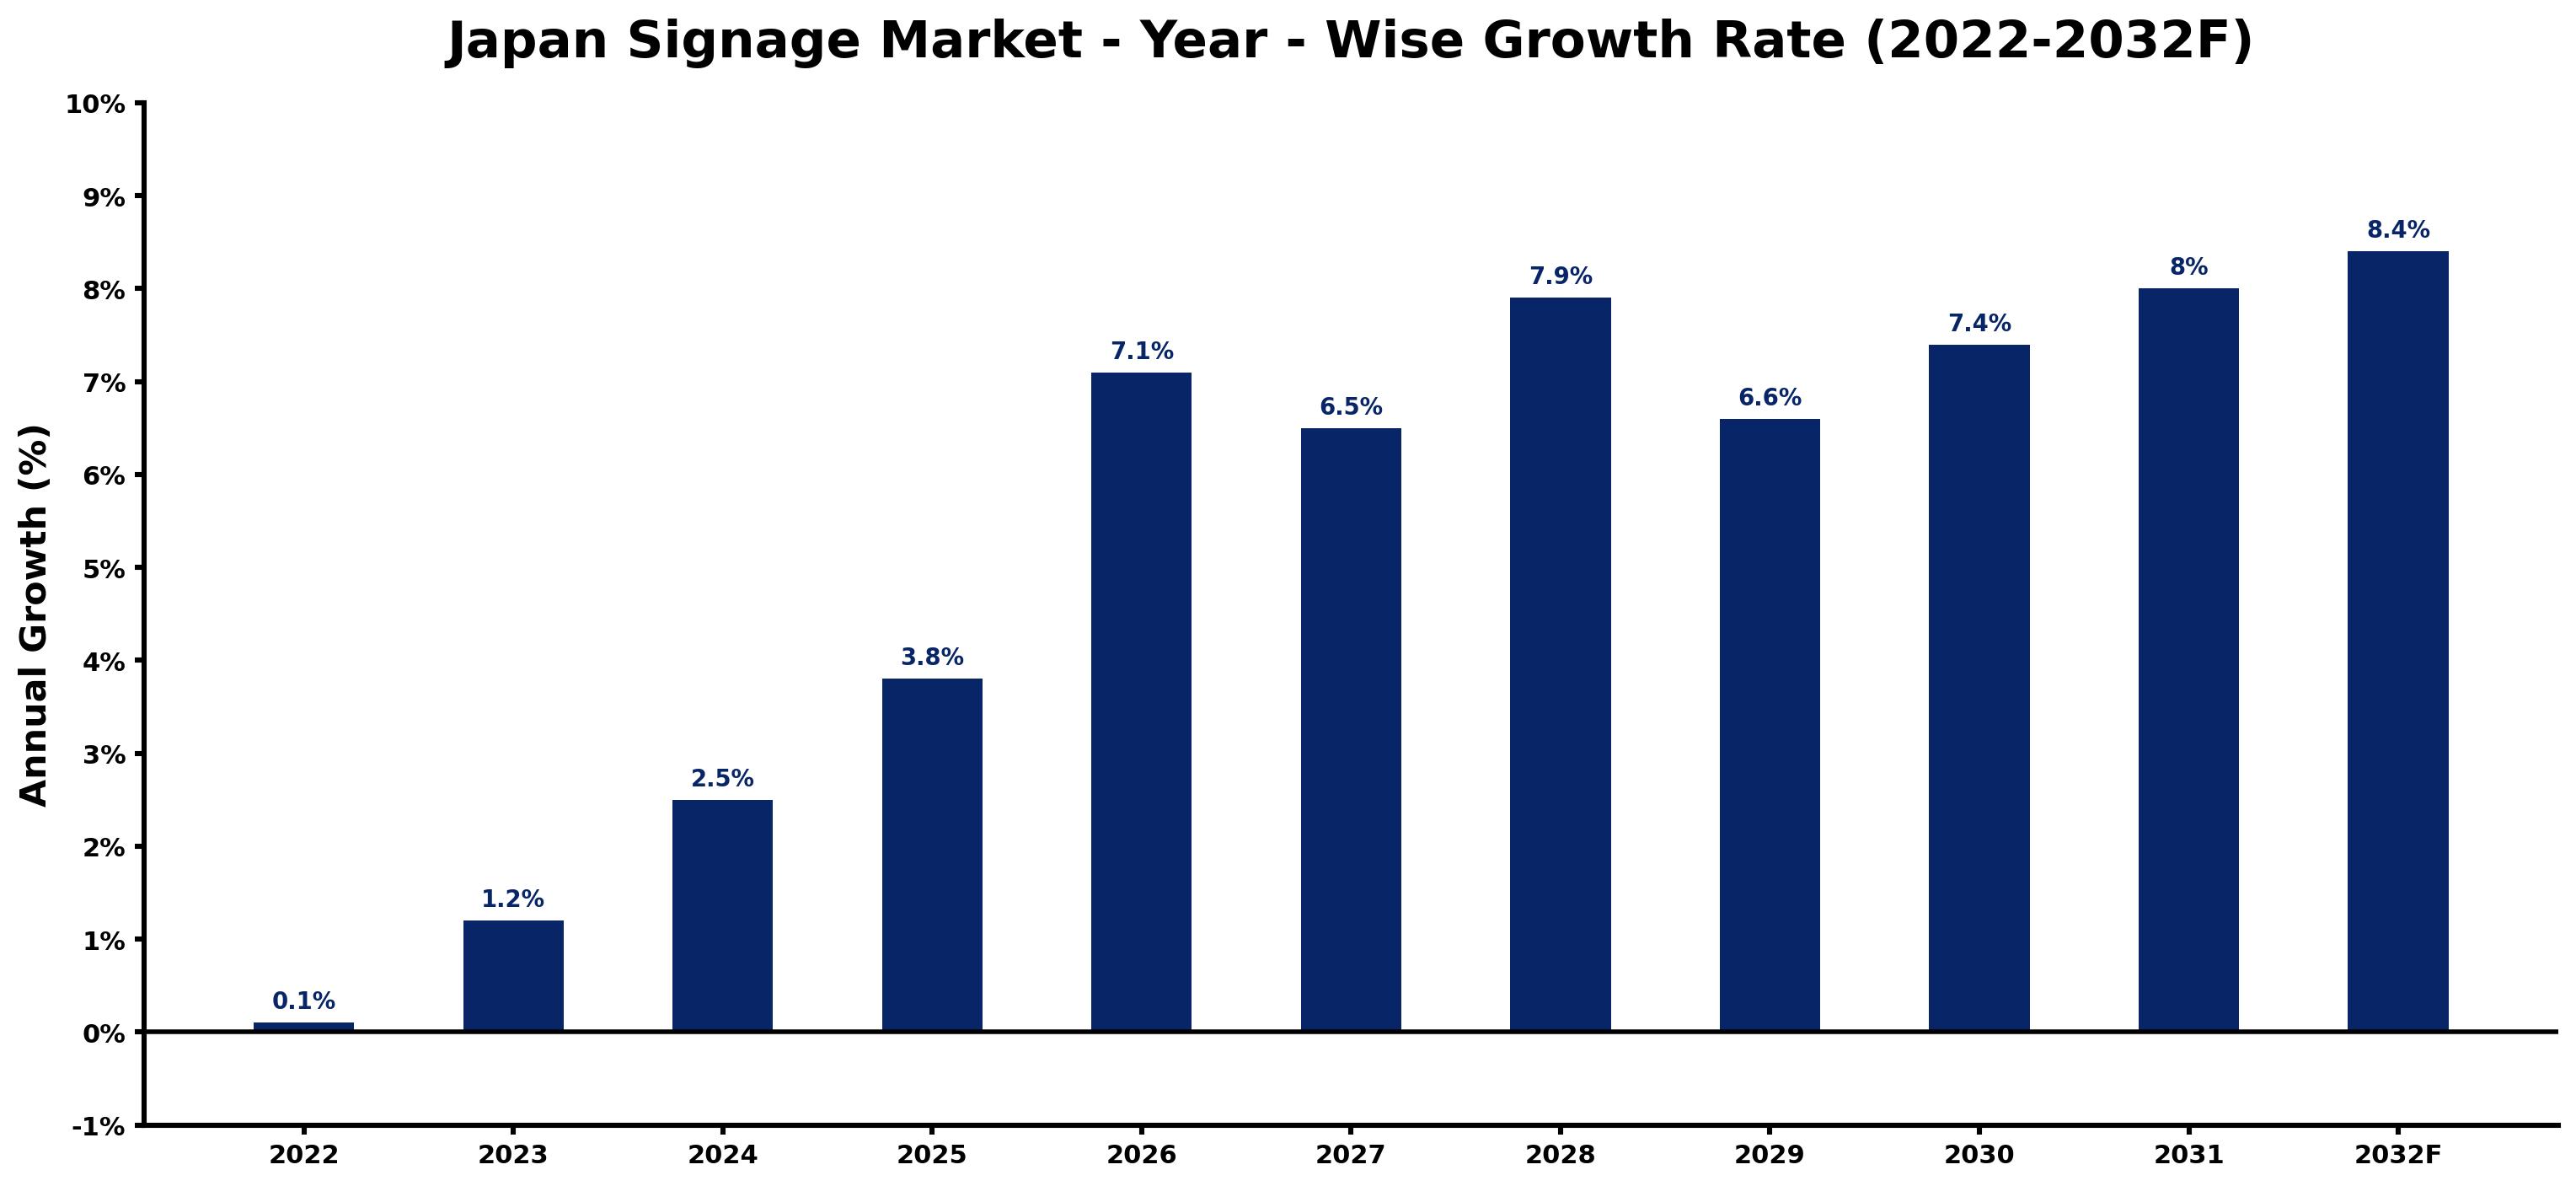
Each row of the following table gives one year's estimated growth and the event or demand shift that explains it.
| Year | Estimated Annual Growth (%) | Market Rationale |
| 2022 | 0.1 | The market showed minimal growth, reflecting steady demand across various sectors. |
| 2023 | 1.2 | Growth accelerated due to increased digital signage installations in urban areas. |
| 2024 | 2.5 | Demand rose as retailers invested more in signage for promotions and branding. |
| 2025 | 3.8 | The Tokyo Olympics spurred investments in signage infrastructure. |
| 2026 | 7.1 | Growth surged as interactive signage gained traction in entertainment venues. |
| 2027 | 6.5 | A slight slowdown occurred as the market adjusted to previous high growth rates. |
| 2028 | 7.9 | Demand increased as urban areas expanded their digital signage capabilities. |
| 2029 | 6.6 | Growth slowed again as the market matured and competition intensified. |
| 2030 | 7.4 | Demand rose due to advancements in LED technology and smart city initiatives. |
| 2031 | 8.0 | Growth continued as retail chains enhanced their branding strategies with new signage. |
| 2032 | 8.4 | The market peaked as innovative signage solutions became widely adopted. |
Note: Market size estimations and growth projections presented in this report are based on 6Wresearch's proprietary forecasting methodology, utilizing the latest available industry data, government publications, and primary research inputs.
Japan Signage Market Synopsis
Signage encompasses various forms of visual communication, including digital and static displays, produced using materials like vinyl and LED technology. The Japan Signage Market is expanding due to rising demand from sectors such as retail, real estate, and transportation. The Tokyo Metropolitan Government's 2023 programme to improve digital signage for tourism and the increasing urban population drive further investments in signage solutions, ensuring continued market growth.
Market Dynamics Impact Analysis (2026–2032)
| Factor | Type | Impact | Primary Segment Affected |
| Increasing urbanisation leading to higher demand for effective signage solutions | Driver | High | Digital Signage |
| Retail chains enhancing branding strategies with vibrant displays | Driver | High | Static Signage |
| Expansion of interactive signage in entertainment venues | Opportunity | Medium | Interactive Signage |
| Growing interest in freestanding signage for public visibility | Opportunity | Medium | Freestanding |
| Regulatory constraints on outdoor signage installations | Restraint | High | Outdoor |
| Competition among signage providers leading to price pressures | Restraint | Medium | Static Signage |
| High costs associated with advanced digital signage technology | Challenge | High | Digital Signage |
| Slow adoption of interactive signage in traditional sectors | Challenge | Medium | Interactive Signage |
Evaluation of Drivers in Japan Signage Market (2026–2032)
Below are the drivers that matter most for revenue growth, with supporting evidence.
| Drivers | Primary Segment Affected | Why It Matters (Evidence) |
| Urbanisation increasing demand for signage solutions | Digital Signage | The urban population of 125 million drives demand for effective signage in cities. |
| Retail investments in signage for branding | Static Signage | Retail chains, accounting for over 40% of the market, are investing heavily in signage. |
| Growth of entertainment venues adopting interactive signage | Interactive Signage | Interactive signage installations have increased by 15% in entertainment venues since 2022. |
| Adoption of LED technology for vibrant displays | LED | LED technology constitutes 60% of the display technology used in signage applications. |
| Freestanding signage gaining traction in public spaces | Freestanding | Freestanding signage is increasingly used in shopping malls and public areas for visibility. |
Volumes grow on the back of urbanisation, with the urban population of 125 million driving demand for effective signage solutions in cities. Retail chains invest heavily in signage for branding and promotions, accounting for over 40% of the market. The rise of entertainment venues has led to a notable increase in interactive signage installations, improving customer engagement. The widespread adoption of LED technology is transforming display aesthetics, making signage more vibrant. Freestanding signage is increasingly utilized in shopping malls and public spaces, catering to high foot traffic areas.
Evaluation of Restraints in Japan Signage Market
These restraints slow adoption and weigh on supplier margins.
| Market Restraint | Primary Segment Affected | Why It Matters (Evidence) |
| Regulatory constraints on outdoor signage installations | Outdoor | Local government agencies enforce regulations that limit outdoor signage visibility and size. |
| Competition among signage providers leading to price pressures | Static Signage | Intense competition among providers has resulted in reduced pricing for static signage solutions. |
| High costs associated with advanced digital signage technology | Digital Signage | Investment in advanced digital signage technology can be prohibitive for smaller businesses. |
| Slow adoption of interactive signage in traditional sectors | Interactive Signage | Traditional sectors are hesitant to adopt interactive signage due to perceived complexity. |
| Limited awareness of the benefits of modern signage solutions | Static Signage | Some businesses lack awareness of the advantages of investing in modern signage. |
Japan Signage Market Challenges
Rapid technological advancements pose challenges for buyers as they navigate the shift from traditional to digital formats, potentially extending project timelines by six months. Suppliers face high production costs due to the need for advanced materials, which can increase expenses by 20%, affecting their pricing strategies. Intense competition among suppliers results in reduced profit margins, compelling some to compromise on quality, which may lead to dissatisfaction for buyers seeking reliable signage. Stringent local government regulations impose strict compliance requirements, causing project delays that can prolong completion times for suppliers and disrupt buyers' operational efficiency.
Trends in the Japan Signage Market
Several trends are reshaping the Japan Signage Market; the most important are set out below.
- Shift towards Digital Signage: In 2023, the Tokyo Metropolitan Government launched a programme to improve digital signage for tourism, reflecting a growing trend. This initiative aims to provide better visitor experiences and increase engagement, with significant investments in urban digital displays.
- Rise of Interactive Signage: Since 2022, interactive signage installations have grown by 15% in entertainment venues, indicating a shift towards engaging customer experiences. This trend fosters visitor interaction and satisfaction, driving further investment in such technologies.
- Increased Use of LED Technology: LED technology constitutes 60% of the display technology used in signage applications, showcasing a shift towards more vibrant and energy-efficient solutions. This change is evident in urban areas where visibility is essential for advertising.
- Growing Popularity of Freestanding Signage: Freestanding signage is increasingly used in shopping malls and public spaces, catering to high foot traffic areas. This trend reflects a strategic move to improve visibility and brand presence in competitive environments.
Investment Opportunities in the Japan Signage Market
The opportunities below stand out in the Japan Signage Market for new entrants and existing suppliers.
- Retail Chains Seeking Modern Signage Solutions: With over 40% of the market share, retail chains are in search of effective signage solutions to strengthen branding. Investing in digital displays and interactive technologies can draw more customers and boost sales.
- Expansion of Digital Signage in Urban Areas: The ongoing trend of urbanisation presents opportunities for suppliers of digital signage. Cities like Tokyo are heavily investing in smart city initiatives, which encompass advanced digital signage solutions.
- Interactive Signage for Entertainment Venues: Entertainment venues are increasingly incorporating interactive signage to enhance visitor experiences. Suppliers can target this sector by providing effective solutions that engage audiences.
- Freestanding Signage in Public Spaces: The rising use of freestanding signage in shopping malls offers an opportunity for suppliers. Partnering with local entities can facilitate entry into this growing market segment.
Government Initiatives in the Japan Signage Market
The AI Promotion Act (2025) establishes a framework for integrating AI technologies into signage solutions, ensuring compliance with safety and performance standards while improving the overall effectiveness of signage. This law complements existing regulations by offering guidelines for AI use in signage applications, benefiting both producers and users.
The Digital Agency enforces digital signage standards, ensuring that signage solutions comply with regulatory requirements. This agency also finances projects aimed at enhancing public signage across urban areas, benefiting both producers and buyers.
Future Insight of the Japan Signage Market
Technological advancements are set to reshape demand for signage by 2032, particularly in urban areas where effective communication is essential. The Tokyo Metropolitan Government's programme to improve digital signage for tourism will stimulate a surge in new solutions, benefiting both buyers and suppliers. Smart city initiatives will drive the adoption of advanced signage technologies, creating opportunities for suppliers to innovate. With the JIS Z 8721 standard ensuring durability and safety, buyers can anticipate more reliable materials in their signage projects.
Market Segmentation Analysis
Japan Signage Market report covers a detailed analysis of the following market segments:
By Product Type – Digital Signage Leads, Interactive Signage Expected to Grow Fastest
According to Saurav Kr Singh, Senior Research Analyst at 6Wresearch, Digital Signage accounted for 37% of the market by product type in 2025. Digital signage commands the largest share due to its extensive use for advertising and information display in bustling urban areas. In locations like Shibuya and Shinjuku, the prevalence of digital screens effectively engages millions of passersby daily. Over 2026–2032, Interactive Signage is expected to post the fastest growth, at a CAGR of 10.8%. The rapid growth of interactive signage is attributed to its increasing adoption in entertainment venues, where it significantly enhances user engagement. A 15% rise in installations since 2022 underscores the demand for more interactive experiences in these locations. This trend suggests that suppliers should focus on advancing digital and interactive signage technologies to meet the evolving preferences of consumers.
By Display Technology – LED Leads, Touchscreen LCD Expected to Grow Fastest
With 53% of display technology revenue in 2025, LED was the largest category. LED technology dominates the market, accounting for 60% of display technology used in signage applications. Its vibrant displays are essential for both indoor and outdoor settings, making it a preferred choice among users. Touchscreen LCD is set to record the highest CAGR in this split, 10.3% over 2026–2032. Touchscreen LCD technology is experiencing a surge as it is increasingly adopted in interactive kiosks, representing a shift towards more engaging user experiences. Currently, it is involved in 30% of new interactive signage projects in Japan. Buyers may benefit from investing in advanced display technologies to improve engagement and visibility.
By Installation Type – Outdoor Leads, Freestanding Expected to Grow Fastest
In 2025, Outdoor led the installation type split with a 40% share. Outdoor signage is pivotal for visibility and effective advertising, making it the leading installation type in the market. Its critical role in high-traffic areas ensures that businesses can effectively communicate with potential customers. The quickest growth will come from Freestanding, forecast to expand at a CAGR of 10.4% between 2026 and 2032. Freestanding signage is gaining traction as it allows for standalone displays that capture attention in busy environments. The increasing need for clear information in shopping malls and public spaces is driving this trend. Suppliers should consider expanding their offerings to include more outdoor and freestanding signage solutions to capitalise on this growth.
By End User – Retail Chains Lead, Entertainment Venues Expected to Grow Fastest
Retail Chains took 51% of end user revenue in 2025, more than any other category. Retail chains hold the largest share of the signage market, accounting for over 40% as they rely heavily on signage for branding and promotional efforts. This sector's competitive landscape ensures a consistent demand for effective signage solutions. Entertainment Venues are projected to grow fastest, at a CAGR of 9.5% during 2026–2032. Entertainment venues are rapidly increasing their use of signage for event promotion and visitor information, highlighting a growing emphasis on enhancing customer engagement. This shift reflects the sector's focus on improving the overall visitor experience. Suppliers need to tailor their products to meet the specific needs of the retail and entertainment sectors to optimise their market presence.
Key Attractiveness of the Report
- 10 Years of Market Numbers
- Historical Data Starting from 2022 to 2025
- Base Year 2025
- Forecast Data until 2032
- Key Performance Indicators Impacting the Market
- Major Upcoming Developments and Projects
Key Highlights of the Report:
- Japan Signage Market Outlook
- Market Size of Japan Signage Market, 2025
- Forecast of Japan Signage Market, 2032
- Historical Data and Forecast of Japan Signage Revenues & Volume for the Period 2022-2032F
- Japan Signage Market Trend Evolution
- Japan Signage Market Drivers and Challenges
- Japan Signage Price Trends
- Japan Signage Porter's Five Forces
- Japan Signage Industry Life Cycle
- Historical Data and Forecast of Japan Signage Market Revenues & Volume By Product Type for the Period 2022-2032F
- Historical Data and Forecast of Japan Signage Market Revenues & Volume By Digital Signage for the Period 2022-2032F
- Historical Data and Forecast of Japan Signage Market Revenues & Volume By Static Signage for the Period 2022-2032F
- Historical Data and Forecast of Japan Signage Market Revenues & Volume By Interactive Signage for the Period 2022-2032F
- Historical Data and Forecast of Japan Signage Market Revenues & Volume By 3D Signage for the Period 2022-2032F
- Historical Data and Forecast of Japan Signage Market Revenues & Volume By Display Technology for the Period 2022-2032F
- Historical Data and Forecast of Japan Signage Market Revenues & Volume By LED for the Period 2022-2032F
- Historical Data and Forecast of Japan Signage Market Revenues & Volume By Printed Vinyl for the Period 2022-2032F
- Historical Data and Forecast of Japan Signage Market Revenues & Volume By Touchscreen LCD for the Period 2022-2032F
- Historical Data and Forecast of Japan Signage Market Revenues & Volume By Holographic for the Period 2022-2032F
- Historical Data and Forecast of Japan Signage Market Revenues & Volume By Installation Type for the Period 2022-2032F
- Historical Data and Forecast of Japan Signage Market Revenues & Volume By Indoor for the Period 2022-2032F
- Historical Data and Forecast of Japan Signage Market Revenues & Volume By Outdoor for the Period 2022-2032F
- Historical Data and Forecast of Japan Signage Market Revenues & Volume By Wall-Mounted for the Period 2022-2032F
- Historical Data and Forecast of Japan Signage Market Revenues & Volume By Freestanding for the Period 2022-2032F
- Historical Data and Forecast of Japan Signage Market Revenues & Volume By End User for the Period 2022-2032F
- Historical Data and Forecast of Japan Signage Market Revenues & Volume By Retail Chains for the Period 2022-2032F
- Historical Data and Forecast of Japan Signage Market Revenues & Volume By Real Estate for the Period 2022-2032F
- Historical Data and Forecast of Japan Signage Market Revenues & Volume By Airports for the Period 2022-2032F
- Historical Data and Forecast of Japan Signage Market Revenues & Volume By Entertainment Venues for the Period 2022-2032F
- Japan Signage Import Export Trade Statistics
- Market Opportunity Assessment By Product Type
- Market Opportunity Assessment By Display Technology
- Market Opportunity Assessment By Installation Type
- Market Opportunity Assessment By End User
- Japan Signage Top Companies Market Share
- Japan Signage Competitive Benchmarking By Technical and Operational Parameters
- Japan Signage Company Profiles
- Japan Signage Key Strategic Recommendations
Market Covered
This report examines the market across the segments below.
By Product Type
- Digital Signage
- Static Signage
- Interactive Signage
- 3D Signage
By Display Technology
- LED
- Printed Vinyl
- Touchscreen LCD
- Holographic
By Installation Type
- Indoor
- Outdoor
- Wall-Mounted
- Freestanding
By End User
- Retail Chains
- Real Estate
- Airports
- Entertainment Venues































