Japan Smart City Connectivity Market Size & Growth Rate
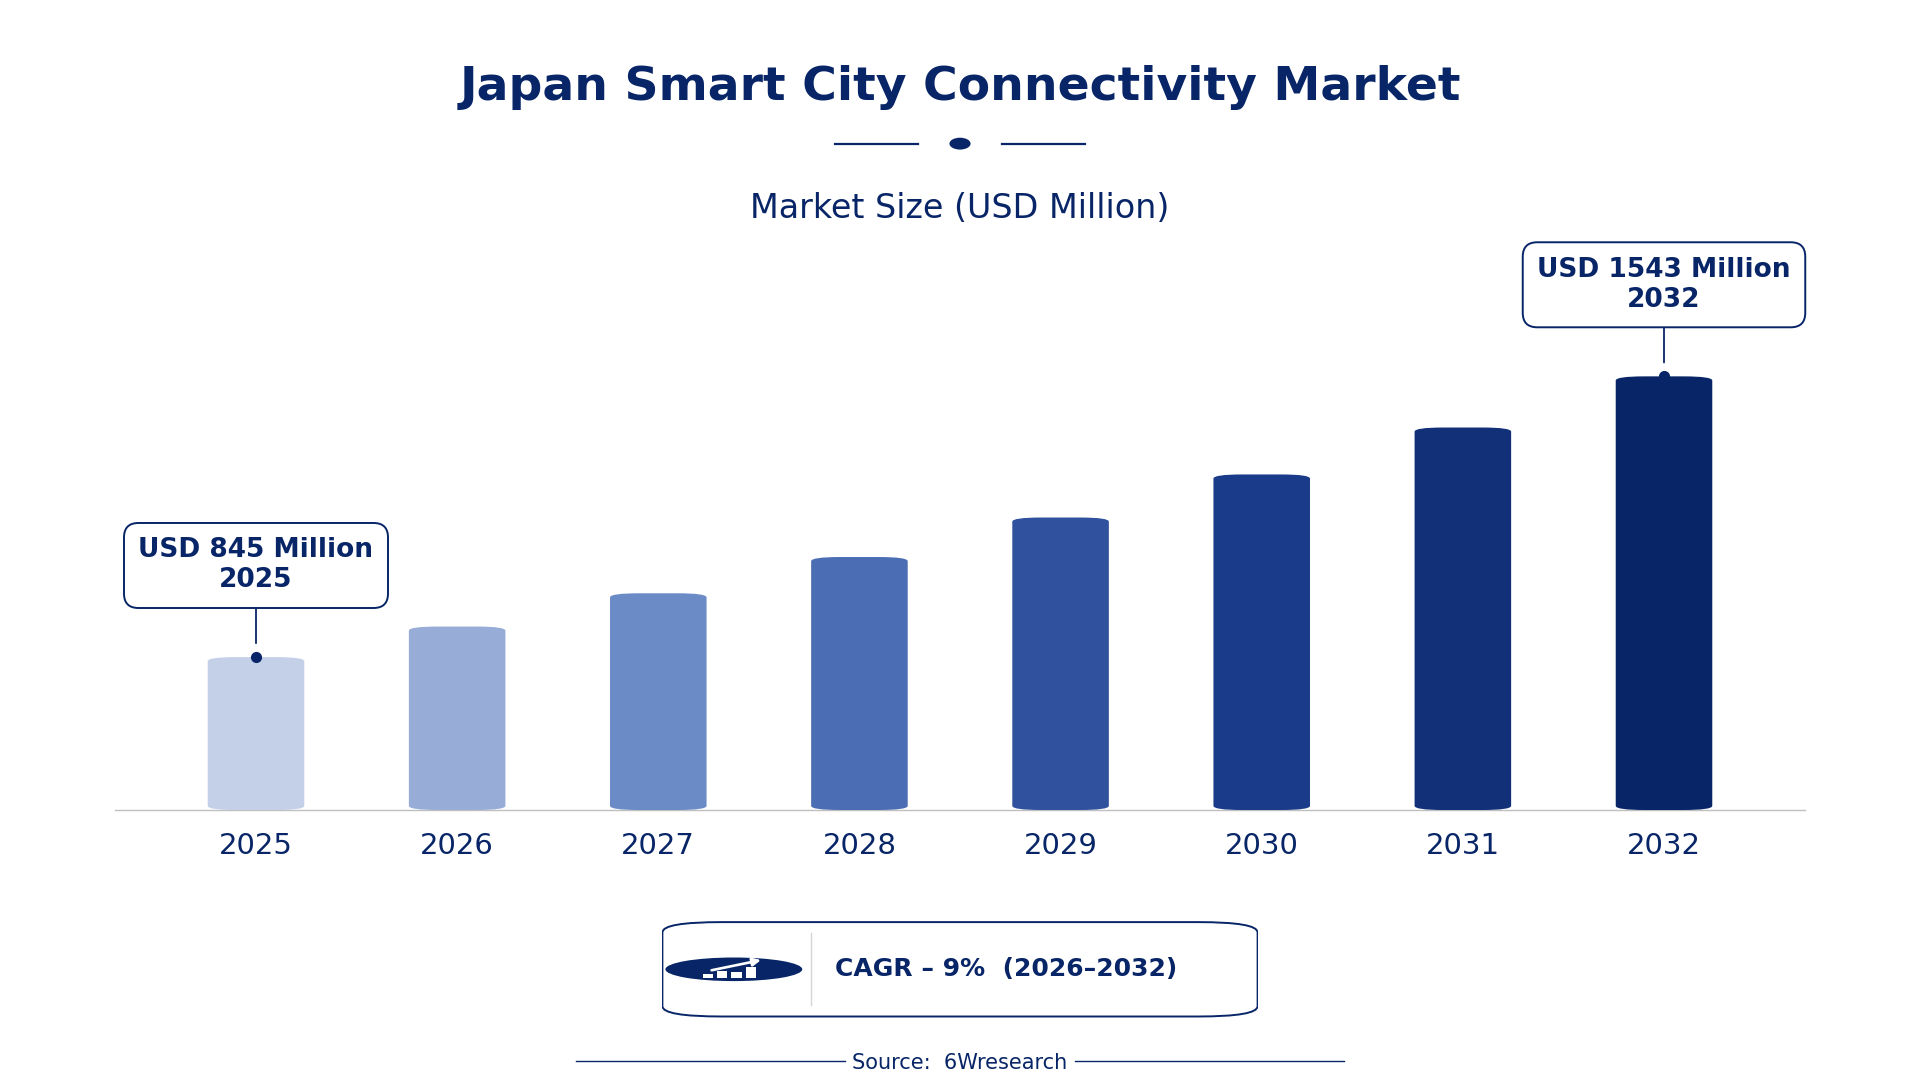
According to 6Wresearch internal database and industry insights, the Japan Smart City Connectivity Market was valued at USD 845 Million in 2025 and is projected to reach USD 1,543 Million by 2032, growing at a CAGR of approximately 9% during 2026–2032.
Japan Smart City Connectivity Market Highlights
| Report Metric | Details |
| Report Name | Japan Smart City Connectivity Market (2026-2032) |
| Market Size 2025 | USD 845 Million |
| Market Size 2032 | USD 1,543 Million |
| Absolute Growth 2025–2032 | USD 698 Million |
| CAGR 2026–2032 | 9% |
| Peak Annual Growth | 13.6% in 2032 |
| Forecast Period | 2026–2032 |
| Historical Data | 2022–2025 |
| Base Year | 2025 |
| Leading Connectivity Mode, 2025 | 5G-Enabled IoT (38% share) |
| Leading Network Type, 2025 | Cellular Network (52% share) |
| Leading Application Area, 2025 | Public Services Automation (36% share) |
| Leading End User, 2025 | Telecom Providers (49% share) |
| Fastest-Growing Connectivity Mode | LPWAN (12.6% CAGR) |
| Fastest-Growing Network Type | LoRaWAN/NB-IoT (13.3% CAGR) |
| Fastest-Growing Application Area | Utility Metering (11.5% CAGR) |
| Fastest-Growing End User | Smart City Developers (12.1% CAGR) |
| Growing Sector | Smart City Solutions |
| Key End Users | Telecom Providers, Smart City Developers, Urban Planners, Infrastructure Builders |
Japan Smart City Connectivity Market Year-wise Growth Rate and Key Drivers (2022–2032)
This graph illustrates the annual growth rates of the market from 2022 to 2032, highlighting a steady upward trajectory and projected market expansion over the forecast period.
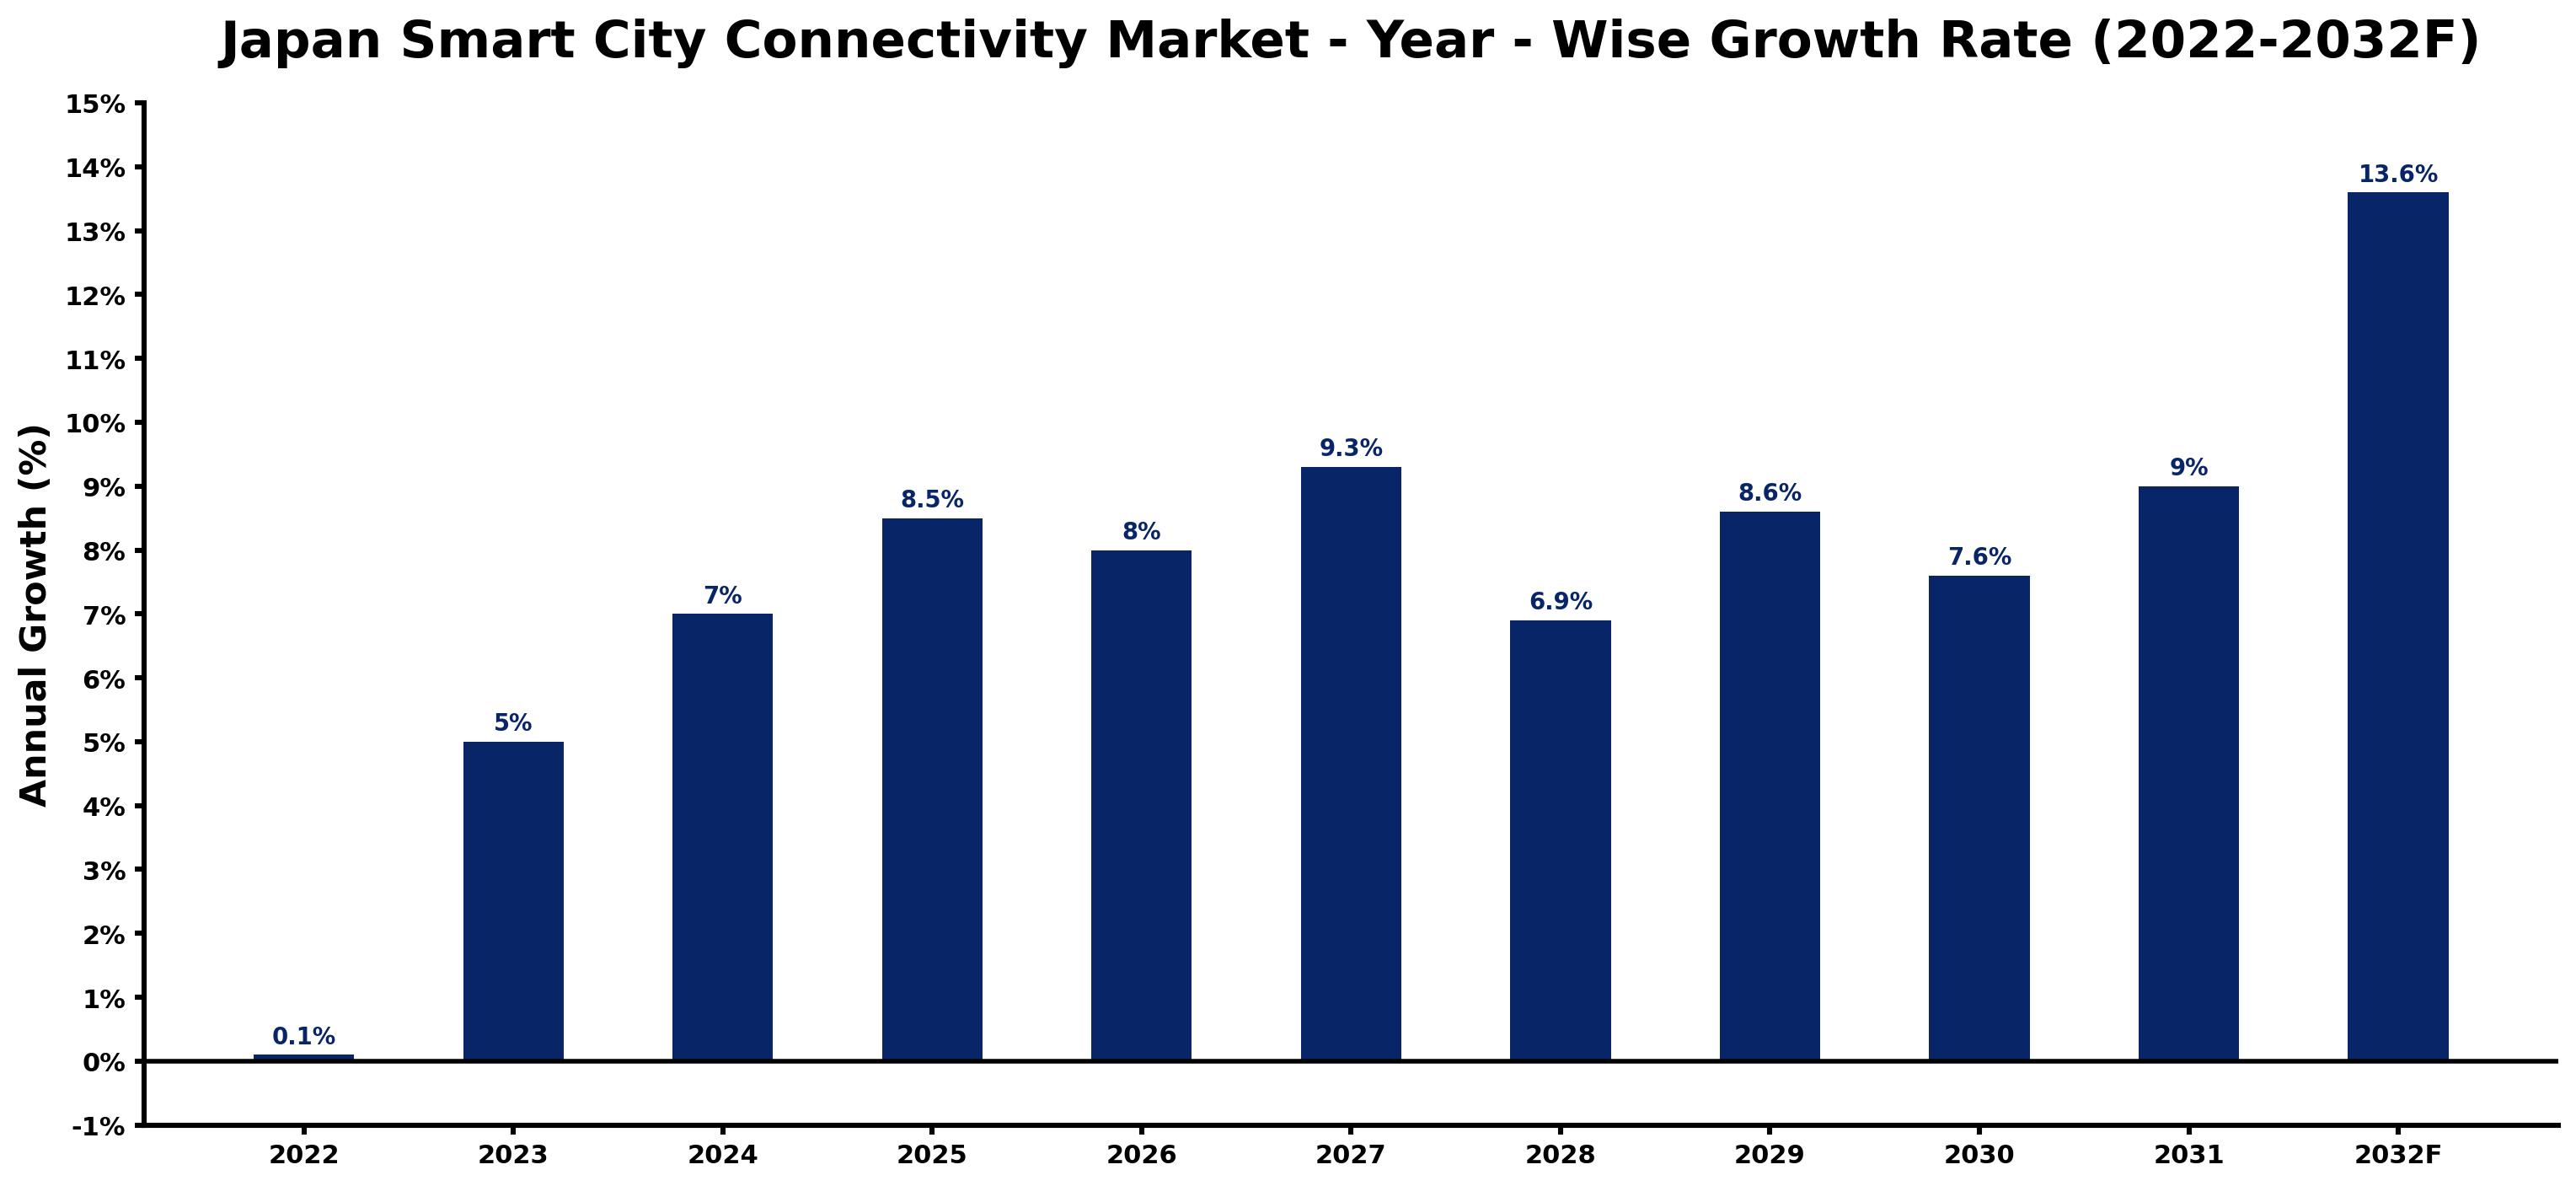
The table below sets out the estimated growth rate for each year and the main factor behind it.
| Year | Estimated Annual Growth (%) | Market Rationale |
| 2022 | 0.1 | The market exhibited minimal growth as initial smart city projects were underway. |
| 2023 | 5.0 | Growth accelerated as urban areas began implementing connectivity solutions. |
| 2024 | 7.0 | Demand continued to rise due to increasing IoT device deployment in cities. |
| 2025 | 8.5 | The market peaked as major cities launched extensive smart city initiatives. |
| 2026 | 8.0 | Growth slowed as projects reached maturity and demand stabilised. |
| 2027 | 9.3 | Demand increased again as new technologies were integrated into city planning. |
| 2028 | 6.9 | Growth moderated as the market adjusted to the saturation of early adopters. |
| 2029 | 8.6 | Demand picked up due to renewed investment in smart transport systems. |
| 2030 | 7.6 | Growth slowed again as urban planners focused on sustainability goals. |
| 2031 | 9.0 | Demand rose as smart city developers expanded their project scopes. |
| 2032 | 13.6 | The market is projected to peak again with advancements in connectivity technology. |
Note: Market size estimations and growth projections presented in this report are based on 6Wresearch's proprietary forecasting methodology, utilizing the latest available industry data, government publications, and primary research inputs.
Japan Smart City Connectivity Market Synopsis
Smart City Connectivity encompasses advanced communication technologies that enable seamless data exchange among urban infrastructure. Japan's population of approximately 126 million drives demand for efficient resource management solutions. With over 20 million IoT devices deployed in urban areas, the Japan Smart City Connectivity Market is poised for growth as the need for connectivity solutions escalates. The emphasis on automating public services and enhancing smart transport systems further propels this expansion, backed by government initiatives and public-private partnerships.
Market Dynamics Impact Analysis (2026–2032)
| Factor | Type | Impact | Primary Segment Affected |
| Increasing urbanisation drives demand for smart city solutions. | Driver | High | 5G-Enabled IoT |
| Government initiatives promote the adoption of 5G technology. | Driver | High | Fiber Backhaul |
| Rising investment in smart transport systems creates new opportunities. | Opportunity | High | Smart Transport/Surveillance |
| Public-private partnerships are encouraged for smart city projects. | Opportunity | High | Public Services Automation |
| High initial investment costs can deter project initiation. | Restraint | Medium | Utility Metering |
| Limited awareness among urban planners about smart technologies exists. | Restraint | Medium | Smart City Developers |
| Technological integration challenges can delay project timelines. | Challenge | High | Infrastructure Builders |
| Competition among cities for funding may restrict resources. | Challenge | High | Telecom Providers |
Evaluation of Drivers in Japan Smart City Connectivity Market (2026–2032)
The table below links each growth driver to the segment it affects and the evidence for it.
| Drivers | Primary Segment Affected | Why It Matters (Evidence) |
| Urban population growth increases demand for smart city solutions. | 5G-Enabled IoT | Japan's population of approximately 126 million necessitates efficient urban management. |
| Government initiatives support the expansion of high-speed networks. | Fiber Backhaul | Investment in the Fiber Optic Network Expansion Project improves connectivity. |
| Deployment of IoT devices facilitates real-time data collection. | LPWAN | Over 20 million IoT devices in urban areas drive demand for low-power networks. |
| Public services automation improves efficiency in service delivery. | Public Services Automation | Projects in over 50 municipalities enhance urban service management. |
| Smart transport systems integrate technology for traffic management. | Smart Transport/Surveillance | Implementation in over 10 major cities optimises urban mobility. |
Purchasing is picking up as urban areas increasingly deploy smart city solutions to manage resources effectively. With over 20 million IoT devices in use, demand for connectivity technologies rises, facilitating real-time data collection for city management. The expansion of fiber optic networks supports the deployment of smart services. Public services automation projects in over 50 municipalities improve service delivery efficiency. Smart transport systems implemented in over 10 major cities optimise traffic management, further driving demand for connectivity solutions.
Evaluation of Restraints in Japan Smart City Connectivity Market
The main factors holding the market back are set out below.
| Market Restraint | Primary Segment Affected | Why It Matters (Evidence) |
| High initial investment costs can deter project initiation. | Utility Metering | Investment in smart meters exceeds 30 million units, posing a financial barrier. |
| Limited awareness among urban planners about smart technologies exists. | Smart City Developers | Many planners lack knowledge of available smart city solutions, hindering adoption. |
| Technological integration challenges can delay project timelines. | Infrastructure Builders | Complexity of integrating various technologies can lead to project overruns. |
| Regulatory hurdles may slow down project approvals. | Telecom Providers | Compliance with multiple standards can delay the rollout of connectivity solutions. |
| Competition among cities for funding may restrict resources. | 5G-Enabled IoT | Cities vie for limited government subsidies, impacting project viability. |
Japan Smart City Connectivity Market Challenges
Buyers experience project delays due to reliance on specific technology providers for smart city connectivity, which can extend timelines by six months. Producers incur increased costs from compliance with standards set by the Ministry of Internal Affairs and Communications, inflating project budgets by 15%. Importers face fierce competition for government funding, leading to missed opportunities for essential grants in some municipalities. Skills shortages in advanced communication technologies hinder project execution, with over 30% of municipalities reporting difficulties in recruiting qualified personnel.
Trends in the Japan Smart City Connectivity Market
These developments are changing demand patterns in the Japan Smart City Connectivity Market.
- Shift towards 5G-Enabled IoT Solutions: The adoption of 5G-Enabled IoT technologies is rising across urban areas. As of 2023, over 20 million IoT devices have been deployed, reflecting a growing trend towards advanced connectivity.
- Transition from Traditional to Smart Transport Systems: Cities are increasingly replacing traditional transport systems with smart solutions to improve traffic management. In over 10 major cities, smart transport systems are being implemented, optimising urban mobility and safety.
- Public Services Automation Gaining Traction: Public services automation is becoming a priority for municipalities aiming to enhance service delivery. More than 50 municipalities are currently implementing automation projects, improving efficiency and responsiveness.
- Expansion of Fiber Optic Networks: The Fibre Optic Network Expansion Project is enhancing broadband access in urban areas. This initiative aims to support the growing demand for high-speed connectivity, with substantial investments in infrastructure.
Investment Opportunities in the Japan Smart City Connectivity Market
Investors looking at the Japan Smart City Connectivity Market should consider the following areas.
- Partnerships for Smart City Projects: Public-private partnerships are encouraged to support smart city initiatives. With over 30 million smart meters installed, collaboration between stakeholders can improve project outcomes.
- Investment in Smart Transport Solutions: Smart transport systems are in high demand due to urban congestion. Major cities are seeking solutions to improve traffic flow, creating opportunities for technology providers.
- Supply of IoT Devices for Urban Management: The deployment of over 20 million IoT devices indicates a need for advanced connectivity solutions. Suppliers can target urban planners and smart city developers to meet this demand.
- Expansion of 5G Infrastructure: The government's push for 5G technology adoption creates opportunities for infrastructure development. Telecom providers can collaborate with urban planners to improve connectivity.
Government Initiatives in the Japan Smart City Connectivity Market
The Building Energy Efficiency Act, amended in 2022, mandates that all new buildings comply with energy standards from April 2025. This law affects smart city developers by ensuring that new infrastructure aligns with sustainability goals and improves energy efficiency in urban areas. The New Robot Strategy, established in 2015, aims to expand robot use across various sectors, including smart city initiatives, thereby promoting innovation and technology integration.
The Ministry of Internal Affairs and Communications establishes smart city connectivity standards, ensuring compliance with regulations. The Tokyo Metropolitan Government actively supports smart city projects through funding and approvals, promoting best practices among stakeholders. The Smart City Expo Japan showcases innovations, attracting investment and collaboration in urban connectivity.
Future Insight of the Japan Smart City Connectivity Market
The Smart City Development Program will introduce advanced transport systems in over 10 major cities by 2025, improving connectivity. By 2032, over 50 million IoT devices are projected to be deployed, significantly enhancing data exchange among urban infrastructure. Government initiatives will drive the widespread adoption of 5G technology, improving communication capabilities. Increased public-private partnerships will facilitate collaborative projects that strengthen urban infrastructure and public services.
Market Segmentation Analysis
Japan Smart City Connectivity Market report covers a detailed analysis of the following market segments:
By Connectivity Mode – 5G-Enabled IoT Leads, LPWAN Expected to Grow Fastest
According to Saurav Kr Singh, Senior Research Analyst at 6Wresearch, 5G-Enabled IoT took 38% of connectivity mode revenue in 2025, more than any other category. The 5G-Enabled IoT segment commands the largest share due to its essential role in enabling real-time data collection and analysis, crucial for urban management. For instance, Tokyo's smart city initiatives rely heavily on this technology to enhance infrastructure and public services. LPWAN is projected to grow fastest, at a CAGR of 12.6% during 2026–2032. LPWAN is witnessing rapid growth as it supports low-power, long-range communication for smart devices, making it ideal for various urban applications. This trend is evident as cities increasingly adopt LPWAN for smart agriculture and environmental monitoring. Suppliers should focus on developing solutions that cater to the rising demand for both 5G and LPWAN technologies.
By Network Type – Cellular Network Leads, LoRaWAN/NB-IoT Expected to Grow Fastest
Cellular Network held 52% of the Japan Smart City Connectivity Market by network type in 2025. Cellular Network leads the market as it serves as the backbone for mobile connectivity in urban environments, ensuring reliable communication across diverse smart city applications. Its extensive deployment in cities like Tokyo highlights its critical role in urban infrastructure. Over 2026–2032, LoRaWAN/NB-IoT is expected to post the fastest growth, at a CAGR of 13.3%. LoRaWAN/NB-IoT is the fastest-growing segment, facilitating IoT connectivity for numerous applications, particularly in smart agriculture and environmental monitoring. The rapid rollout of these networks across various cities is propelling this growth. Buyers should consider investing in LoRaWAN/NB-IoT solutions to leverage their expanding capabilities in urban connectivity.
By Application Area – Public Services Automation Leads, Utility Metering Expected to Grow Fastest
Public Services Automation accounted for 36% of the market by application area in 2025. Public Services Automation dominates the market by significantly improving efficiency in service delivery across municipalities. The implementation of automation projects in over 50 municipalities demonstrates the transformative impact of smart technologies on public services. Utility Metering is set to record the highest CAGR in this split, 11.5% over 2026–2032. Utility Metering is rapidly growing as it enhances monitoring and management of utility services, aligning with government initiatives that promote smart metering solutions. The installed base of over 30 million smart meters indicates a strong trend towards this application. Suppliers must prioritise utility metering solutions to meet the increasing demand for efficient resource management in urban areas.
By End User – Telecom Providers Lead, Smart City Developers Expected to Grow Fastest
In 2025, Telecom Providers led the end user split with a 49% share. Telecom Providers hold the largest share as they play a crucial role in implementing connectivity solutions necessary for smart city projects. Their active involvement in initiatives throughout Japan underscores their essential contribution to the urban connectivity ecosystem. The quickest growth will come from Smart City Developers, forecast to expand at a CAGR of 12.1% between 2026 and 2032. Smart City Developers represent the fastest-growing segment as they integrate connectivity into urban planning, addressing the rising demand for smart city solutions. Their participation in projects aligns with government efforts to promote smart urban development. Buyers should collaborate with Smart City Developers to ensure their projects incorporate the latest connectivity solutions.
Key Attractiveness of the Report
- 10 Years of Market Numbers
- Historical Data Starting from 2022 to 2025
- Base Year 2025
- Forecast Data until 2032
- Key Performance Indicators Impacting the Market
- Major Upcoming Developments and Projects
Key Highlights of the Report:
- Japan Smart City Connectivity Market Outlook
- Market Size of Japan Smart City Connectivity Market, 2025
- Forecast of Japan Smart City Connectivity Market, 2032
- Historical Data and Forecast of Japan Smart City Connectivity Revenues & Volume for the Period 2022-2032F
- Japan Smart City Connectivity Market Trend Evolution
- Japan Smart City Connectivity Market Drivers and Challenges
- Japan Smart City Connectivity Price Trends
- Japan Smart City Connectivity Porter's Five Forces
- Japan Smart City Connectivity Industry Life Cycle
- Historical Data and Forecast of Japan Smart City Connectivity Market Revenues & Volume By Connectivity Mode for the Period 2022-2032F
- Historical Data and Forecast of Japan Smart City Connectivity Market Revenues & Volume By 5G-Enabled IoT for the Period 2022-2032F
- Historical Data and Forecast of Japan Smart City Connectivity Market Revenues & Volume By LPWAN for the Period 2022-2032F
- Historical Data and Forecast of Japan Smart City Connectivity Market Revenues & Volume By Wi-Fi Mesh for the Period 2022-2032F
- Historical Data and Forecast of Japan Smart City Connectivity Market Revenues & Volume By Fiber Backhaul for the Period 2022-2032F
- Historical Data and Forecast of Japan Smart City Connectivity Market Revenues & Volume By Network Type for the Period 2022-2032F
- Historical Data and Forecast of Japan Smart City Connectivity Market Revenues & Volume By Cellular Network for the Period 2022-2032F
- Historical Data and Forecast of Japan Smart City Connectivity Market Revenues & Volume By LoRaWAN/NB-IoT for the Period 2022-2032F
- Historical Data and Forecast of Japan Smart City Connectivity Market Revenues & Volume By Public Internet for the Period 2022-2032F
- Historical Data and Forecast of Japan Smart City Connectivity Market Revenues & Volume By Gigabit Internet for the Period 2022-2032F
- Historical Data and Forecast of Japan Smart City Connectivity Market Revenues & Volume By Application Area for the Period 2022-2032F
- Historical Data and Forecast of Japan Smart City Connectivity Market Revenues & Volume By Public Services Automation for the Period 2022-2032F
- Historical Data and Forecast of Japan Smart City Connectivity Market Revenues & Volume By Utility Metering for the Period 2022-2032F
- Historical Data and Forecast of Japan Smart City Connectivity Market Revenues & Volume By Smart Transport/Surveillance for the Period 2022-2032F
- Historical Data and Forecast of Japan Smart City Connectivity Market Revenues & Volume By Government Networks for the Period 2022-2032F
- Historical Data and Forecast of Japan Smart City Connectivity Market Revenues & Volume By End User for the Period 2022-2032F
- Historical Data and Forecast of Japan Smart City Connectivity Market Revenues & Volume By Telecom Providers for the Period 2022-2032F
- Historical Data and Forecast of Japan Smart City Connectivity Market Revenues & Volume By Smart City Developers for the Period 2022-2032F
- Historical Data and Forecast of Japan Smart City Connectivity Market Revenues & Volume By Urban Planners for the Period 2022-2032F
- Historical Data and Forecast of Japan Smart City Connectivity Market Revenues & Volume By Infrastructure Builders for the Period 2022-2032F
- Japan Smart City Connectivity Import Export Trade Statistics
- Market Opportunity Assessment By Connectivity Mode
- Market Opportunity Assessment By Network Type
- Market Opportunity Assessment By Application Area
- Market Opportunity Assessment By End User
- Japan Smart City Connectivity Top Companies Market Share
- Japan Smart City Connectivity Competitive Benchmarking By Technical and Operational Parameters
- Japan Smart City Connectivity Company Profiles
- Japan Smart City Connectivity Key Strategic Recommendations
Market Covered
The study includes the following segmentation.
By Connectivity Mode
- 5G-Enabled IoT
- LPWAN
- Wi-Fi Mesh
- Fiber Backhaul
By Network Type
- Cellular Network
- LoRaWAN/NB-IoT
- Public Internet
- Gigabit Internet
By Application Area
- Public Services Automation
- Utility Metering
- Smart Transport/Surveillance
- Government Networks
By End User
- Telecom Providers
- Smart City Developers
- Urban Planners
- Infrastructure Builders































